![]()
Prev Page--Groundwater Geochemistry, start || Next Page--References
Groundwater Geochemistry, continued
Regional Groundwater Geochemistry
Areal Geochemical Patterns
Salinity Characterization
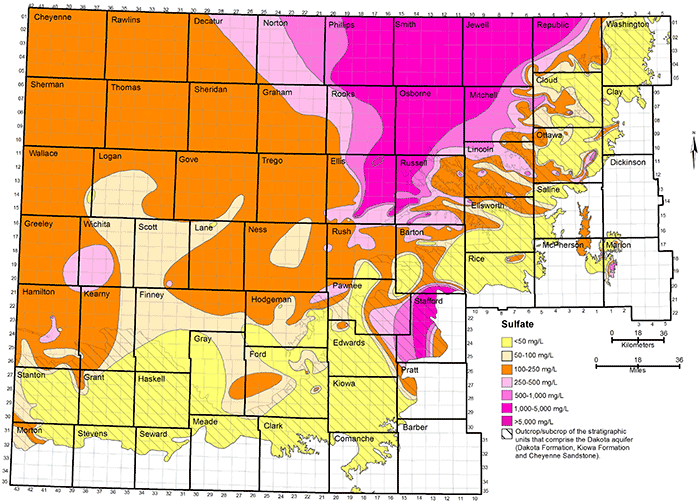
The TDS concentration of a groundwater is the chemical parameter that is commonly used to indicate the salinity. The anions chloride and sulfate are the most useful constituents for further characterization of the salinity of a water. The regional distributions of TDS, chloride, and sulfate concentrations in groundwaters in the upper Dakota aquifer are shown in figs. 32-34. Larger sized versions of these figures are available from the KGS. The maps represent only the upper part of the Dakota aquifer in each region because the shallower portion of the aquifer at a given location generally contains the least saline water, which would be the most usable in that area. In most regions, the maps represent the quality of water in the Dakota Formation, but in the outcrop area where the Dakota Formation has been removed by erosion, the upper Dakota aquifer in the maps can be the Kiowa Formation or Cheyenne Sandstone.
Figure 32--Distribution of TDS concentration in groundwaters in the Dakota aquifer.
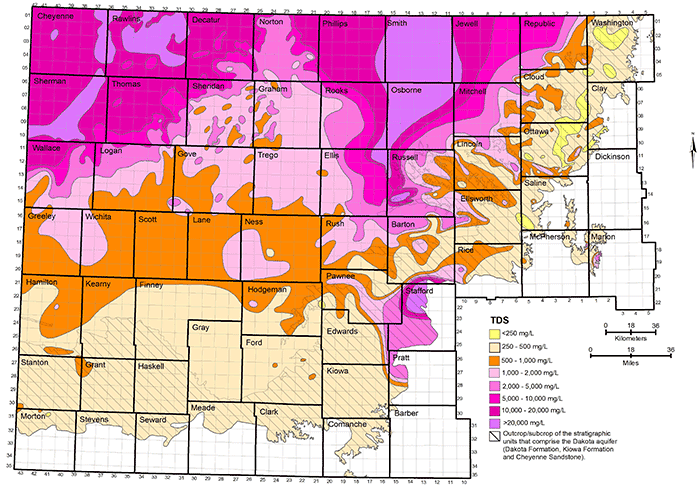
Figure 33--Distribution of chloride concentration in groundwaters in the Dakota aquifer.
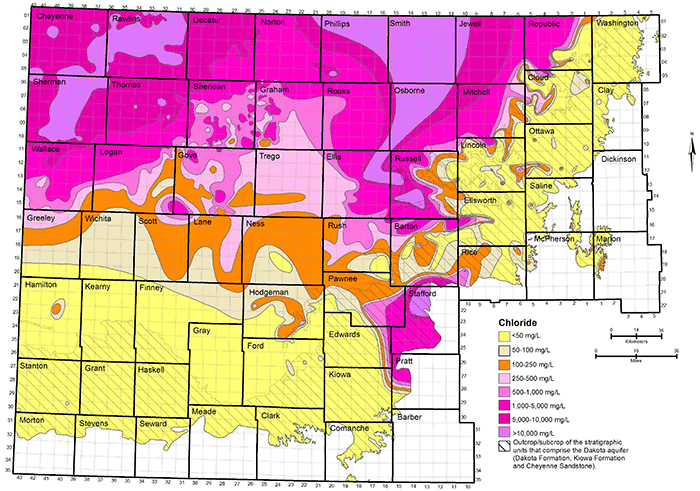
Figure 34--Distribution of sulfate concentration in groundwaters in the Dakota aquifer.
Data for the map of TDS concentrations in the Dakota aquifer are from chemical analyses (mainly in the area where water is used) and geophysical log interpretation (in the area of saline water without supply wells in northwest Kansas). The procedure used in obtaining TDS estimates from geophysical logs is described in the previous subsection on water quality from geophysical logs. The chloride concentration in northwest Kansas was estimated from the TDS values obtained from the geophysical log interpretation using the equation for high dissolved solids in fig. 6. The TDS and chloride concentrations in figs. 32 and 33 in western Stafford County, the southernmost part of Barton County south of the Arkansas River, southeast Pawnee County, easternmost Edwards County, and northwest Pratt County are inferred from analyses of water samples collected from observation wells screened at the base of the HPA overlying Dakota strata and in Permian rock underlying the Dakota (Whittemore, 1993). Saltwater intrudes upwards from the Cedar Hills Sandstone and other Permian units underlying Dakota strata to affect the HPA in that area. The maps were generated using ESRI ArcGIS software.
Figure 32 shows the distribution of TDS concentration in groundwater in the upper part of the Dakota aquifer. The eight TDS intervals separate the groundwater into the following categories that are defined for the purposes of this publication:
| < 250 mg/L--very fresh water |
| 250-500 mg/L--freshwater with less than the 500 mg/L recommended level for drinking water |
| 500-1,000 mg/L--freshwater with greater than the 500 mg/L recommended level for drinking water |
| 1,000-2,000 mg/L--slightly saline water |
| 2,000-5,000 mg/L--moderately saline water |
| 5,000-10,000 mg/L--saline water with less than the 10,000 mg/L limit for usability classification |
| 10,000-20,000 mg/L--very saline water with TDS greater than the 10,000 mg/L limit for usability classification |
| > 20,000 mg/L--brine |
The usability classification is part of the system used by the KDHE and the Kansas Corporation Commission for protection of water, such as from injection of wastewaters in the subsurface. Federal regulations for the control of underground wastewater injection also use the 10,000 mg/L TDS concentration in the definition of underground sources of drinking water (USDW) to be protected (U.S. Environmental Protection Agency, 2002).
Figure 33 displays the distribution of chloride concentration in the upper part of the Dakota aquifer. The eight divisions for chloride values have a rough correspondence to many of the divisions for TDS concentrations:
| < 50 mg/L--values typical for freshwater with TDS < 500 mg/L |
| 50-100 mg/L--values common for freshwater with 300-1,000 mg/L TDS |
| 100-250 mg/L--values common in fresh to slightly saline water with TDS of 500-1,500 mg/L; less than recommended drinking water limit of 250 mg/L chloride |
| 250-500 mg/L--values common in slightly to moderately saline water with TDS of 1,000-2,000 mg/L |
| 500-1,000 mg/L--values common in slightly to moderately saline water with TDS of 1,300-2,500 mg/L |
| 1,000-5,000 mg/L--values common in moderately saline to saline water with TDS of 2,000-10,000 mg/L; moderately saline to saline water with less than the 5,000 mg/L chloride limit for usability classification |
| 5,000-10,000 mg/L--values common in very saline water with 10,000-20,000 mg/L TDS; very saline water with greater than the 5,000 mg/L chloride limit for usability classification |
| > 10,000 mg/L--values typically occurring in brine with > 20,000 mg/L TDS |
The main reason for the overlap of the different TDS ranges for adjacent chloride intervals is that the concentrations of sulfate and bicarbonate and the cations providing the charge balance for these constituents can range widely in fresh to saline groundwaters in the Dakota aquifer.
Figure 34 shows the distribution of sulfate concentration in the upper part of the Dakota aquifer. The seven divisions for sulfate content have a rough correspondence to the following divisions for TDS:
| < 50 mg/L--values typical for freshwater with TDS < 500 mg/L |
| 50-100 mg/L--values common for freshwater with 250-1,300 mg/L TDS |
| 100-250 mg/L--values common in fresh to slightly saline water with TDS of 350-2,500 mg/L; less than the recommended drinking water limit of 250 mg/L sulfate |
| 250-500 mg/L--values common in slightly to moderately saline water with TDS of 600-6,000 mg/L |
| 500-1,000 mg/L--values common in slightly to moderately saline water with TDS of 1,000-10,000 mg/L |
| 1,000-5,000 mg/L--values common in moderately saline to saline water with TDS of 2,000-60,000 mg/L |
| > 5,000 mg/L--values typically occurring in saline water with > 10,000 mg/L TDS |
The main reason for the overlap of the different TDS ranges for adjacent sulfate intervals is that the concentrations of chloride and bicarbonate and the cations (mainly sodium) providing the charge balance for these constituents can range widely in fresh to saline groundwaters in the Dakota aquifer. High sulfate concentration is limited by the solubility of the minerals gypsum or anhydrite; sulfate values observed in Dakota aquifer water are less than 6,300 mg/L. Water with low sodium and chloride concentrations can be saturated with respect to gypsum at sulfate concentrations less than 2,000 mg/L. Higher sulfate concentrations than 2,000 mg/L can occur in waters with substantial concentrations of dissolved constituents other than calcium and sulfate, particularly sodium and chloride. The greater the concentration of these other ions (within the TDS content range of Dakota waters), the greater the solubility of gypsum and anhydrite because of the effect of ionic strength on the activities of calcium and sulfate ions in the mineral solubility product. Chloride concentration does not come close to the solubility limit of halite in the Dakota aquifer. Therefore, the upper range of common chloride and TDS contents for the intervals of high sulfate concentration are greater than the upper range of common sulfate and TDS contents for the intervals of high chloride concentration.
Groundwater in the Dakota aquifer is usually fresh (TDS content less than 1,000 mg/L) in the outcrop area and where the aquifer subcrops beneath unconsolidated deposits of alluvium in central and north-central Kansas and the HPA in south-central and southwestern Kansas (fig. 32). The freshest water (TDS content less than 250 mg/L) occurs in parts of Washington, Cloud, Clay, Ottawa, Ellsworth, and Saline counties in the central to eastern part of the outcrop belt from central to north-central Kansas. The less than 250 mg/L TDS water typically contains less than 50 mg/L chloride and less than 50 mg/L sulfate concentrations. Groundwater with 250-1,000 mg/L TDS content in the outcrop and subcrop belt in central and north-central Kansas usually has a greater sulfate than chloride level as indicated by the more prevalent areas of sulfate greater than 50 mg/L in these locations in fig. 34 than of chloride greater than 50 mg/L in fig. 33.
Freshwater occurs in the subcrop area of the Dakota aquifer underlying the HPA in south-central and southwestern Kansas (fig. 32). However, Dakota strata in parts of south-central Kansas are expected to contain saline water where saltwater intrudes upwards from the Cedar Hills Sandstone and other Permian units underlying Dakota strata to affect the HPA in that area. Freshwater extends into the confined portions of the aquifer in southwest Kansas and parts of south-central and west-central Kansas. Data from the interpretation of geophysical logs suggest that fingers of fresh to nearly fresh water (near 1,000 mg/L TDS) could exist in the confined aquifer as far north as southeastern Sheridan and southwestern Graham counties. As for the case in the outcrop area, the sulfate concentration is usually greater than the chloride content for these freshwaters.
The transition of freshwater to saline water (TDS content greater than 1,000 mg/L) in the Dakota aquifer in central and north-central Kansas generally occurs near the outcrop/subcrop boundary (fig. 32). The fresh to saline water transition near this boundary is irregular due to the convolutions in the boundary caused by the erosion of major valleys into the confining zone. The salinity of the groundwater increases substantially in a westerly direction from the outcrop/subcrop belt to a TDS level that exceeds 20,000 mg/L in most of Smith County, more than half of Osborne County, and parts of eastern Phillips, western Jewell, northwestern Mitchell, eastern Rooks, northeastern Ellis, and western Russell counties. West of this saltwater zone is a well-defined wedge of slightly to moderately saline groundwater (1,000-5,000 mg/L TDS) that points northward to the Nebraska border. The southern part of the wedge extends from Logan County on the west through Gove and Trego counties to Ellis County on the east. The center of the wedge occurs from southeastern Thomas County through Sheridan and Graham counties to western Rooks County. The top of the wedge is located in southeastern Decatur County and much of Norton County. Groundwater in the confined Dakota aquifer increases in salinity into northwest Kansas. In parts of northwest Kansas, primarily parts of Cheyenne, Rawlins, and Sheridan counties, the TDS concentration of the groundwater exceeds 20,000 mg/L.
The regional salinity pattern of Dakota groundwaters is mainly dependent on the rate at which freshwater is able to enter from above and along the long, regional flow paths in the aquifer in comparison with the rate of saltwater intrusion from the underlying Permian rocks. In some regions, the saltwater is able to more rapidly intrude into the bottom of the Dakota, such as in parts of south-central to central to north-central Kansas where the Dakota directly overlies the Cedar Hills Sandstone or other saltwater-containing Permian strata. In northwest Kansas, the thickness of the confining units is great and the rate of freshwater throughflow is low. The Dakota rocks contain saltwater in both of these regions. Surface recharge along the outcrop belt of the Dakota aquifer in southeast Colorado and central Kansas occurs at a much greater rate than underlying saltwater intrusion, resulting in essentially complete flushing of any previous saltwater. Fresh recharge flowing through the Dakota sandstones in southwest Kansas has also removed nearly all salinity. The freshwater flowing through sandstones in the confined aquifer between northwest and central Kansas has removed much of the saltwater but enough dissolved salt remains to make much of the water slightly to moderately saline. The western side of the wedge of Dakota groundwater with TDS less than 5,000 mg/L between northwest and north-central Kansas reflects where the flushing rate has been greater than the saltwater intrusion rate; in the eastern side, the saltwater intrusion rate is greater than that of the flushing. The rate of any flushing is slow, such that substantial changes over regional distances take many thousands of years. In general, for the confined aquifer, the greater the distance from the edge of the confining zone, the greater is the salinity.
Groundwater in the areas of the upper Dakota aquifer with high TDS content (greater than 5,000 mg/L) shown in fig. 32 is of sodium-chloride type. The molar ratio of sodium/chloride can approach 1 (mass ratio of 0.65) in the waters with the highest salinity. Water in the area of the confined aquifer with 500-2,000 mg/L TDS is generally soft (low calcium and magnesium content) and of sodium-bicarbonate type. The sodium/chloride molar ratio can substantially exceed 1 in this water. Groundwater with 2,000-5,000 mg/L TDS in the confined area is typically transitional between sodium-bicarbonate and sodium-chloride type. The sodium/chloride molar ratio is greater than 1 in this water. Groundwater in the outcrop and subcrop areas with less than 500 mg/L TDS content is usually of calcium-bicarbonate type and sometimes of calcium, magnesium-bicarbonate type. Concentrations of TDS between 500 and 2,000 mg/L in water in the outcrop/subcrop areas are often due primarily to dissolved calcium and sulfate contents such that the waters can be calcium-sulfate in type. Elevated sulfate concentration with substantially lower chloride content can produce sulfate type water in less saline portions of the confined aquifer.
Fluoride and Nitrate Distributions
Groundwater in the Dakota aquifer typically contains a low fluoride concentration (less than 1 mg/L) in the outcrop and subcrop areas where calcium-bicarbonate type water is the common chemical type (fig. 35). Low fluoride water also occurs in parts of the confined aquifer near the outcrop/subcrop boundary. Fluoride concentration is usually 1-3 mg/L in both the Dakota and High Plains aquifers in most of the region where the Dakota directly underlies the HPA in southwest Kansas. This concentration range is from less than to greater than the 2 mg/L recommended upper limit for potable use but is less than the 4 mg/L maximum contaminant level for public supplies of drinking water.
Figure 35--Distribution of fluoride concentration in groundwaters in the Dakota aquifer. The six counties in northwest Kansas are not shaded because no data for fluoride are available in that area.
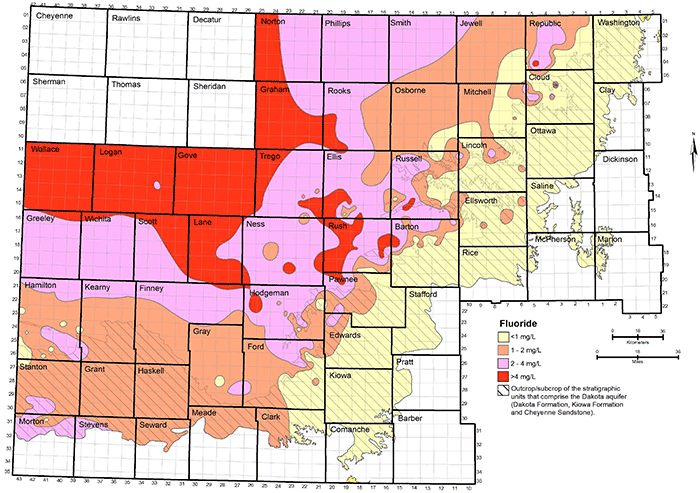
Fluoride content generally increases from about 1 mg/L near the outcrop/subcrop boundary to greater than 4 mg/L in a direction toward greater thicknesses of Upper Cretaceous rocks confining the Dakota aquifer (fig. 35). Higher fluoride concentration is generally associated with sodium-bicarbonate or mixed cation-anion type waters in the confined aquifer. Water in the area of the confined aquifer with a TDS content in the range 500-2,000 mg/L that is soft (low calcium and magnesium content) often has relatively high fluoride concentration (greater than 4 mg/L). This type water occurs in the confined aquifer from west-central Kansas toward central Kansas. Whether the fluoride content of the highly saline water in northwest Kansas also exceeds 4 mg/L is unknown. However, the high calcium concentration in the saline water is generally expected to limit the fluoride content below a few to several mg/L.
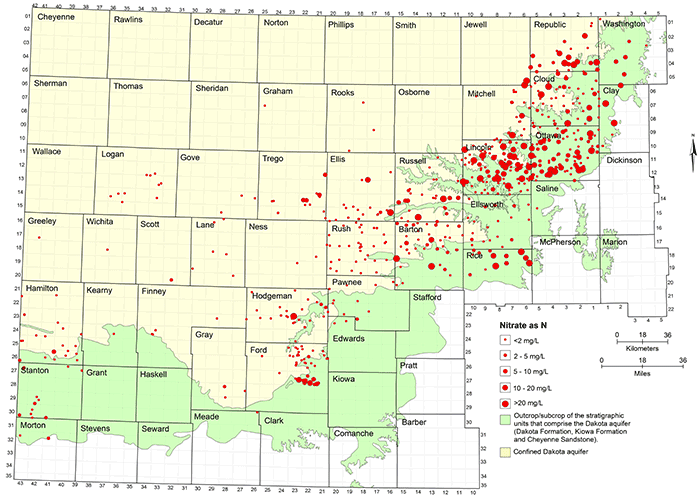
Natural nitrate concentration in Dakota groundwater is usually less than 2 mg/L as nitrate-nitrogen. The low nitrate water occurs both in the unconfined and confined portions of the aquifer (fig. 36). Anthropogenic activities have contaminated groundwater to produce nitrate-nitrogen concentrations that have sometimes exceeded 100 mg/L in the Dakota aquifer (fig. 25). Contaminated groundwaters are mainly distributed in the area of the unconfined aquifer but also occur in the confined aquifer, especially near the confined-unconfined boundary in central and north-central Kansas (fig. 36). As described in the previous section on contamination characterization, nitrate contamination of the confined aquifer occurs from surface infiltration to a shallow water table or the flow of water from the surface or near surface down the unsealed or poorly sealed annulus in a well borehole. Most of the water produced from wells in the confined aquifer in western Kansas has not been contaminated by nitrate, suggesting better well construction.
Figure 36--Nitrate concentration in groundwaters at well locations in the Dakota aquifer.
Distribution of Chemical Water Types
A wide range in chemical water types occurs across the Dakota aquifer as indicated by the different distributions of major constituents. A water type is determined from calculation of the equivalent concentrations of the ionic constituents. Table 8 lists the number of well waters for each water type based on the data set assembled and assessed for the Dakota Aquifer Program and meeting qualifications for assigning water types. The table includes all samples for which determinations of at least calcium, magnesium, sodium, bicarbonate, sulfate, and chloride concentrations exist. If potassium and nitrate determinations also exist, they were also used in the calculations. Only one sample per well was considered in the type distribution; the latest sample was included for wells from which multiple samples were collected. The well samples were divided into three different groups according to the location of the well in the Dakota aquifer: 1) the outcrop/subcrop area up to near the boundary with the confined aquifer, 2) the confined area up to near the boundary with the outcrop/subcrop area, and 3) a band along the boundary of the confined and outcrop/subcrop areas. The wells in the outcrop/subcrop area comprise the greatest number of the wells because this area generally has the best water quality and shallower depths to water. Thus, this area is preferentially drilled for water supply from the Dakota aquifer, especially domestic and small stock wells.
The following procedure was used to classify the water types: 1) if a single cation or anion comprises more than 50% of the total equivalent concentration of cations or anions, respectively, a second cation or anion is used in the type name if it exceeds 40% of the total; 2) if the cation or anion in greatest concentration is between 40% and 50% of the total, a second cation or anion is used in the type name if it exceeds 33%; 3) if no cations or anions exceed 40% of the total, all cations or anions that have concentrations within 10% of the ion in greatest concentration are included in the type name. Multiple ion names are listed in order of decreasing percentage.
By far the most common anionic type of water in the outcrop/subcrop area (not near the boundary with the confined aquifer) is bicarbonate, followed by sulfate and then chloride (table 8). Four well waters had been contaminated so greatly by nitrate that nitrate is the predominant anion in the water analysis. Calcium is a more common cation than sodium for all four anion types. Very few waters occur in which magnesium is the predominant cation. Calcium-bicarbonate is by far the most common of individual water types in the outcrop/subcrop area, followed by mixed cation-bicarbonate type. Some of the calcium-chloride type waters are caused by contamination either by saltwater from oil brine or saline water associated with animal or human waste, accompanied by cation exchange in the aquifer that hardened the groundwater.
Table 8--Distribution of chemical water types in the outcrop/subcrop and confined regions of the Dakota aquifer area that are not near the boundary of these two areas and in the area near the boundary (confined edge). The percent of total listed in the table is for the complete total of 849 sample records.
| Chemical type of water | Outcrop/Subcrop | Confined edge | Confined | Total |
|---|---|---|---|---|
| Bicarbonate types | ||||
| Ca-HCO3 | 145 | 64 | 25 | 234 |
| Ca-HCO3, other anions | 17 | 7 | 24 | |
| Mg-HCO3 | 2 | 1 | 3 | |
| Na-HCO3 | 17 | 37 | 68 | 122 |
| Na-HCO3, other anions | 6 | 9 | 17 | 32 |
| Mixed cation-HCO3 | 49 | 18 | 8 | 75 |
| Mixed cation-HCO3, other anions | 6 | 4 | 2 | 12 |
| Subtotal number (percent of total) | 242 (28.5) | 140 (16.5) | 120 (14.1) | 502 (59) |
| Sulfate types | ||||
| Ca-SO4 | 11 | 9 | 5 | 25 |
| Ca-SO4, other anions | 14 | 3 | 5 | 22 |
| Na-SO4 | 2 | 1 | 6 | 9 |
| Na-SO4, other anions | 1 | 3 | 7 | 11 |
| Mixed cation-SO4 | 8 | 2 | 2 | 12 |
| Mixed cation-SO4, other anions | 7 | 3 | 10 | |
| Subtotal number (percent of total) | 43 (5.1) | 21 (2.5) | 25 (2.9) | 89 (10) |
| Chloride types | ||||
| Ca-Cl | 10 | 1 | 1 | 12 |
| Ca-Cl, other anions | 7 | 2 | 9 | |
| Na-Cl | 7 | 96 | 96 | 199 |
| Na-Cl, other anions | 4 | 6 | 17 | 27 |
| Mixed cation-Cl | 3 | 1 | 4 | |
| Mixed cation-Cl, other anions | 2 | 1 | 3 | |
| Subtotal number (percent of total) | 33 (3.9) | 106 (12.5) | 115 (13.5) | 254 (30) |
| Nitrate types | ||||
| Ca-NO3 | 3 | 3 | ||
| Mixed cation-NO3 | 1 | 1 | ||
| Subtotal number (percent of total) | 4 (0.5) | 4 (0.5) | ||
| All water types (percent of total) | 322 (38) | 267 (31) | 260 (31) | 849 |
The numbers of wells with bicarbonate and chloride as the predominant anions are about equal in the confined aquifer (not near the boundary with the outcrop/subcrop area) and are substantially greater than the number of wells with sulfate type water (table 8). Sodium-chloride and then sodium-bicarbonate are the most common of individual water types. Thus, sodium is more common than calcium as the predominant cation in the confined Dakota aquifer. Sodium is also most commonly the predominant cation for sulfate type waters in the confined aquifer.
The chemical types of waters in the Dakota aquifer near the boundary of the outcrop/subcrop and confined areas are transitional between the waters in each of the two areas (table 8). However, the percentages of different chemical types are closer to those for the confined aquifer than for the outcrop/subcrop area. Although bicarbonate is the most common of the predominant anion types, the percentage of chloride types is substantially greater than in the outcrop/subcrop area away from the boundary with the confined aquifer. The total number of chloride water types near the boundary is only several percent less and the number of bicarbonate types only several percent more than those in the confined aquifer. Although calcium is the predominant cation for the bicarbonate type waters, sodium is the predominant cation for the chloride type waters. These distributions of water types partially reflect the flow of saline waters from the confined aquifer in central and north-central Kansas into the edge of the outcrop/subcrop areas in that region. The percentages of sulfate water types near the boundary and for the confined aquifer away from the boundary are a few percent less than for the outcrop/subcrop area away from the boundary. Nitrate is not the predominant anion in any of the waters in the confined aquifer or near the boundary with the outcrop/subcrop area.
A Piper-Hill trilinear diagram (Piper, 1944) allows visual discernment of groups of and trends in chemical water types for systems based on the major cation and anion composition of waters. Figure 37 displays the distribution of water types for Dakota groundwaters on a Piper-Hill trilinear diagram. The same data set was used for the diagram as for table 8. Potassium was combined with sodium if a potassium determination existed, and nitrate concentration was combined with chloride content if a nitrate measurement was available. The diagram illustrates the wide range in the chemical character of Dakota aquifer waters. Most of the points for groundwaters from the outcrop/subcrop area away from the boundary with the confined aquifer fall within the triangular area defined by greater than 50% calcium in the cation triangle and within the triangular area defined by greater than 50% bicarbonate in the anion triangle. Most of the points for waters from the confined aquifer away from the boundary with the outcrop/subcrop area fall within the triangular area defined by greater than 50% sodium in the cation triangle. In the anion triangle, the confined aquifer points have a wide distribution from the chloride apex toward the bicarbonate apex, with sulfate percentages less than 40% for most waters. Points for waters in the area near the boundary between the confined and outcrop/subcrop areas are distributed mainly across the lower portions of both the cation and anion triangles and indicate the prevalent transition between calcium and sodium and between bicarbonate and chloride type waters.
Figure 37--Piper trilinear diagram for groundwaters in the Dakota aquifer. See text for description of data included.
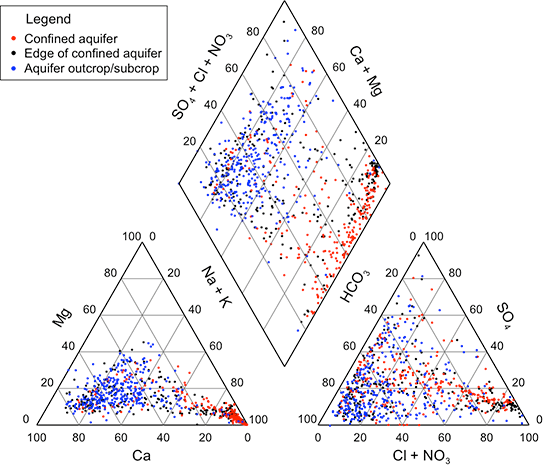
The diamond area of the Piper-Hill diagram summarizes the combined cation-anion nature of the groundwaters. Most of the points representing the outcrop/subcrop aquifer fall in the area with calcium and magnesium greater than 50% and bicarbonate greater than 50%. Most of the points for waters in the confined aquifer extend along the side of the diamond with high sodium percentage from a combined chloride and sulfate percentage near 100% to a bicarbonate percentage of about 30%. However, a substantial number of points for the confined aquifer also are distributed widely across most of the entire diamond. The points for the edge of the confined aquifer are also widely distributed across the cation-anion diamond.
Geochemical Profiles Across an Aquifer Flow Path
A cross section of the chemical characteristics in the Dakota aquifer from southeast Colorado to central Kansas illustrates the spatial variation in constituent concentrations and water types along a major regional path of groundwater flow in the aquifer. Inclusion of groundwater data for selected overlying and underlying aquifers illustrates the similarities and differences in water chemistry between the Dakota aquifer and these units. The following geochemical profiles are based on data collected during the Dakota Aquifer Program, including sampling by the KGS during cooperative investigations with the Texas Bureau of Economic Geology (TBEG) (Dutton, 1995) and Lawrence Livermore National Laboratory (LLNL) (Clark et al., 1998; Macfarlane et al., 2000).
The areal location of the cross section is illustrated in fig. 38. The location, geologic unit, elevation, construction information, and date of samples for the wells used in the cross section are given in tables 9 and 10. Chemical properties, major constituent concentrations, and water types based on results for the samples collected and analyzed by the KGS are listed in table 11. Minor constituent concentrations for samples collected and analyzed by the KGS and LLNL are in table 12. Trace metal data for samples collected and analyzed by the KGS and LLNL are in table 13. Uranium and radiochemical concentrations for the samples collected by the KGS and submitted to a USGS regional laboratory for analysis are in table 14. Stable isotope results for samples collected and analyzed by the TBEG and the LLNL and collected by the KGS and submitted to a USGS regional laboratory for analysis are in table 15. Additional radiochemical and isotopic data of the TBEG and LLNL are in Dutton (1995), Clark et al. (1998), and Macfarlane et al. (2000). The tables include data for the waters sampled from the HPA during the cooperative studies as well as for a sample collected from the Morrison Formation during a pumping test at a test-well site of the Dakota program.
Figure 38--Map location of wells illustrating regional changes in groundwater geochemistry along flow paths in the Dakota aquifer from southeast Colorado to central Kansas (modified from Clark et al., 1998). Numbers next to well location symbols indicate the samples listed in tables 9-15. Open circles indicate wells in the HPA, filled circles wells in the Dakota aquifer, and the open rectangle a well in the Morrison Formation. Blue lines represent the elevation (ft above sea level) of the predevelopment potentiometric surface. The green shaded area is the extent of the Dakota aquifer within the figure boundaries.
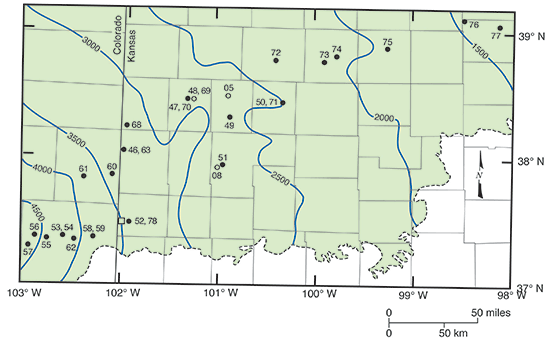
Table 9--Description and location of well sites and sample dates in the regional cross section of a Dakota aquifer flow path. Letters after section number in legal locations refer to quarters in order of large to small.
| Site sample number | Site description | Geologic unit | Type or use of well | Legal location | Sample date |
|---|---|---|---|---|---|
| Southeastern Colorado sites | |||||
| 57 | Commanche National Grasslands windmill | Dakota | Stock | 32S-49W-08BAAA | 5/20/92 |
| 56 | Town of Pritchett | Dakota, Cheyenne | Municipal | 30S-49W-36ADDA | 5/20/92 |
| 55 | Colorado State University Experiment Station | Dakota | Stock | 31S-48W-13ACCD | 5/20/92 |
| 54 | Town of Springfield, well 9 | Dakota | Municipal | 30S-46W-31AAAA | 5/20/92 |
| 53 | Town of Springfield, well 11 | HPA, Dakota, Cheyenne | Municipal | 31S-46W-04BCCB | 5/19/92 |
| 62 | Town of Vilas | Kiowa, Cheyenne, Morrison | Municipal | 31S-45W-02CABC | 5/22/92 |
| 58 | Town of Walsh, well 3 | Cheyenne | Municipal | 30S-43W-32DBCD | 5/21/92 |
| 59 | Town of Walsh, well 2 | Cheyenne | Municipal | 30S-43W-32CCDC | 5/21/92 |
| 61 | Irrigation well, Double J hog farm | Dakota | Irrigation | 25S-44W-16ACAC | 5/21/92 |
| 60 | Rangeland windmill in Prowers County | Dakota | Stock | 25S-42W-11BBBB | 5/21/92 |
| Kansas sites in general location of northern flow path | |||||
| 52 | Morrison observation well in Stanton County | Morrison | Monitoring | 29S-43W-21DCDD | 5/19/92 |
| 78 | Cheyenne pumping test well in Stanton County | Cheyenne | Monitoring | 29S-43W-21DCDD | 9/6/92 |
| 46 | Town of Coolidge, south well | Dakota | Municipal | 23S-43W-14CDCA | 11/5/91 |
| 63 | Town of Coolidge, north well | Dakota | Municipal | 23S-43W-14CDCA | 5/22/92 |
| 68 | Terry Boy residence | Dakota, Cheyenne | Domestic | 21S-41W-02BBBB | 7/14/92 |
| 47 | Town of Leoti, Dakota well | Dakota | Municipal | 18S-37W-24BACC | 11/6/91 |
| 70 | Town of Leoti, Dakota well | Dakota | Municipal | 18S-37W-24BACC | 7/14/92 |
| 49 | Poky Feeders feedlot | Dakota | Stock | 20S-32W-18DBDC | 11/7/91 |
| 72 | Carlos Roberts stock well | Dakota | Stock | 15S-28W-21BCCC | 7/15/92 |
| 50 | Ranger Feeders feedlot, well 4 | Dakota | Stock | 18S-28W-22DBDC | 11/8/91 |
| 71 | Ranger Feeders feedlot, well 5 | Dakota | Stock | 18S-28W-22DACD | 7/15/92 |
| 73 | William Montgomery residence | Dakota | Domestic | 15S-24W-15CCCB | 7/15/92 |
| 74 | Cedar Bluffs Christian Camp | Dakota | Camp supply | 14S-22W-33AACC | 7/16/92 |
| 75 | Randy Marintzer residence | Dakota | Domestic | 12S-18W-34CDDA | 7/16/92 |
| 76 | Jacob Klein residence | Dakota | Domestic | 11S-11W-13DCBB | 7/16/92 |
| 77 | Melvin Obermuller residence | Dakota | Domestic | 11S-08W-36AAAB | 7/17/92 |
| Kansas site between north and south flow path | |||||
| 51 | KPL Sunflower power plant, Dakota well | Dakota | Industrial | 24S-33W-20CCCA | 11/9/91 |
| Kansas sites, HPA wells | |||||
| 48 | Town of Leoti, HPA well | HPA | Municipal | 18S-37W-24BACC | 11/6/91 |
| 69 | Town of Leoti, HPA well | HPA | Municipal | 18S-37W-24BACC | 7/14/92 |
| KS05 | Town of Scott City, well 4 | HPA | Municipal | 18S-33W-24ACDD | 11/8/91 |
| KS08 | KPL Sunflower power plant, HPA well | HPA | Industrial | 24S-33W-31CAC | 11/9/91 |
Table 10--Well elevation and construction information for sample sites in the regional cross section of a Dakota aquifer flow path. Depths or elevations preceded by "e" are estimates. Longitude values are used for plotting of wells in cross-section figures.
| Site sample number |
Site name | Longitude | Land surface elevation, ft |
Total well depth, ft bls |
Bottom of well elevation, ft |
Screened interval, ft | Middle of screened interval, depth, ft bls |
Middle of screened interval, elevation, ft |
|---|---|---|---|---|---|---|---|---|
| Southeastern Colorado sites | ||||||||
| 57 | Grasslands | 102.95 | 4,951 | 261 | 4,690 | e230 | e4,721 | |
| 56 | Pritchett | 102.85 | 4,775 | e370 | e1,343 | e340 | e4,435 | |
| 55 | CSU Exp. Station | 102.77 | 4,666 | 270 | 4,396 | 200-270 | 235 | 4,431 |
| 54 | Springfield 9 | 102.62 | 4,348 | 134 | 4,214 | e120 | e4,228 | |
| 53 | Springfield 11 | 102.61 | 4,410 | 360 | 4,050 | 90-130, 290-360 | 247 | 4,163 |
| 62 | Vilas | 102.46 | 4,160 | 305 | 3,855 | 243.5-305 | 274 | 3,886 |
| 58 | Walsh 3 | 102.29 | 3,964 | 220 | 3,744 | e200 | e3,764 | |
| 59 | Walsh 2 | 102.28 | 3,956 | 155 | 3,801 | e140 | e3,816 | |
| 61 | Hog farm | 102.37 | 3,885 | 580 | 3,305 | e500 | e3,385 | |
| 60 | Prowers windmill | 102.16 | 3,621 | 537 | 3,084 | 236-537 | 387 | 3,234 |
| Kansas sites in general location of northern flow path | ||||||||
| 52 | Stanton Morrison | 102.02 | 3,568 | 422 | 3,146 | 395-415 | 405 | 3,163 |
| 78 | Stanton Cheyenne | 102.02 | 3,568 | 280 | 3,288 | 240-280 | 260 | 3,308 |
| 46 | Coolidge south | 102.01 | 3,375 | 360 | 3,015 | e270-340 | e305 | e3,070 |
| 63 | Coolidge north | 102.01 | 3,383 | 360 | 3,023 | 270-340 | 305 | 3,078 |
| 68 | Terry Boy | 101.95 | 3,624 | 1,025 | 2,599 | 900-1,000 | 950 | 2,674 |
| 47 | Leoti Dakota | 101.36 | 3,303 | 1,050 | 2,253 | 820-860, 930-970, 1,010-1,050 | 940 | 2,363 |
| 70 | Leoti Dakota | 101.36 | 3,303 | 1,050 | 2,253 | 820-860, 930-970, 1,010-1,050 | 940 | 2,363 |
| 49 | Poky Feeders | 100.89 | 2,920 | 1,000 | 1,920 | e950 | e1,970 | |
| 72 | Roberts | 100.44 | 2,502 | 700 | 1,802 | 600-620, 640-700 | 655 | 1,847 |
| 50 | Ranger Feeders 4 | 100.40 | 2,678 | 942 | 1,736 | e860 | e1,818 | |
| 71 | Ranger Feeders 5 | 100.40 | 2,678 | 925 | 1,753 | 775-925 | 850 | 1,828 |
| 73 | Montgomery | 99.96 | 2,375 | 617 | 1,758 | 365-375, 395-415, 520-560, 580-617 | 521 | 1,854 |
| 74 | Christian Camp | 99.76 | 2,185 | 470 | 1,715 | 450-470 | 460 | 1,725 |
| 75 | Marintzer | 99.31 | 2,110 | 505 | 1,605 | 485-505 | 495 | 1,615 |
| 76 | Klein | 98.49 | 1,660 | 232 | 1,428 | 192-232 | 112 | 1,548 |
| 77 | Obermuller | 98.15 | 1,440 | 80 | 1,360 | 60-80 | 70 | 1,370 |
| Kansas site between north and south flow path | ||||||||
| 51 | KPL Dakota | 100.97 | 2,950 | 699 | 2,251 | 479-699 | 589 | 2,361 |
| Kansas sites, HPA wells | ||||||||
| 48 | Leoti HPA | 101.36 | 3,303 | 170 | 3,133 | 132-142, 153-158 | 143 | 3,160 |
| 69 | Leoti HPA | 101.36 | 3,303 | 170 | 3,133 | 132-142, 153-158 | 143 | 3,160 |
| KS05 | Scott City 4 | 100.91 | 2,964 | 214 | 2,750 | e204 | e2,760 | |
| KS08 | KPL HPA | 100.99 | 2,916 | 437 | 2,479 | 257-457 | 357 | 2,559 |
Table 11--Chemical properties, dissolved major constituent concentrations, and water types for samples in the regional cross section of a Dakota aquifer flow path. Data are for KGS analyses except for the last two samples, which are from Dutton (1995).
| Site sample | Site name | Sp.C., field, µS/cm |
pH | TDS mg/L |
SiO2 mg/L |
Ca mg/L |
Mg mg/L |
Na mg/L |
K mg/L |
HCO3 mg/L |
SO4 mg/L |
Cl mg/L |
Water type |
|---|---|---|---|---|---|---|---|---|---|---|---|---|---|
| Southeastern Colorado sites | |||||||||||||
| 57 | Grasslands | 388 | 7.45 | 235 | 21.8 | 57.2 | 10.3 | 6.9 | 2.6 | 198 | 17.0 | 7.7 | Ca-HCO3 |
| 56 | Pritchett | 330 | 7.05 | 193 | 11.6 | 35.0 | 12.6 | 14.7 | 3.0 | 167 | 29.0 | 2.6 | Ca-HCO3 |
| 55 | CSU Exp. Station | 916 | 7.45 | 577 | 8.5 | 48.4 | 30.5 | 104.0 | 10.3 | 269 | 217 | 23.6 | Na,Mg,Ca-SO4,HCO3 |
| 54 | Springfield 9 | 759 | 7.30 | 502 | 16.0 | 84.4 | 17.9 | 45.8 | 3.7 | 170 | 214 | 20.4 | Ca-SO4 |
| 53 | Springfield 11 | 594 | 7.65 | 377 | 19.3 | 80.5 | 16.1 | 13.9 | 3.3 | 136 | 136 | 25.0 | Ca-SO4,HCO3 |
| 62 | Vilas | 484 | 7.60 | 290 | 10.9 | 37.3 | 18.4 | 41.1 | 4.3 | 234 | 55.3 | 5.4 | Ca,Na,Mg-HCO3 |
| 58 | Walsh 3 | 1,230 | 7.60 | 824 | 16.2 | 88.3 | 56.3 | 105.0 | 3.3 | 247 | 358 | 49.1 | Mg,Na,Ca-SO4 |
| 59 | Walsh 2 | 824 | 7.60 | 536 | 17.8 | 62.7 | 36.3 | 66.7 | 3.7 | 240 | 198 | 22.2 | Ca,Mg,Na-SO4,HCO3 |
| 61 | Hog farm | 620 | 7.10 | 377 | 13.6 | 62.5 | 21.7 | 33.6 | 3.8 | 224 | 121 | 9.2 | Ca-HCO3 |
| 60 | Prowers windmill | 522 | 7.40 | 329 | 15.3 | 58.8 | 16.7 | 23.8 | 4.0 | 184 | 100 | 7.5 | Ca-HCO3 |
| Kansas sites in general location of northern flow path | |||||||||||||
| 52 | Stanton Morrison | 786 | 8.15 | 501 | 15.0 | 43.8 | 26.8 | 83.1 | 8.7 | 236 | 184 | 20.3 | Na,Mg,Ca-HCO3,SO4 |
| 78 | Stanton Cheyenne | 840 | 7.55 | 515 | 11.1 | 47.7 | 32.5 | 76.3 | 6.6 | 234 | 207 | 15.9 | Na,Mg,Ca-SO4,HCO3 |
| 46 | Coolidge south | 673 | 7.01 | 422 | 10.0 | 62.8 | 21.3 | 44.7 | 5.7 | 196 | 167 | 11.7 | Ca,Na,Mg-SO4,HCO3 |
| 63 | Coolidge north | 670 | 7.25 | 422 | 10.4 | 64.3 | 21.6 | 45.7 | 6.3 | 197 | 163 | 11.9 | Ca,Na,Mg-SO4,HCO3 |
| 68 | Terry Boy | 753 | 8.40 | 466 | 11.4 | 2.9 | 1.5 | 172.0 | 3.5 | 280 | 118 | 16.6 | Na-HCO3 |
| 47 | Leoti Dakota | 1,650 | 8.45 | 1,033 | 10.2 | 5.5 | 2.0 | 369 | 4.6 | 345 | 407 | 61.6 | Na-SO4 |
| 70 | Leoti Dakota | 1,675 | 8.50 | 1,049 | 11.6 | 5.4 | 2.5 | 367 | 4.8 | 345 | 421 | 63.6 | Na-SO4 |
| 49 | Poky Feeders | 1,503 | 7.32 | 985 | 61.9 | 84.8 | 60.6 | 149.0 | 8.5 | 371 | 289 | 124.0 | Na,Mg,Ca-HCO3,SO4 |
| 72 | Roberts | 1,590 | 8.20 | 937 | 11.0 | 3.9 | 2.0 | 344 | 4.3 | 384 | 211 | 168.0 | Na-HCO3,Cl,SO4 |
| 50 | Ranger Feeders 4 | 1,870 | 7.86 | 1,025 | 11.7 | 6.3 | 2.7 | 376 | 6.7 | 268 | 113 | 374 | Na-Cl |
| 71 | Ranger Feeders 5 | 1,800 | 7.65 | 996 | 14.2 | 18.2 | 8.2 | 351 | 7.0 | 340 | 126 | 300 | Na-Cl |
| 73 | Montgomery | 1,950 | 7.85 | 1,053 | 10.8 | 7.2 | 3.4 | 382 | 4.0 | 356 | 188 | 278 | Na-Cl,HCO3 |
| 74 | Christian Camp | 2,280 | 8.25 | 1,288 | 10.3 | 5.3 | 3.0 | 480 | 5.8 | 442 | 196 | 365 | Na-Cl,HCO3 |
| 75 | Marintzer | 5,640 | 7.90 | 3,233 | 11.5 | 15.5 | 20.5 | 1,160 | 11.1 | 387 | 457 | 1,363 | Na-Cl |
| 76 | Klein | 1,450 | 8.05 | 892 | 8.8 | 21.0 | 4.3 | 324 | 3.4 | 547 | 159 | 100.0 | Na-HCO3 |
| 77 | Obermuller | 1,150 | 7.05 | 753 | 22.6 | 173.0 | 12.3 | 62.3 | 5.9 | 379 | 128 | 58.5 | Ca-HCO3 |
| Kansas site between north and south flow path | |||||||||||||
| 51 | KPL Dakota | 458 | 7.45 | 279 | 13.8 | 40.6 | 12.0 | 37.4 | 3.5 | 183 | 74.0 | 5.6 | Na,Ca-HCO3 |
| Kansas sites, HPA wells | |||||||||||||
| 48 | Leoti HPA | 550 | 7.52 | 353 | 53.0 | 53.5 | 22.7 | 19.8 | 4.5 | 195 | 46.0 | 38.7 | Ca-HCO3 |
| 69 | Leoti HPA | 550 | 7.65 | 348 | 54.6 | 53.1 | 22.6 | 19.2 | 4.6 | 216 | 40.1 | 30.8 | Ca-HCO3 |
| KS05 | Scott City 4 | 7.85 | 371 | 58.2 | 51.0 | 22.6 | 30.0 | 6.3 | 209 | 54.1 | 27.9 | Ca,Mg-HCO3 | |
| KS08 | KPL HPA | 7.78 | 254 | 20.0 | 50.0 | 9.8 | 21.2 | 3.0 | 175 | 48.9 | 6.5 | Ca-HCO3 | |
Table 12--Dissolved minor constituent concentrations for samples in the regional cross section of a Dakota aquifer flow path. KGS and LLNL refer to the laboratory in which the samples were analyzed. Data are for KGS analyses except where noted for LLNL analyses and for the last two samples, which are from Dutton (1995).
| Site sample | Site name | F mg/L |
NO3-N mg/L |
NH4-N mg/L |
PO4-P mg/L |
KGS Sr mg/L |
LLNL Sr mg/L |
LLNL Rb mg/L |
KGS Ba mg/L |
LLNL Ba mg/L |
B mg/L |
Br mg/L |
I mg/L |
|---|---|---|---|---|---|---|---|---|---|---|---|---|---|
| Southeastern Colorado sites | |||||||||||||
| 57 | Grasslands | 0.75 | 2.96 | < 0.08 | 0.003 | 0.62 | 0.58 | 0.0012 | 0.180 | 0.231 | 0.048 | 0.079 | 0.015 |
| 56 | Pritchett | 1.28 | < 0.02 | < 0.08 | 0.007 | 0.69 | 0.64 | 0.0047 | 0.019 | 0.024 | 0.119 | 0.043 | 0.022 |
| 55 | CSU Exp. Station | 1.56 | < 0.02 | 0.23 | 0.007 | 1.12 | 1.04 | 0.0188 | 0.014 | 0.018 | 0.317 | 0.40 | 0.051 |
| 54 | Springfield 9 | 0.69 | 3.25 | < 0.08 | 0.007 | 0.91 | 0.86 | 0.0039 | 0.037 | 0.049 | 0.162 | 0.199 | 0.020 |
| 53 | Springfield 11 | 0.42 | 3.25 | < 0.08 | 0.003 | 1.06 | 1.01 | 0.0018 | 0.042 | 0.056 | 0.064 | 0.32 | 0.017 |
| 62 | Vilas | 1.64 | < 0.02 | < 0.08 | < 0.003 | 0.79 | 0.71 | 0.0059 | 0.042 | 0.200 | 0.070 | 0.012 | |
| 58 | Walsh 3 | 1.53 | 4.99 | < 0.08 | 0.003 | 2.38 | 2.18 | 0.0047 | 0.053 | 0.070 | 0.446 | 0.39 | 0.088 |
| 59 | Walsh 2 | 1.72 | 1.58 | < 0.08 | 0.007 | 1.77 | 1.58 | 0.0040 | 0.038 | 0.052 | 0.335 | 0.137 | 0.049 |
| 61 | Hog farm | 0.77 | < 0.02 | < 0.08 | < 0.003 | 0.96 | 0.90 | 0.0033 | 0.024 | 0.031 | 0.108 | 0.154 | 0.017 |
| 60 | Prowers windmill | 0.61 | 2.48 | < 0.08 | 0.003 | 1.02 | 0.96 | 0.0029 | 0.019 | 0.026 | 0.103 | 0.085 | 0.014 |
| Kansas sites in general location of northern flow path | |||||||||||||
| 52 | Stanton Morrison | 1.36 | 0.20 | 0.08 | 0.010 | 1.08 | 1.03 | 0.0092 | 0.031 | 0.038 | 1.42 | 0.191 | 0.031 |
| 78 | Stanton Cheyenne | 1.89 | < 0.02 | < 0.08 | < 0.010 | 1.29 | 0.018 | 0.301 | 0.20 | 0.034 | |||
| 46 | Coolidge south | 0.81 | < 0.02 | < 0.08 | < 0.010 | 1.35 | 0.018 | 0.094 | 0.165 | 0.024 | |||
| 63 | Coolidge north | 0.84 | < 0.02 | < 0.08 | < 0.003 | 1.39 | 1.32 | 0.0061 | 0.025 | 0.167 | 0.158 | 0.022 | |
| 68 | Terry Boy | 2.11 | < 0.02 | 0.47 | 0.013 | 0.06 | 0.06 | 0.0037 | 0.012 | 0.017 | 0.296 | 0.131 | 0.030 |
| 47 | Leoti Dakota | 3.37 | < 0.02 | 1.01 | 0.060 | 0.14 | 0.014 | 0.900 | 0.50 | 0.086 | |||
| 70 | Leoti Dakota | 3.10 | < 0.02 | 1.09 | 0.029 | 0.14 | 0.13 | 0.0051 | 0.015 | 0.020 | 0.751 | 0.46 | 0.087 |
| 49 | Poky Feeders | 2.64 | 4.29 | < 0.08 | 0.010 | 3.27 | 0.022 | 0.500 | 0.59 | 0.107 | |||
| 72 | Roberts | 3.99 | < 0.02 | 0.70 | 0.029 | 0.08 | 0.07 | 0.0032 | 0.018 | 0.025 | 0.630 | 0.36 | 0.066 |
| 50 | Ranger Feeders 4 | 2.85 | < 0.02 | 0.47 | 0.040 | 0.09 | 0.007 | 0.410 | 0.21 | 0.040 | |||
| 71 | Ranger Feeders 5 | 3.47 | < 0.02 | 0.54 | 0.020 | 0.29 | 0.27 | 0.0066 | 0.022 | 0.029 | 0.469 | 0.30 | 0.083 |
| 73 | Montgomery | 4.08 | < 0.02 | 1.01 | 0.023 | 0.17 | 0.23 | 0.0049 | 0.015 | 0.024 | 0.654 | 0.30 | 0.055 |
| 74 | Christian Camp | 5.16 | < 0.02 | 1.17 | 0.026 | 0.10 | 0.10 | 0.0046 | 0.019 | 0.027 | 0.938 | 0.33 | 0.061 |
| 75 | Marintzer | 3.35 | < 0.02 | 1.79 | 0.033 | 0.46 | 0.46 | 0.0083 | 0.021 | 0.030 | 0.830 | 0.55 | 0.065 |
| 76 | Klein | 2.16 | < 0.02 | 0.31 | 0.039 | 0.33 | 0.30 | 0.0024 | 0.007 | 0.009 | 0.740 | 0.100 | 0.0090 |
| 77 | Obermuller | 0.29 | 23.3 | < 0.08 | 0.062 | 0.63 | 0.58 | 0.0021 | 0.337 | 0.407 | 0.082 | 0.137 | 0.0036 |
| Kansas site between north and south flow path | |||||||||||||
| 51 | KPL Dakota | 1.09 | 0.11 | < 0.08 | < 0.010 | 0.63 | 0.035 | 0.106 | 0.061 | 0.020 | |||
| Kansas sites, HPA wells | |||||||||||||
| 48 | Leoti HPA | 1.47 | 3.70 | < 0.08 | 0.010 | 1.21 | 0.110 | 0.100 | 0.26 | 0.049 | |||
| 69 | Leoti HPA | 1.47 | 3.12 | < 0.08 | 0.010 | 1.21 | 1.14 | 0.0020 | 0.115 | 0.145 | 0.086 | 0.183 | 0.034 |
| KS05 | Scott City 4 | 2.10 | 3.34 | 1.03 | 0.080 | 0.150 | |||||||
| KS08 | KPL HPA | 0.56 | 1.72 | 0.62 | 0.050 | < 0.04 | |||||||
Table 13--Dissolved trace metal and semimetal concentrations for samples in the regional cross section of a Dakota aquifer flow path. KGS and LLNL refer to the laboratory in which the samples were analyzed.
| Sample site | Site name | KGS Fe µg/L |
KGS Mn µg/L |
LLNL Mn µg/L |
KGS Al µg/L |
LLNL Cr µg/L |
KGS Ni µg/L |
LLNL Ni µg/L |
KGS Cu µg/L |
LLNL Cu µg/L |
KGS Zn µg/L |
LLNL Zn µg/L |
KGS Cd µg/L |
LLNL Cd µg/L |
|---|---|---|---|---|---|---|---|---|---|---|---|---|---|---|
| Southeastern Colorado sites | ||||||||||||||
| 57 | Grasslands | 57 | 2 | 2.1 | 19 | 0.04 | < 0.1 | 0.2 | 7.5 | 4.3 | 130 | 197 | 0.36 | |
| 56 | Pritchett | 824 | 17 | 18 | 18 | 0.1 | < 0.1 | 28 | 9 | < 0.1 | ||||
| 55 | CSU Exp. Station | 768 | 43 | 44 | 26 | 0.02 | 0.9 | 0.4 | < 0.1 | 2.8 | 793 | 0.05 | ||
| 54 | Springfield 9 | 29 | < 2 | 1.0 | 33 | 0.3 | 0.1 | 4 | < 0.1 | |||||
| 53 | Springfield 11 | < 10 | < 2 | 0.1 | 43 | 1.0 | 0.4 | 36 | 58 | < 0.1 | ||||
| 62 | Vilas | 34 | 0.04 | 0.9 | 1.4 | 19 | 0.03 | |||||||
| 58 | Walsh 3 | < 10 | < 2 | < 0.2 | 32 | 0.11 | 0.2 | 0.3 | < 0.1 | 5.2 | < 2 | 20 | 0.01 | |
| 59 | Walsh 2 | < 10 | < 2 | 0.2 | 16 | 0.29 | 0.3 | 0.9 | 0.4 | 1.1 | < 2 | 12 | 0.03 | |
| 61 | Hog farm | 1,660 | 81 | 85 | 10 | 0.05 | 0.7 | 0.3 | 0.4 | 2.5 | 100 | 291 | 0.03 | |
| 60 | Prowers windmill | 15 | 6 | 6.2 | 6 | 0.05 | 0.2 | 0.2 | < 0.1 | 0.5 | < 2 | 8 | 0.02 | |
| Kansas sites in general location of northern flow path | ||||||||||||||
| 52 | Stanton Morrison | < 10 | 19 | 17 | 45 | 0.04 | 9.1 | 2.4 | 1.1 | 2.5 | 25 | 70 | 0.04 | |
| 78 | Stanton Cheyenne | 44 | 54 | 35 | 2.4 | 0.5 | 64 | |||||||
| 46 | Coolidge south | 797 | 70 | 3 | 0.5 | 31 | < 0.1 | |||||||
| 63 | Coolidge north | 71 | 0.04 | 0.7 | 1.2 | 40 | 0.04 | |||||||
| 68 | Terry Boy | 108 | 7 | 7.4 | 45 | 0.07 | 2.0 | 0.3 | 0.2 | 0.3 | 2 | 19 | < 0.1 | |
| 47 | Leoti Dakota | < 20 | 15 | 3 | 0.5 | < 4 | 0.1 | |||||||
| 70 | Leoti Dakota | 105 | 12 | 13 | 2 | 0.01 | 1.1 | 0.3 | 0.5 | 5.2 | < 2 | 20 | 0.01 | |
| 49 | Poky Feeders | < 20 | 44 | 6 | 0.9 | 115 | 0.1 | |||||||
| 72 | Roberts | 37 | 4 | 5.4 | 1 | < 0.01 | 0.2 | 0.3 | 0.6 | 2.5 | 2 | 14 | 0.07 | |
| 50 | Ranger Feeders 4 | 330 | 4 | 7 | 0.3 | < 4 | < 0.1 | |||||||
| 71 | Ranger Feeders 5 | 675 | 36 | 37 | 4 | < 0.01 | 1.8 | 0.9 | 0.8 | 2.9 | 7 | 29 | < 0.01 | |
| 73 | Montgomery | 48 | 3 | 4.2 | 3 | < 0.01 | 0.2 | 0.2 | 0.2 | 1.0 | 112 | 0.08 | ||
| 74 | Christian Camp | 28 | 4 | 4.6 | 2 | < 0.01 | 0.2 | 0.4 | 0.1 | 1.1 | < 2 | 12 | 0.06 | |
| 75 | Marintzer | 166 | 12 | 14 | 3 | 0.01 | 1.1 | 0.3 | 3.9 | 2.5 | 12 | 24 | 0.06 | |
| 76 | Klein | < 10 | 10 | 11 | 1 | 0.04 | 1.6 | 1.6 | 2.2 | 4.0 | 22 | 39 | 0.05 | |
| 77 | Obermuller | 12 | < 2 | 0.3 | 10 | 0.09 | 0.1 | 0.9 | 6.7 | 3.8 | 46 | 60 | 0.03 | |
| Kansas site between north and south flow path | ||||||||||||||
| 51 | KPL Dakota | 123 | 43 | 8 | 0.3 | 7 | 0.1 | |||||||
| Kansas sites, HPA wells | ||||||||||||||
| 48 | Leoti HPA | < 20 | < 4 | 6 | 0.8 | 11 | < 0.1 | |||||||
| 69 | Leoti HPA | < 10 | < 2 | < 0.2 | 5 | 0.05 | 0.7 | 0.4 | 0.7 | 0.8 | 6 | 37 | 0.04 | |
Table 13--Dissolved trace metal and semimetal concentrations for samples in the regional cross section of a Dakota aquifer flow path (continued). KGS and LLNL refer to the laboratory in which the samples were analyzed.
| Sample site |
Site name | KGS Be µg/L |
KGS As µg/L |
LLNL As µg/L |
KGS Se µg/L |
LLNL Se µg/L |
KGS Sb µg/L |
KGS Ag µg/L |
LLNL Hg µg/L |
KGS Tl µg/L |
LLNL Pb µg/L |
|---|---|---|---|---|---|---|---|---|---|---|---|
| Southeastern Colorado sites | |||||||||||
| 57 | Grasslands | 0.22 | 0.3 | 0.2 | 5.8 | < 0.1 | 1.2 | < 0.1 | < 0.01 | < 1 | 0.13 |
| 56 | Pritchett | 0.25 | < 0.1 | < 0.1 | 4.3 | < 0.1 | 1.9 | < 0.1 | < 1 | ||
| 55 | CSU Exp. Station | 0.20 | < 0.1 | 0.4 | 5.3 | < 0.1 | 0.6 | < 0.1 | 0.16 | < 1 | 1.2 |
| 54 | Springfield 9 | 0.08 | < 0.1 | 0.3 | 4.9 | 0.1 | 1.7 | < 0.1 | < 1 | ||
| 53 | Springfield 11 | 0.08 | 0.1 | 0.9 | 2.2 | 0.5 | 3.7 | < 0.1 | < 1 | ||
| 62 | Vilas | 0.7 | < 0.1 | 0.07 | 0.12 | ||||||
| 58 | Walsh 3 | 0.19 | < 0.1 | 0.8 | 7.4 | 0.9 | 2.8 | < 0.1 | < 0.01 | 3 | 0.02 |
| 59 | Walsh 2 | 0.18 | 1.2 | 0.9 | 9.3 | 0.3 | 1.5 | 0.2 | < 0.01 | 1 | 0.37 |
| 61 | Hog farm | 0.16 | 1.2 | 0.2 | 9.4 | < 0.1 | 3.3 | 0.2 | < 0.01 | < 1 | 0.16 |
| 60 | Prowers windmill | 0.19 | 1.1 | 0.1 | 9.2 | < 0.1 | 2.3 | < 0.1 | 0.11 | 1 | 0.29 |
| Kansas sites in general location of northern flow path | |||||||||||
| 52 | Stanton Morrison | 0.31 | 3.0 | 3.6 | 5.6 | 0.5 | 5.4 | < 0.1 | < 0.01 | 5 | 0.25 |
| 78 | Stanton Cheyenne | 4.8 | 0.4 | 0.5 | |||||||
| 46 | Coolidge south | 0.8 | 1.7 | < 0.1 | |||||||
| 63 | Coolidge north | 0.2 | < 0.1 | < 0.01 | < 0.01 | ||||||
| 68 | Terry Boy | 0.01 | 0.5 | 1.2 | < 0.1 | 0.3 | 1.3 | 0.4 | 0.02 | < 1 | 0.51 |
| 47 | Leoti Dakota | 1.2 | 0.8 | < 0.1 | |||||||
| 70 | Leoti Dakota | 0.14 | 1.1 | 0.8 | 1.1 | 0.1 | 7.5 | 0.2 | < 0.01 | < 1 | 0.04 |
| 49 | Poky Feeders | 5.4 | 12 | < 0.1 | |||||||
| 72 | Roberts | 0.10 | 0.9 | 1.1 | < 0.1 | 0.4 | 6.4 | < 0.1 | 0.05 | < 1 | 0.66 |
| 50 | Ranger Feeders 4 | 1.2 | 0.3 | 0.2 | |||||||
| 71 | Ranger Feeders 5 | 0.23 | 1.1 | 3.2 | < 0.1 | 1.3 | 4.3 | < 0.1 | < 0.01 | 1 | 2.0 |
| 73 | Montgomery | 0.10 | 1.1 | 3.4 | 0.1 | 1.6 | 3.2 | < 0.1 | 0.04 | < 1 | 0.68 |
| 74 | Christian Camp | 0.11 | 1.3 | 2.5 | < 0.1 | 1.2 | 3.5 | < 0.1 | 0.19 | 2 | 1.0 |
| 75 | Marintzer | < 0.01 | < 0.1 | 13.2 | 0.3 | 7.5 | 5.5 | < 0.1 | 0.16 | 2 | 1.9 |
| 76 | Klein | 0.10 | 0.1 | 1.3 | < 0.1 | 0.3 | 3.9 | < 0.1 | < 0.01 | < 1 | 1.1 |
| 77 | Obermuller | < 0.01 | 0.5 | 0.8 | 1.3 | 0.2 | 4.3 | < 0.1 | 0.06 | < 1 | 0.34 |
| Kansas site between north and south flow path | |||||||||||
| 51 | KPL Dakota | < 0.1 | 1.3 | < 0.1 | |||||||
| Kansas sites, HPA wells | |||||||||||
| 48 | Leoti HPA | 3.6 | 3.7 | < 0.1 | |||||||
| 69 | Leoti HPA | 0.08 | 8.6 | 4.6 | 1.1 | 0.5 | 3.3 | 0.2 | < 0.01 | < 1 | 0.19 |
Table 14--Tritium, uranium, and other radiochemical concentrations for samples in the regional cross section of a Dakota aquifer flow path. LLNL, USGS, and BEG (Dutton, 1995) refer to the laboratory in which the samples were analyzed. Uranium values are from LLNL except for samples 49, 50, and 78, which are from the USGS. All other values were determined by the USGS.
| Site sample | Site name | LLNL Tritium TU |
USGS Tritium TU |
BEG Tritium TU |
U µg/L |
Gross alpha, µg/L as U-natural |
Gross alpha minus U pCi/L |
Gross beta, pCi/L as Sr/Yt-90 |
Ra-226 pCi/L |
Ra-228 pCi/L |
|---|---|---|---|---|---|---|---|---|---|---|
| Southeastern Colorado sites | ||||||||||
| 57 | Grasslands | 0.9 | 6.53 | 11.0 | 3.1 | 5.9 | 0.08 | < 1.0 | ||
| 56 | Pritchett | 0.1 | 13.0 | < 9.1 | 6.1 | 2.20 | 4.1 | |||
| 55 | CSU Exp. Station | 0.7 | 0.06 | 12.0 | 8.4 | 15.0 | 1.80 | 2.5 | ||
| 54 | Springfield 9 | 5.8 | 14.0 | < 9.8 | 9.8 | 0.12 | < 1.0 | |||
| 53 | Springfield 11 | 5.0 | 14.0 | < 9.8 | 13.0 | 0.34 | 1.2 | |||
| 62 | Vilas | 12.8 | 1.95 | |||||||
| 58 | Walsh 3 | 1.1 | 23.2 | 43.0 | 13.9 | 21.0 | 1.80 | 3.2 | ||
| 59 | Walsh 2 | 4.0 | 15.5 | 23.0 | 5.3 | 14.0 | 0.56 | 2.0 | ||
| 61 | Hog farm | 0.1 | 0.59 | 84.0 | 58.4 | 24.0 | 31.00 | 2.4 | ||
| 60 | Prowers windmill | 0.4 | 4.14 | 10.0 | 4.1 | 7.7 | 1.40 | < 1.0 | ||
| Kansas sites in general location of northern flow path | ||||||||||
| 52 | Stanton Morrison | 2.0 | 6.58 | 6.9 | 0.2 | 6.9 | 0.03 | < 1.0 | ||
| 78 | Stanton Cheyenne | 0 | 0.53 | 5.1 | 3.2 | 8.2 | 0.45 | < 1.0 | ||
| 46 | Coolidge south | 0.0 | ||||||||
| 63 | Coolidge north | 0.0 | 1.33 | |||||||
| 68 | Terry Boy | 1.4 | < 0.01 | 3.0 | 2.1 | 4.3 | 0.37 | < 1.0 | ||
| 47 | Leoti Dakota | 0.0 | ||||||||
| 70 | Leoti Dakota | 0.6 | 0.03 | < 0.6 | < 0.4 | 4.6 | 0.37 | < 1.0 | ||
| 49 | Poky Feeders | 4.6 | 5.6 | 36.1 | 47.2 | 7.8 | 29.9 | 1.19 | ||
| 72 | Roberts | 0.9 | 0.02 | 4.4 | 3.1 | 11.0 | 0.45 | < 1.0 | ||
| 50 | Ranger Feeders 4 | 0.2 | 0.0 | 0.01 | 2.0 | 1.4 | 7.5 | 0.28 | ||
| 71 | Ranger Feeders 5 | 1.1 | 0.25 | 1.6 | 0.9 | 8.2 | 0.56 | < 1.0 | ||
| 73 | Montgomery | 0.0 | 0.04 | 2.0 | 1.4 | 6.8 | 0.63 | < 1.0 | ||
| 74 | Christian Camp | 0.9 | 0.03 | 9.9 | 6.9 | 7.2 | 0.51 | < 1.0 | ||
| 75 | Marintzer | 0.3 | 0.03 | 3.9 | 2.7 | 9.6 | 1.60 | 1.8 | ||
| 76 | Klein | 5.7 | 0.68 | 3.9 | 2.3 | 4.6 | 0.28 | < 1.0 | ||
| 77 | Obermuller | 3.7 | 10.9 | 39.0 | 19.7 | 23.0 | 4.60 | 6.2 | ||
| Kansas site between north and south flow path | ||||||||||
| 51 | KPL Dakota | 0.1 | 0.0 | |||||||
| Kansas sites, HPA wells | ||||||||||
| 48 | Leoti HPA | 6.4 | ||||||||
| 69 | Leoti HPA | 4.1 | 12.4 | 14.0 | 1.1 | 9.1 | 0.20 | < 1.0 | ||
| KS05 | Scott City 4 | 0.9 | ||||||||
| KS08 | KPL HPA | 0.0 | ||||||||
Table 15--Stable isotope concentrations for samples in the regional cross section of a Dakota aquifer flow path. LLNL, USGS, and BEG (Dutton, 1995) refer to the laboratory in which the samples were analyzed. The data listed in the "plot" columns were selected as "best" values for use in figures.
| Site sample |
Site name | δ 0-18‰ LLNL |
δ 0-18‰ USGS |
δ 0-18‰ BEG |
δ 0-18‰ plot |
δ D‰ LLNL |
δ D‰ USGS |
δ D‰ BEG |
δ D‰ plot |
|---|---|---|---|---|---|---|---|---|---|
| Southeastern Colorado sites | |||||||||
| 57 | Grasslands | -9.84 | -9.85 | -9.84 | -66.5 | -66.0 | -66.3 | ||
| 56 | Pritchett | -11.49 | -11.55 | -11.52 | -80.0 | -81.5 | -80.7 | ||
| 55 | CSU Exp. Station | -14.12 | -14.20 | -14.16 | -103.5 | -106.0 | -104.7 | ||
| 54 | Springfield 9 | -10.67 | -10.70 | -10.68 | -75.0 | -74.5 | -74.8 | ||
| 53 | Springfield 11 | -11.43 | -11.05 | -11.24 | -85.0 | -79.5 | -83.3 | ||
| 62 | Vilas | -12.20 | -12.20 | -88.0 | -88.0 | ||||
| 58 | Walsh 3 | -9.43 | -9.35 | -9.39 | -68.0 | -65.0 | -66.5 | ||
| 59 | Walsh 2 | -9.70 | -9.60 | -9.65 | -66.0 | -66.5 | -66.2 | ||
| 61 | Hog farm | -10.04 | -10.05 | -10.04 | -69.0 | -69.0 | -69.0 | ||
| 60 | Prowers windmill | -9.17 | -9.20 | -9.18 | -60.0 | -63.0 | -61.5 | ||
| Kansas sites in general location of northern flow path | |||||||||
| 52 | Stanton Morrison | -10.94 | -12.00 | -11.47 | -79.0 | -85.5 | -82.2 | ||
| 78 | Stanton Cheyenne | -11.27 | -11.27 | -81.0 | -81.0 | ||||
| 46 | Coolidge south | -12.80 | -12.80 | -88.0 | -88.0 | ||||
| 63 | Coolidge north | -13.02 | -13.02 | -93.0 | -93.0 | ||||
| 68 | Terry Boy | -13.24 | -13.30 | -13.27 | -99.0 | -97.5 | -98.3 | ||
| 47 | Leoti Dakota | -12.05 | -12.05 | -88.5 | -88.5 | ||||
| 70 | Leoti Dakota | -12.07 | -12.10 | -12.08 | -90.0 | -88.5 | -89.3 | ||
| 49 | Poky Feeders | -8.50 | -7.93 | -59.0 | -52.0 | ||||
| 72 | Roberts | -11.75 | -11.80 | -11.77 | -97.0 | -85.5 | -86.3 | ||
| 50 | Ranger Feeders 4 | -12.95 | -12.95 | -93.0 | -93.0 | ||||
| 71 | Ranger Feeders 5 | -12.52 | -12.60 | -12.56 | -95.0 | -92.5 | -93.8 | ||
| 73 | Montgomery | -11.95 | -11.90 | -11.92 | -88.0 | -87.5 | -87.8 | ||
| 74 | Christian Camp | -11.85 | -12.00 | -11.92 | -87.0 | -86.5 | -86.8 | ||
| 75 | Marintzer | -11.71 | -11.85 | -11.78 | -88.0 | -86.5 | -87.3 | ||
| 76 | Klein | -9.27 | -9.35 | -9.31 | -64.0 | -61.5 | -62.8 | ||
| 77 | Obermuller | -8.52 | -8.55 | -8.53 | -61.0 | -57.5 | -59.3 | ||
| Kansas site between north and south flow path | |||||||||
| 51 | KPL Dakota | -11.55 | -84.0 | ||||||
| Kansas sites, HPA wells | |||||||||
| 48 | Leoti HPA | -9.24 | -9.24 | -62.0 | -62.0 | ||||
| 69 | Leoti HPA | -8.93 | -9.00 | -8.97 | -61.0 | -61.5 | -61.2 | ||
| KS05 | Scott City 4 | -9.40 | -9.40 | -60.5 | -60.5 | ||||
| KS08 | KPL HPA | -10.11 | -10.11 | -74.5 | -74.5 | ||||
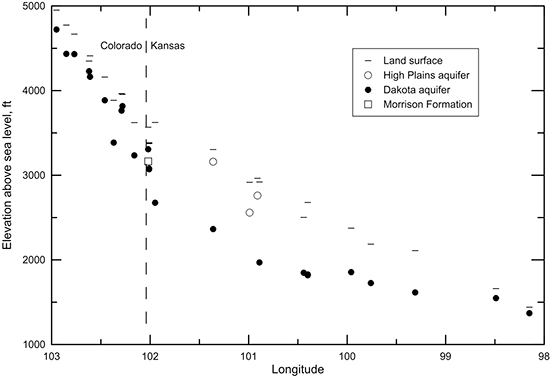
Figure 39 is a cross section depicting the elevations of the land surface and the middle of the screened interval of the wells sampled. A decrease in the general slope of the land surface is apparent near the boundary between Colorado and Kansas. The groundwater flow in the Colorado subregion of the cross section is primarily within a local flow system. The cross section in Kansas is confined until the farthest eastern well, although the confining strata are thin enough at the next to most eastern well that vertical recharge through the confining unit is sufficient to appreciably change the water chemistry. The eastern-most well is in the local recharge and discharge flow system of the outcropping Dakota aquifer. The cross section graphically illustrates that the wells in the Dakota aquifer are generally shallower in the western and eastern local flow areas and deeper in the confined portion of the aquifer in western Kansas. Points for the three water-supply wells in the HPA and the observation well in the Morrison Formation in southwestern Kansas near the Colorado border sampled during the Dakota program and cooperative studies are included in fig. 39.
Figure 39--Elevation of the land surface and the middle of the screened interval for wells sampled along a regional flow path of the Dakota aquifer from southeast Colorado to central Kansas.
Profiles of Salinity and Major Constituents
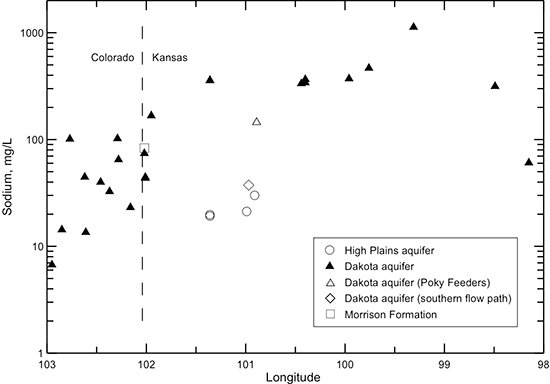
Figures 40-45 illustrate changes in TDS and major constituent concentrations and properties along the flow path from southeastern Colorado to central Kansas shown in figs. 38 and 39. One of the Dakota well samples (Poky Feeders well in southern Scott County) is represented as a different symbol (open triangle) because the chemical and isotopic composition indicate that enough water from bedrock overlying the Dakota aquifer and/or the HPA mixed with the Dakota water to cause appreciable changes in some of the chemical characteristics. This may be due to a gravel pack that extends up into the HPA sediments or a leaky seal in the well above the Dakota aquifer. The Dakota groundwater collected from Finney County (KPL power plant) near a flow path in the aquifer to the south of that in fig. 38 is plotted as a different symbol (open diamond) in the figures to show the chemical contrast with groundwaters in the northern flow path. The Finney County well lies near the boundary where Dakota strata become confined by overlying Upper Cretaceous shale. South of the boundary, the Dakota aquifer is directly overlain by the HPA. Points for the waters sampled from the overlying HPA (open circles) and underlying Morrison Formation (open square) are also plotted for comparison to the Dakota groundwaters in the flow cross section.
Figure 40--Change in TDS concentration in water from wells along regional flow paths of the Dakota aquifer.
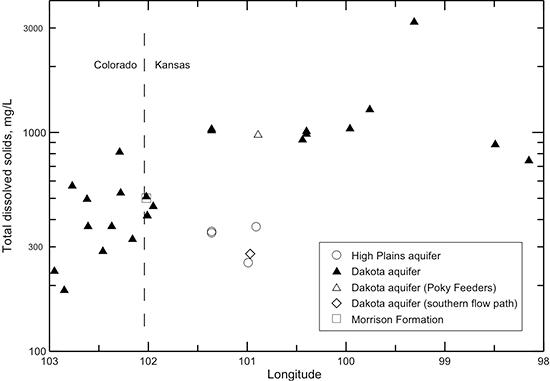
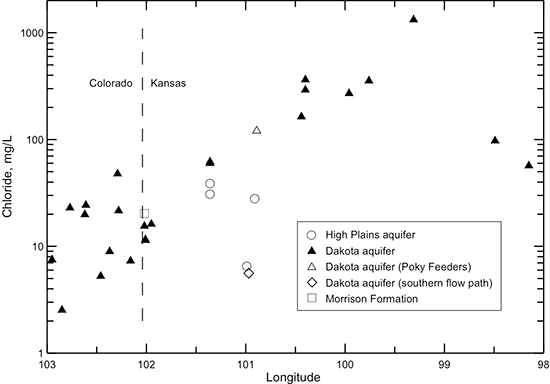
Figure 41--Change in chloride concentration in water from wells along regional flow paths of the Dakota aquifer.
Groundwater in the Dakota aquifer is fresh in the recharge and local flow area of southeast Colorado. The TDS concentration increases to about 1,000 mg/L in water in the confined aquifer in western Kansas and then increases substantially in the zone of Permian saltwater intrusion in the confined aquifer in central Kansas (fig. 40). The TDS content then decreases farther to the east in the discharge and local flow system of the outcrop/subcrop belt where freshwater recharge flushes and dilutes saline water in the Dakota aquifer. The TDS concentrations in groundwaters in the HPA overlying the confined aquifer in west-central Kansas, the underlying Morrison Formation near the Colorado border, and Dakota aquifer in the southern flow path are all in the same range as for the Dakota groundwaters in southeastern Colorado.
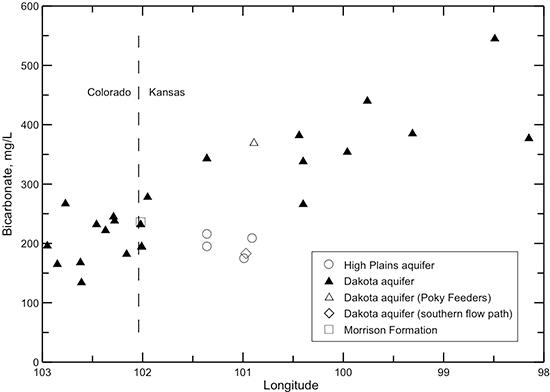
The chloride concentration is low (mainly less than 30 mg/L) in the Dakota aquifer in the southeast Colorado and westernmost Kansas part of the profile (fig. 41). The chloride content increases in a general logarithmic trend along the flow path through the confined aquifer. The highest chloride concentration is located in central Kansas where the Dakota aquifer overlies the area of greatest intrusion of Permian saltwater. The chloride concentration in the HPA overlying the Dakota aquifer and in the Dakota aquifer along the southern flow path is generally similar to that in southeastern Colorado. Although chloride is the predominant anion contributing to the large increase in TDS concentration in the Dakota aquifer in central Kansas, other anions are more important for the TDS content increase in the confined aquifer near and west of 101° longitude. Dissolved sulfate (fig. 42) generally contributes a greater proportion of the anionic composition in groundwaters in southeast Colorado and in Kansas near and west of 101° longitude than chloride. The sulfate concentration is sometimes higher than the bicarbonate concentration in these areas (fig. 43), resulting in sulfate-type waters. Farther to the east along the flow path, the sulfate content varies substantially, whereas the bicarbonate concentration shows an increasing trend. Sulfate and bicarbonate contents of groundwaters in the HPA along the southern flow path and in the Dakota aquifer to the south near and within the unconfined areas tend to be substantially lower than in Dakota aquifer waters in the northern flow path at the same longitude. The range in bicarbonate concentration at a location along the flow path is generally much smaller than that for sulfate.
Figure 42--Change in sulfate concentration in water from wells along regional flow paths of the Dakota aquifer.
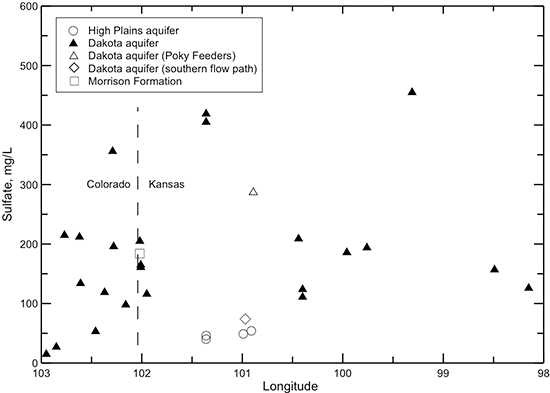
Figure 43--Change in bicarbonate concentration in water from wells along regional flow paths of the Dakota aquifer.
Sodium concentration in Dakota waters along the flow path (fig. 44) follows a similar pattern as for the TDS content (fig. 40). The sodium profile is also similar to that of chloride except that the sodium concentration increases at a greater rate than chloride concentration with distance through southeast Colorado into the confined area of west-central Kansas. The sodium content then remains relatively constant until reaching the main saltwater intrusion area in central Kansas, where it increases substantially. Sodium concentration in the HPA and the unconfined Dakota aquifer to the south is substantially smaller than in the confined area of west-central Kansas and is in the lower part of the range for Dakota waters in southeast Colorado.
Figure 44--Change in sodium concentration in water from wells along regional flow paths of the Dakota aquifer.
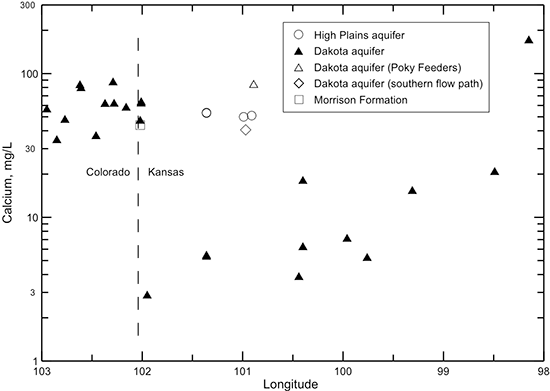
The profile of calcium concentration across the flow path (fig. 45) is substantially different from the profiles for TDS, chloride, and sodium concentrations. The magnesium profile is similar to that for calcium and is not shown. Dissolved calcium and magnesium concentrations have smaller ranges than those for sodium and chloride in Dakota aquifer freshwater from southeast Colorado to near the Colorado-Kansas line. Calcium and magnesium concentrations are appreciably smaller in the confined Dakota aquifer in western and central Kansas than in the local flow area of the Dakota aquifer in southeast Colorado. The change to low calcium and magnesium levels along the flow path is especially great as the water enters the confined area in western Kansas. Calcium and magnesium concentrations then generally increase along the flow path within the confined aquifer from west to central Kansas.
Figure 45--Change in calcium concentration in water from wells along regional flow paths of the Dakota aquifer.
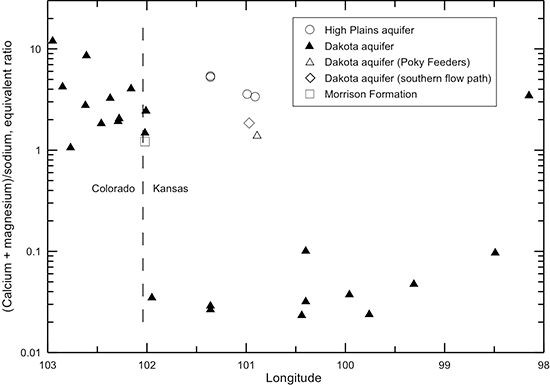
The nearly three orders-of-magnitude change in the (calcium + magnesium)/sodium equivalent ratio across the flow path in the Dakota aquifer from southeastern Colorado through Kansas (fig. 46) is related to carbonate equilibria and cation exchange. Groundwaters in southeast Colorado initially derive calcium and magnesium from leaching of carbonate minerals concentrated in soils in an environment of greater evapotranspiration than precipitation. The aquifer is well flushed in this area; thus, any previous saline water in the aquifer has been essentially all removed and sodium and chloride concentrations in the groundwater are low. The flushing in the Dakota aquifer in southeast Colorado has been extensive enough to also remove high sodium contents adsorbed on clays deposited in brackish or marine environments or subjected to later saltwater intrusion from underlying Permian strata. Thus, any former capacity of high adsorbed sodium content to soften recharge waters has been largely removed, and recharge, usually of calcium-bicarbonate type, retains its higher calcium-plus-magnesium than sodium content. Additional calcium in the Dakota aquifer in the recharge area is probably obtained from calcite dissolution in the bedrock as well as dissolution of secondary gypsum. As described earlier, secondary gypsum in the strata can be precipitated from locally high concentrations of sulfate derived from pyrite oxidation coupled with high calcium from increased dissolution of calcite by the acidic solutions produced during the pyrite weathering.
Figure 46--Change in the (calcium + magnesium)/sodium ratio in water from wells along regional flow paths of the Dakota aquifer.
When the calcium-bicarbonate to calcium-sulfate type waters flowing deep enough in the system reach the confined portion of the Dakota aquifer in western Kansas, exchange of calcium and magnesium in the groundwater for sodium on clay surfaces becomes important. This causes softening (decrease in calcium and magnesium concentrations) of the groundwater. The aquifer in the confined area has not been as well flushed as in the local flow areas, leaving high sodium concentrations on marine clays or on clays subjected to saline waters derived from Permian saltwater intrusion in earlier geologic time. The removal of saline groundwater from the confined aquifer is more rapid than the removal of the high adsorbed sodium because the saline water is preferentially diluted and replaced by flow through the larger pore spaces whereas clays are present in higher amounts in the lower permeability sediments. The high exchange capacity of most aquifer clays acts as a reservoir that must be depleted through interactions with large volumes of inflowing water before the adsorbed cation concentrations approach ratios that are in near equilibrium with the inflows and, thus, no longer appreciably change the inflow chemistry (see later section on geochemical modeling of groundwater evolution for further explanation of this phenomenon).
Calcium and magnesium concentrations can become as low as a few mg/L each in the confined Dakota aquifer along the cross section in western Kansas (table 11, fig. 45) as a result of the water-softening process. In contrast, the calcium concentrations in overlying HPA waters and in the Dakota water along the southern flow path are within the range of the Dakota aquifer waters in southeast Colorado. The calcium and magnesium contents and the (calcium + magnesium)/sodium ratio in the Poky Feeders well water are higher than expected for the location in the aquifer. These observations and other evidence discussed later in this subsection indicate that the well probably allowed downward flow of water from the overlying HPA and possibly some groundwater of calcium-sulfate type from the Upper Cretaceous shales and chalks overlying the Dakota aquifer at this location. The downward flow was probably in the gravel pack of the annular space of the well, which is a common construction practice for stock and irrigation wells in Kansas. The TDS content in the HPA in the area of the Poky Feeders well is higher than in other parts of the aquifer due to the effect of evapotranspiration concentration of dissolved solids in the closed Whitewoman Basin.
After the abrupt decrease in the (calcium + magnesium)/sodium ratio from the local to the confined flow system near the Colorado-Kansas state line, the ratio remains low along the flow path until the confining layer thins in central Kansas (fig. 46). Flushing of the saline water that intrudes from the underlying Cedar Hills Sandstone and removal of the high adsorbed sodium content on clays by recharge in the local flow area in central Kansas allows the return of the water type to calcium-bicarbonate type. The (calcium + magnesium)/sodium ratio in the HPA and Dakota waters near the southern flow path in western Kansas is within the same range as for the Dakota groundwaters in southeast Colorado and in the local recharge-discharge area in central Kansas. Calcium-sulfate type water also occurs in the local flow area in central Kansas as in southeast Colorado. The origin of the water types is probably similar in the different areas.
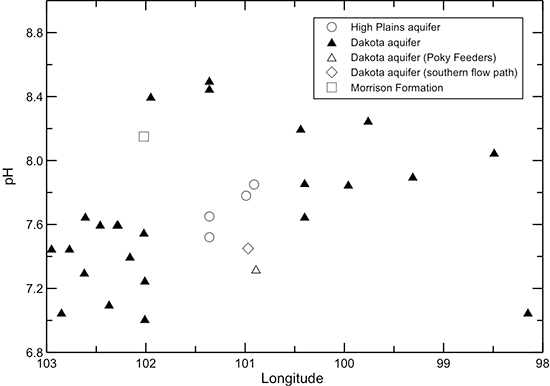
When the dissolved calcium and magnesium concentrations decrease in the Dakota aquifer from cation exchange, the groundwater can become undersaturated with respect to the common carbonate minerals calcite and dolomite. Dissolution of the carbonate minerals can then occur to reestablish saturation conditions. This commonly results in an increase in pH and can also increase the bicarbonate concentration. The profile of pH along the flow path in the Dakota aquifer (fig. 47) indicates that where the (calcium + magnesium)/sodium ratio is low, the pH is generally greater than 7.6. The highest pH values (up to 8.5) occur in the early part of the confined flow path where the cation exchange becomes substantial. Where the (calcium + magnesium)/sodium ratio is relatively high, the pH ranges from near to less than 7.6. The bicarbonate content of the Dakota aquifer water (fig. 43) is also generally greater in the areas of the Dakota aquifer in which the (calcium + magnesium)/sodium ratio is low than where the ratio is relatively high.
Figure 47--Change in pH in water from wells along regional flow paths of the Dakota aquifer.
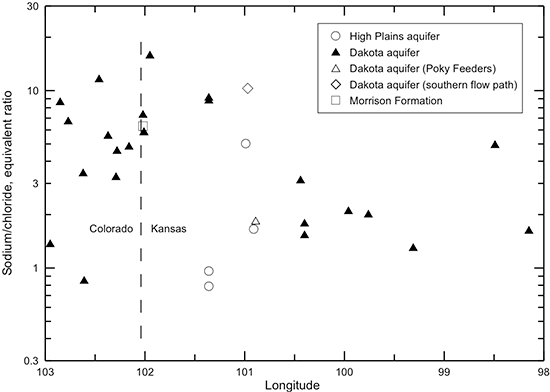
The increase in sodium concentration in Dakota waters along the flow path (fig. 44) is derived from both the water-softening process and increased intrusion of saltwater from the underlying Permian strata as the waters approach central Kansas. Although the sodium concentration is low in the recharge area of southeast Colorado, the sodium/chloride equivalent (or molar) ratio is generally much greater than 1 (fig. 48). The excess sodium could either be adsorbed sodium released by exchange from Dakota sediments previously containing saline water or weathering of minerals that contain sodium. The sodium/chloride ratio reaches a maximum in the confined aquifer in westernmost Kansas where the cation exchange process starts to occur in the confined aquifer and then decreases along the flow path within Kansas as the salinity of the waters increases. The intrusion of saltwater derived from dissolution of halite becomes a much stronger control on the sodium/chloride ratio than the effect of the cation exchange. The sodium/chloride ratio is closest to the theoretical molar ratio of one for halite dissolution at the location with the highest chloride concentration. However, the sodium/chloride ratio is greater than 1 for this water, indicating that cation exchange maintains an excess equivalent concentration of sodium concentration relative to chloride.
Figure 48--Change in the sodium/chloride ratio in water from wells along regional flow paths of the Dakota aquifer.
Profiles of Minor Constituents and Isotopes
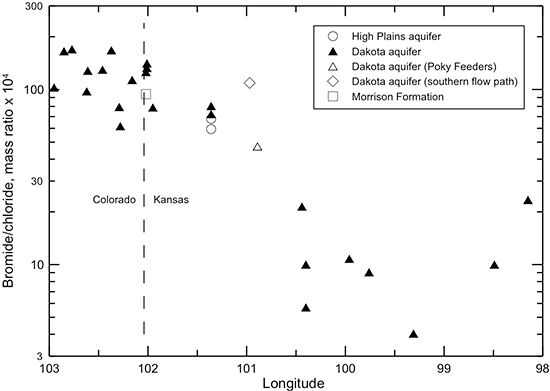
As described earlier in this chapter, the bromide/chloride ratio is useful for determining the source of high chloride concentration in water. The bromide/chloride profile along the flow path in the Dakota aquifer from southeastern Colorado to central Kansas (fig. 49) shows a progressive decrease in the ratio until the last two locations in the path. The pattern in the bromide/chloride profile is approximately the inverse of that for chloride concentration (fig. 41). This is caused by the decrease in the bromide/chloride ratio with increasing chloride concentration for the mixing of freshwater with saltwater derived from the dissolution of halite (fig. 29). Once the chloride concentration exceeds about 150 mg/L along the flow path, the bromide/chloride mass ratio drops below 0.003. The lowest ratio (0.0004) occurs in the sample with the highest chloride concentration (1,363 mg/L) obtained from the confined aquifer in central Kansas where the intrusion of Permian saltwater has a substantial impact on the water quality. The profile illustrates well that the source of increasing chloride in the flow path across the confined Dakota aquifer in Kansas is from the intrusion of saltwater with a halite-dissolution origin. It also indicates that most of the chloride in the Poky Feeders sample fits a similar origin.
Figure 49--Change in the bromide/chloride ratio in water from wells along regional flow paths of the Dakota aquifer.
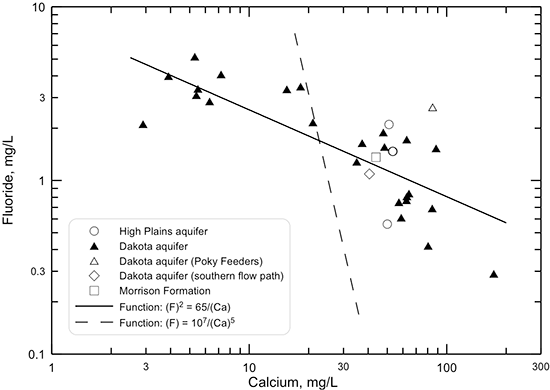
Changes in dissolved fluoride concentration in the Dakota aquifer water along the flow path from southeastern Colorado to central Kansas (fig. 50) are generally inversely related to the calcium concentration (fig. 45) due to the dissolution of fluoride-containing calcium minerals as described in the earlier section in this chapter on geochemical factors. The profile shows that the fluoride content is greatest in the main part of the confined flow path in Kansas where the water has low calcium concentration from cation exchange. A simple function, the square of the fluoride concentration equal to a constant divided by calcium concentration (the solid line shown in fig. 51) generally fits the fluoride-calcium relationship for Dakota groundwaters along the flow path, as expected if the simplest calcium-fluoride mineral, fluorite (CaF2) primarily controlled the dissolved fluoride concentration. That is because the solubility product (a constant at a particular temperature and pressure) for fluoride equals the product of the activities (effective concentrations in solution) of calcium and of the square of fluoride. Other minerals that could control dissolved fluoride concentration are apatites, which are calcium fluorophosphates, such as fluorapatite (Ca5(PO4)3F). The relationship of fluoride to calcium concentration for fluorapatite would be expected to be related to a function in which the fluoride concentration was inversely proportional to calcium concentration raised to the 5th power. This function plots as the dashed line on fig. 51 and does not fit the sample data as well as that based on (F)2. The character of the actual minerals controlling dissolved fluoride and the effect of ionic strength of the aquifer waters on the activity coefficients in the solubility products of the minerals would determine the actual shape of the function best fitting the data. However, the functions displayed as lines in fig. 51 suggest that fluorite could play the major role in controlling dissolved fluoride concentration in Dakota groundwater. Adsorption of fluoride on clays could be a minor factor controlling the dissolved fluoride content.
Figure 50--Change in fluoride concentration in water from wells along regional flow paths of the Dakota aquifer.
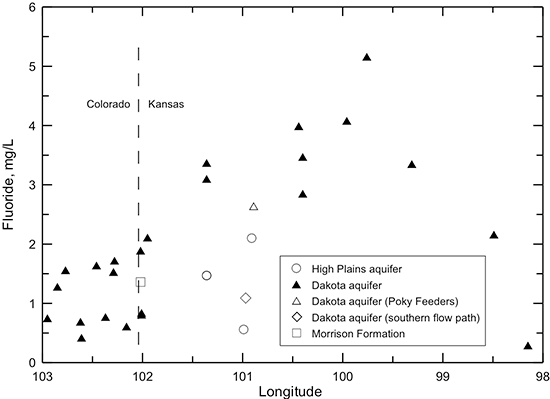
Figure 51--Relationship between fluoride and calcium concentrations in water from wells along regional flow paths of the Dakota aquifer. The fluoride and calcium values in the functions for the lines are fluoride and calcium concentrations.
The profiles for nitrate and ammonium ion concentrations in Dakota groundwaters (fig. 52) are, in general, inversely related. Freshwater samples from the Dakota aquifer in southeast Colorado had a nitrate-nitrogen concentration that was either in the few to several mg/L range or was undetectable. One of the samples from southeast Colorado with undetectable nitrate contained a small concentration of ammonium ion. Except for the Poky Feeders well water, the samples from the confined Dakota aquifer in Kansas did not contain detectable nitrate content but ranged from a few tenths to more than one mg/L of ammonium ion. The sample from the Poky Feeders well contained 4.3 mg/L dissolved nitrate-nitrogen but no detectable ammonium ion, in contrast with what would be expected for the confined aquifer at that location. This indicates that a surface or near-surface source of water had entered the well water before collection of the sample. Groundwaters in the Dakota aquifer along the southern flow path and in the HPA overlying the confined Dakota aquifer contain measurable nitrate content but undetectable ammonium ion. The water in the unconfined Dakota aquifer at the eastern end of the flow path had a substantial concentration of nitrate but no detectable ammonium ion.
Figure 52--Change in ammonium ion and nitrate concentrations in water from wells along regional flow paths of the Dakota aquifer. Points representing determinations below the detection limit are shown as values of half the detection limit.
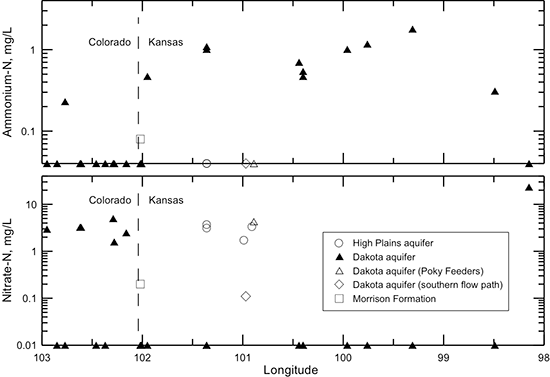
The major geochemical control on whether nitrate or ammonium ion is present at detectable limits common to analyses for these constituents is the oxidation potential of the groundwater. The data illustrate the change in the chemical environment from usually oxidizing or intermediate in oxidation potential in the local flow system of southeast Colorado, in which nitrogen in the form of nitrate is stable, to a reducing environment along the regional flow path through the confined aquifer, in which the reduced form of nitrogen as ammonium ion is stable, then back to a more oxidizing environment in the local flow system of central Kansas. Dissolved iron and manganese concentrations (defined as the amounts determined in the samples filtered through 0.45 µm membrane filter paper in the field, table 13) also illustrate changes in the oxidation-reduction potential of the groundwaters (fig. 53). Dissolved iron and manganese contents in the local flow system of southeast Colorado range substantially from less than 10 and less than 1 µg/L, respectively, up to about 1,000 and 100 µg/L, respectively. In the confined Dakota aquifer along the northern flow path, iron and manganese concentrations are typically greater than 30 and 3 µg/L, respectively. The iron and manganese contents can then again be low in the local flow system of central Kansas (fig. 53), which usually has measurable nitrate and undetectable ammonium ion concentrations, because the groundwater generally is in an oxidizing environment. The groundwater sampled in the unconfined Dakota along the southern regional flow path is generally not reducing enough to contain detectable ammonium ion but can have a low enough oxidation potential to contain measurable dissolved iron and manganese concentrations. In general, the HPA waters are oxidizing enough that they do not contain detectable amounts of dissolved iron and manganese. Tables 12 and 13 indicate that when a groundwater in the Dakota aquifer contains both dissolved iron and manganese concentrations greater than 40 and greater than 4 µg/L, respectively, the nitrate-nitrogen content is usually less than 1 mg/L and commonly less than 0.1 mg/L. Based on these same tables, when the ammonium ion concentration in Dakota groundwater is greater than 0.2 mg/L, the dissolved iron and manganese contents are usually greater than 40 and greater than 4 µg/L, respectively.
Figure 53--Change in dissolved iron and manganese concentrations in water from wells along regional flow paths of the Dakota aquifer. Points representing determinations below the detection limit are shown as values on the x-axis.
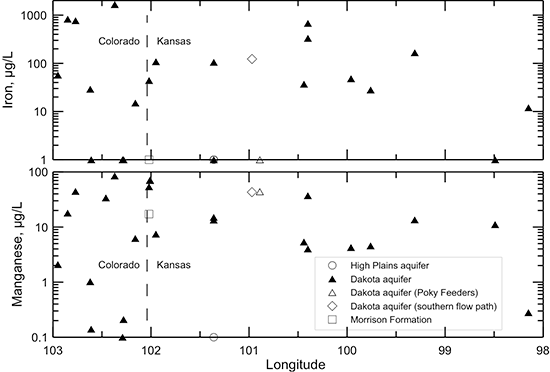
For other trace metal or semimetal concentrations in table 13, no clear patterns emerge related to dissolved nitrate, ammonium ion, iron, and manganese concentrations and oxidizing to reducing conditions in the Dakota aquifer along the flow paths. A general pattern exists for the concentration of uranium and uranium series radionuclides, radium, and ionizing radiation (alpha and beta) (table 14) and oxidation-reduction environments along the flow paths of the Dakota aquifer. Some of the waters in the local flow systems in southeast Colorado and central Kansas that are expected to exist in an oxidizing environment (no detectable ammonium ion, nitrate-nitrogen greater than 1 mg/L) contain greater than 10 µg/L dissolved uranium. The groundwaters occurring in a reducing environment (ammonium-nitrogen greater than 0.2 mg/L) have very low uranium concentrations (usually less than 0.3 mg/L). This fits the relatively high solubility of the oxidized state of uranium, U(VI), present as the dissolved uranyl ion UO22+ and its complexes, especially carbonate complexes, in water. In a reducing environment, minerals that contain the reduced state of uranium, U(IV), such as uraninite (UO2) and coffinite (USiO4), which have low solubility, occur (Langmuir, 1997). Thus, groundwater in the confined portion of the Dakota flow path tends to have low uranium concentration. Groundwater with a reducing environment in the confined part of the flow path also commonly has low concentrations of radium and alpha and beta radiation (table 14). In the local flow portions of the system, groundwater can sometimes contain a gross alpha value (as uranium-natural) of about 40 pCi/L or greater, in which case the gross alpha minus uranium can be near 10 pCi/L or above, the gross beta greater than 20 pCi/L (reported as Sr/Yt-90), the Ra-226 greater than 1 pCi/L, and the Ra-228 greater than 2 pCi/L.
The radioactive isotope of hydrogen, tritium (3H), has a half-life of 12.35 yrs. Natural levels of tritium measured in the atmosphere before the first atmospheric test of a thermonuclear explosion were about 4 to 25 TU (tritium units) (Fontes, 1980). Recharge from precipitation entering a groundwater system before explosion of thermonuclear devices would start with this level of tritium. If the groundwater became isolated from meteoric precipitation, even the highest level of pre-bomb tritium would decay to less than 1 TU in about 60 years and to less than 0.1 TU (about the detection limit for tritium by modern methods) after approximately 100 years. Atmospheric tests of thermonuclear bombs extended from 1952 to 1963 and produced levels of tritium in the northern hemisphere that exceeded 100 TU during most of that period and reached more than 2,000 TU (Fontes, 1980). Thus, post-1952 recharge to groundwater in Colorado and Kansas introduced a measurable signal of tritium that can be used to indicate whether a groundwater sample contains relatively recent atmospheric precipitation.
The tritium profile of groundwater along the flow path for the Dakota aquifer (fig. 54) illustrates that some of the water sampled in southeastern Colorado contained a significant amount of relatively recent recharge, as indicated by a tritium concentration of greater than 3 TU. Some Dakota groundwaters in southeastern Colorado and all the waters along the regional flow path in the confined aquifer contained less than 2 TU. The age of meteoric recharge in the confined Dakota aquifer along the regional flow path greatly exceeds 100 years (Clark et al., 1998). Thus, the low levels of tritium content between the detection limit and 2 TU probably represent very small amounts of surface or near-surface water that leaked down into the sampled wells. The relatively substantial concentration of tritium in the groundwater from the Poky Feeders well indicates an appreciable amount of recent meteoric water was in the sample. This substantiates the explanation for the differences in water chemistry for this sample described earlier in this chapter as leakage of surface or shallow groundwater. The two samples of Dakota water at the easternmost part of the flow path contained substantial tritium concentration, also indicating the presence of relatively recent recharge. Even though the second to most eastern well is in the confined aquifer, the well is relatively shallow, the confining unit is thin, and the topography indicates that the flow system is local, which is consistent with the tritium level observed. Groundwater samples from the Dakota aquifer along the southern flow path, as well as one of the samples from the HPA, did not contain detectable tritium content, indicating that the recharge was more than 100 years old. Other HPA waters contained from low to moderate levels of tritium, indicating either recent recharge that naturally entered the groundwater or leakage along the annular space of the wells.
Figure 54--Change in tritium concentration in water from wells along regional flow paths of the Dakota aquifer.
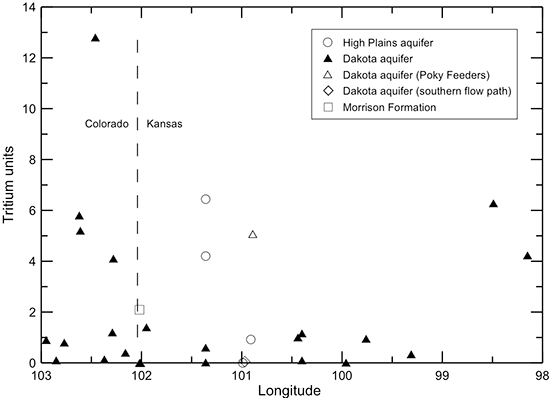
The stable isotope geochemistry of oxygen and hydrogen in water is useful for assessing changes in the environment of precipitation that recharged groundwater. Various factors--such as the distance from the ocean, the altitude, the temperature of precipitation formation, and the amount of precipitation--affect the stable isotopic composition of oxygen and hydrogen (Mazor, 1991). The isotopic composition of water is expressed as the amount of O-18 and deuterium in the units δ18O ‰ and δD ‰, respectively. The profiles of δ18O ‰ and δD ‰ along flow paths in the Dakota aquifer (fig. 55, based on data in table 15) indicate that the ranges in δ18O ‰ and δD ‰ for the confined part of the Dakota flow path from the Colorado-Kansas line to longitude 99 degrees are appreciably narrower than those for the local flow system in southeast Colorado. The water from the CSU Experiment Station contained the lowest δ18O ‰ and δD ‰ values. This water sample is the only one in southeast Colorado with a detectable ammonium ion concentration. Thus, the reducing environment present in the Dakota aquifer interval in which this well is screened suggests that the Dakota strata may be more confined than at the other sites. The Dakota groundwaters with the highest δ18O ‰ and δD ‰ values are in the local flow system of southeast Colorado near Kansas and in the local flow system at the end of the flow path in central Kansas. The δ18O ‰ and δD ‰ values for the sample from the Poky Feeders well and for some of the samples from the HPA are also high. The stable isotope values for the groundwater in the Morrison Formation are in the range of the main confined zone of the Dakota flow path in Kansas.
Figure 55--Change in the stable isotopic composition of water from wells along regional flow paths of the Dakota aquifer.
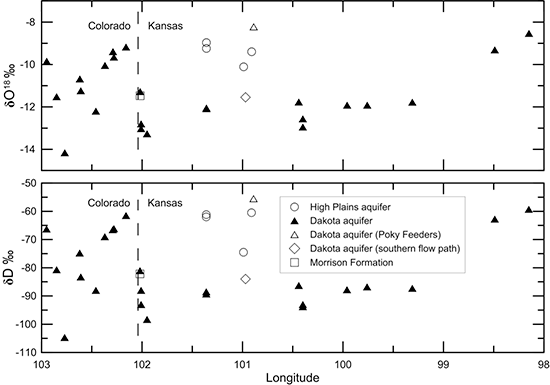
The distance from the ocean and the altitude of the well locations have been essentially constant during the last 100,000 years. However, the temperature of rainfall formation and the rain intensity pattern during seasons is expected to have been different in the past. Lower temperatures and greater rates of rainfall result in a lighter (more negative) isotopic composition of δ18O ‰ and δD ‰. The older, more confined groundwaters in the system are interpreted to be those with lower δ18O ‰ and δD ‰ values that reflect cooler and wetter conditions in the past that provided the source of recharge to the Dakota aquifer. The groundwater in the Morrison Formation also fits in this category. The highest (least negative) δ18O ‰ and δD ‰ represent more recent rainfall recharge. For example, the chemical constituent data described earlier in this section for the sample from the Poky Feeders well indicate a mixture of surface or shallow groundwater with the Dakota groundwater. The high δ18O ‰ and δD ‰ data also reflect this interpretation.
Other geochemical aspects of the Dakota flow paths in southeast Colorado and Kansas that are related to the age dating of the water are discussed in Clark et al. (1998) and Macfarlane et al. (2000).
Vertical Geochemical Changes
Saltwater occurs in the Permian rocks underlying the Dakota aquifer in much of Kansas. The saltwater intruded into Dakota aquifer strata in the geologic past and continues to intrude at varying rates into the overlying aquifer. Freshwater recharge from the surface and lateral flow of that recharge have been diluting and flushing the saline water from the aquifer at a faster rate than upward intrusion of the saltwater. Thus, the salinity in the Dakota aquifer generally increases with depth. The rate of salinity change with depth is seldom uniform; the TDS concentration is usually substantially greater below low-permeability layers that impede either the upward transport of saline water or the downward movement of fresh groundwater recharge, depending on the local hydraulic gradient. Salinity can also increase with depth within a thick sandstone if saltwater occurs in underlying units.
The substantially greater permeability of the sandstone units within the Dakota aquifer in comparison with the shales can allow a faster rate of flushing of salinity by fresher regional flow. The general inverse correlation of the particle size of the Dakota sediments with TDS concentrations in areas where some salinity exists, primarily in the confined aquifer, means that there can be substantial local differences in both the vertical and areal distribution of water quality depending on the particular sandstone-to-shale ratio. Often, the better the water-yielding characteristics of the aquifer, the better the water quality within a given area. In some locations where a substantial sandstone receiving regional flow lies below low-permeability rocks in the Dakota aquifer, the water can be fresher in the sandstone than in the overlying, less permeable units.
Regional Changes
Although a general increase in salinity with depth occurs within subregions of the Dakota aquifer, differences in the geohydrology among subregions result in a wide-range of TDS concentration with depth across the aquifer in Kansas (fig. 56). This is also true for concentrations of the major constituents, such as chloride and sulfate (figs. 57 and 58). A more recognizable relationship exists between depth and (calcium + magnesium)/sodium ratio for the Dakota aquifer (fig. 59). In general, the greater the depth, the lower the ratio. This reflects higher values of the ratio for shallow groundwaters, which are often of calcium, magnesium-bicarbonate type, in comparison with deeper waters that have undergone cation exchange of calcium and magnesium for sodium on clays during recharge and saltwater flushing by the fresher waters. The chemical signature of water affected by the exchange process tends to occur more commonly in the confined aquifer (fig. 59). Recharge by freshwater occurs more easily in the unconfined aquifer and has largely flushed out waters with a low (calcium + magnesium)/sodium ratio as the clays have lost their water-softening capacity with time after substantial throughflow by recharge water.
Figure 56--Well depth versus TDS concentration in groundwaters in the Dakota aquifer.
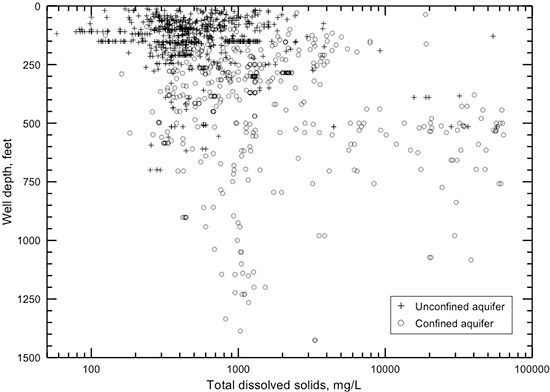
Figure 57--Well depth versus chloride concentration in groundwater in the Dakota aquifer.
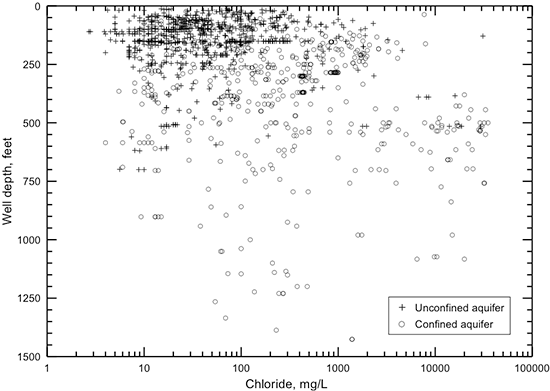
Figure 58--Well depth versus sulfate concentration in groundwater in the Dakota aquifer.
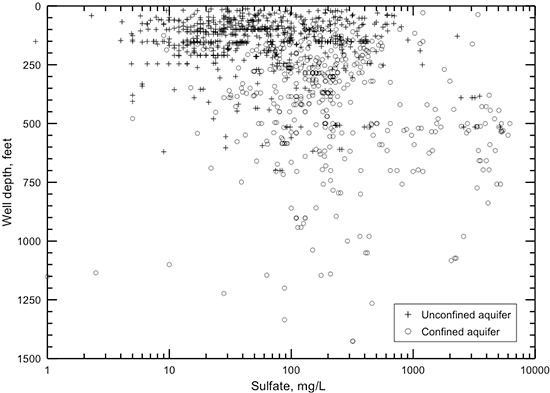
Figure 59--Well depth versus (calcium + magnesium)/sodium ratio based on equivalent concentrations in groundwater in the Dakota aquifer.
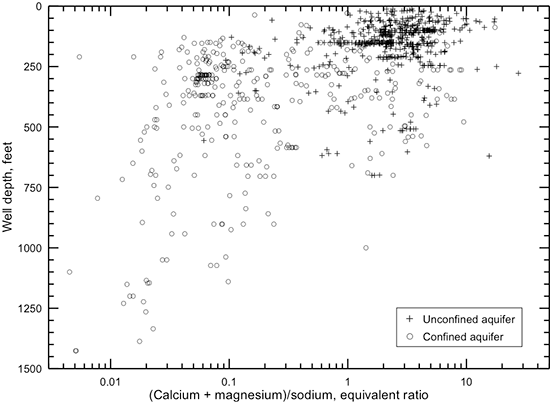
Fluoride concentration in the Dakota aquifer generally increases with depth (fig. 60) and tends to be higher in the confined aquifer than the unconfined aquifer for similar depths. These trends are associated with the inverse change in the calcium concentration and (calcium + magnesium)/sodium ratio with depth and the lower ratios in the confined than the unconfined aquifer. Lower calcium and magnesium concentrations in the aquifer water allow greater dissolution of minerals that contain calcium and fluoride. The higher salinity of water associated with greater sodium content has a small added effect of increased mineral dissolution associated with the higher ionic strength of the water. Thus, greater fluoride concentration is often associated with sodium-bicarbonate or mixed cation-anion type waters. In the confined region, fluoride usually increases and calcium decreases with depth from the top of the Dakota, then fluoride decreases and calcium increases with depth at the bottom of the Dakota system where saltwater occurs. Dispersion and diffusion of sodium-chloride water from underlying Permian rocks into the lower part of the Dakota aquifer largely saturates clay surfaces with sodium. Where calcium-bicarbonate or calcium-sulfate waters with low fluoride from upper Cretaceous rocks enter the upper part of the underlying Dakota aquifer, exchange of calcium for sodium on clays substantially lowers the calcium concentration within the aquifer to levels at which fluorite and/or fluoride-containing apatite phases can dissolve.
Figure 60--Well depth versus fluoride concentration in groundwater in the Dakota aquifer.
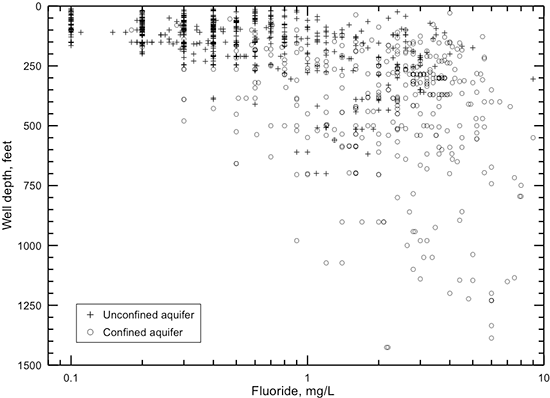
Nitrate concentration tends to be the highest (greater than 10 mg/L as nitrate-nitrogen) in the unconfined aquifer at depths less than 200 ft (fig. 25), indicating a surface source of contamination, as previously described in the section in this chapter on characteristics of contaminated groundwater. Many unconfined aquifer and most confined aquifer waters contain less than 2 mg/L nitrate-nitrogen. As described earlier, the confined aquifer waters with greater than 2 mg/L nitrate-nitrogen probably represent wells in which contaminated water from the surface or near surface can flow down a poorly sealed or unsealed annular space and enter the confined aquifer.
Site-Specific Changes
The greatest salinity changes with depth occur across substantial shale units with appreciable lateral extent that confine or separate aquifer units. Where the Graneros Shale is laterally continuous over miles (not isolated strata separated by multiple valleys), it can separate fresh or slightly saline water in the Greenhorn Limestone from very saline water (greater than 10,000 mg/L TDS) in the Dakota aquifer. Shales with a continuous lateral extent within the Dakota can also produce confined conditions in which saline waters are protected from significant flushing by fresh recharge. In addition, shallow Dakota groundwater located in river valleys can be affected by local upward discharge of saltwater from deeper in the aquifer as a result of local groundwater flow and discharge to rivers. For example, the depth from land surface to the top of the Dakota Formation is 108 ft (33 m) at the location of an observation well in upland northwest of Beloit in north-central Mitchell County (NW NE NE sec. 36, T. 6 S., R. 8 W.). The surface elevation of the location at the well site north of the Solomon River is about 100 ft (30 m) higher than that of the floodplain. The TDS, chloride, and sulfate concentrations were 19,000, 7,940, and 3,060 mg/L, respectively, in groundwater from the screened interval depth of 110-160 ft (34-49 m). Fresh groundwater occurs in the Dakota Formation along the outcrop/subcrop boundary several miles to the southeast of this observation well.
Where the Kiowa Formation is mainly shale, it can separate saltwater in the Cheyenne Sandstone from substantially less saline water in the overlying Dakota Formation. An example is saline water in the Dakota Formation at Gorham in Russell County (NW SW NE sec. 32, T. 13 S., R. 15 W.) with TDS, chloride, and sulfate concentrations of 3,570, 1,700, and 345 mg/L, respectively, at a screened interval depth of 200-210 ft (61-64 m). Groundwater in the Cheyenne Sandstone at a depth interval of 470-480 ft (143-146 m) contained TDS, chloride, and sulfate concentrations of 44,000, 22,100, and 4,650 mg/L, respectively.
The importance of a low-permeability zone on vertical salinity changes within the Dakota Formation is illustrated by data from water samples and geophysical logs for the Jones site (NE NE NE sec. 2, T. 10 S., R. 8 W.) in north-central Lincoln County along the border with Mitchell County. Two observation wells and a pumping well were drilled as a part of the Dakota Aquifer Program along the side of a hill above Rattlesnake Creek. Although the Graneros Shale overlies the Dakota Formation at the well location, the shale only extends along the upland between Salt Creek to the north and Rattlesnake Creek to the south. The limited shale cover and the avenue for discharge of groundwater from the upper Dakota Formation along the lower hillsides allowed freshwater recharge to flush saltwater out of the upper Dakota sands. The groundwater in the upper Dakota sandstone at a depth interval of 76-96 ft (23-29 m) contained TDS, chloride, and sulfate concentrations of 416, 31, and 63 mg/L, respectively. Nearly 60 ft (18 m) of siltstone and shale with thin sandstones separates the upper aquifer sandstones from a 100-ft (30-m) thickness of sandstone at a depth interval of 170-225 ft (52-69 m) in the lower Dakota Formation. Water from an observation well screened at a depth of 135-145 ft (41-44 m) within the siltstone and shale interval contained chloride and sulfate concentrations of 3,250 and 907 mg/L, respectively. The salinity of the Dakota Formation increased through the low-permeability zone to the 100-ft (30-m) sandstone interval. The TDS content of the groundwater in the lower part of the 100-ft (30-m) sandstone is assumed to be similar to the salinity of the low flow in Rattlesnake Creek below the well site because the saline water in the creek is expected to have been derived primarily from discharge of groundwater from the 100-ft (30-m) sandstone interval. Water collected from the creek during the same period as the sampling of the 135-145 ft (41-44 m) well had chloride and sulfate concentrations of 10,800 and 3,760 mg/L, respectively.
In the confined aquifer, recharge passing through the overlying upper Cretaceous limestones and shales can have appreciably higher calcium, magnesium, and sulfate concentrations than in fresh to slightly saline portions of the upper Dakota aquifer. An example of the changes with depth in these and other dissolved constituents and TDS in the Dakota Formation is illustrated by the water chemistry for a test hole drilled in 1992 during exploration for water resources in the Dakota aquifer by the City of Hays (figs. 61-64). The test hole was located in southwest Ellis County above the western edge of where the Cedar Hills Sandstone directly underlies the Dakota aquifer and allows a greater rate of saltwater intrusion from the Permian to the Dakota aquifer base than where shales separate the strata. The depth interval for the Dakota Formation is 295-548 ft (90-167 m) in the test hole; the hole then penetrated the Kiowa Formation starting at 548 ft (167 m) before drilling was stopped at 595 ft (181 m). The lithology of the Dakota interval at the location is mainly siltstone and sandstone and of the Kiowa Formation is siltstone and shale.
The TDS concentration of groundwater at the test-hole location generally increases by a relatively small amount in the upper to middle part of the siltstone and sandstone interval of the Dakota Formation, then increases markedly in the lower portion from just above the Kiowa Formation and into the Kiowa (fig. 61). The sulfate content decreases in the uppermost part of the interval and then does not change substantially, whereas both the sodium and chloride concentrations increase appreciably across the interval (fig. 62). The calcium concentration decreases greatly and the magnesium content declines more moderately in the uppermost part of the Dakota Formation, followed by relatively small changes in the rest of the interval (fig. 63). The decrease in calcium and magnesium and the increase in sodium content caused by the cation exchange (softening process) is marked in the upper part of the Dakota aquifer, as indicated by the large decrease in the (calcium + magnesium)/sodium ratio (fig. 64). A small increase in the sodium/chloride ratio occurs in the uppermost Dakota Formation, followed by a more substantial decline in the lower part of the Dakota and Kiowa interval caused by the intrusion of saltwater from the underlying strata (fig. 64). The fluoride concentration follows a pattern with depth opposite to that of the calcium because the low calcium concentration within the aquifer waters allows fluoride-containing calcium minerals to dissolve (fig. 63). Dissolved fluoride then decreases with depth at the bottom of the Dakota aquifer and into Permian strata (below the interval shown in fig. 63) where calcium concentration is much greater in the saline water. The TDS and constituent concentration and ratio changes with depth in figs. 61-64 parallel the changes along the regional flow-path in the Dakota aquifer (figs. 40-42, 44-46, 48, and 50) from the recharge area near the southeast Colorado-southwest Kansas border to the saline water in the confined aquifer in central Kansas.
Figure 61--Depth profile of TDS concentration in the Dakota aquifer for samples collected during drilling of a test hole in southwest Ellis County.
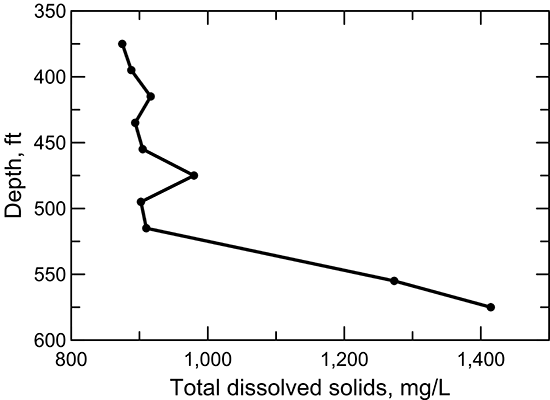
Figure 62--Depth profile of sodium, chloride, and sulfate concentrations in the Dakota aquifer based on data for a test hole in southwest Ellis County.
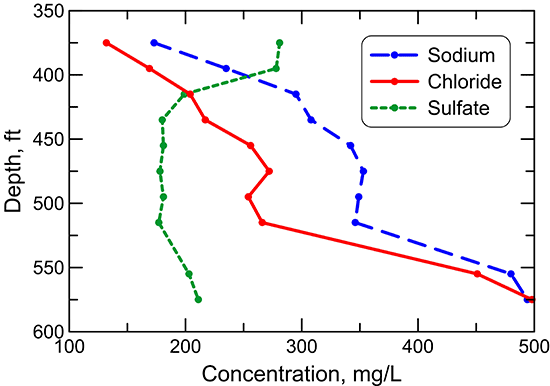
Figure 63--Depth profile of calcium, magnesium, and fluoride concentrations in the Dakota aquifer based on data for a test hole in southwest Ellis County.
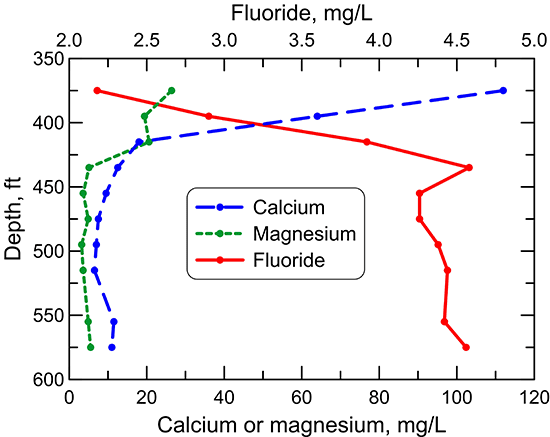
Figure 64--Depth profile of equivalent ratios of sodium/chloride, sulfate/chloride, and (calcium + magnesium)/sodium in the Dakota aquifer based on data for a test hole in southwest Ellis County.
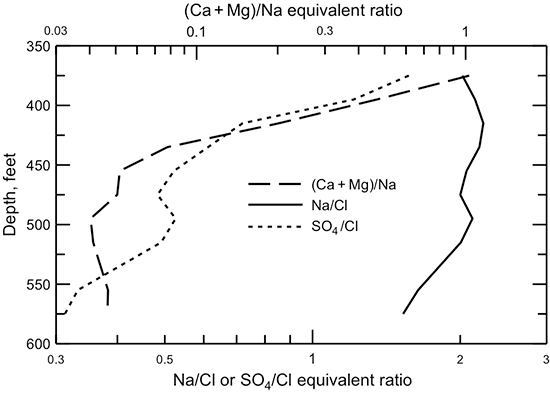
Changes in Russell County
Russell County is an area where some of the greatest spatial variations in salinity in Dakota aquifer waters occur (fig. 32). The groundwater in the Dakota aquifer is most saline in western Russell County where the base of the Dakota aquifer directly overlies the saltwater-containing Cedar Hills Sandstone. Regional flow in the confined aquifer in the western part of the county discharges saline water to river valleys. Where the upper Cretaceous confining units are thin or absent, local recharge and discharge systems have flushed much of the saltwater in the upper aquifer. The freshest water occurs in the uppermost part of the confined and outcropping Dakota Formation in eastern Russell County. Water-quality data for test wells drilled during an exploration for water supply for the City of Russell by Ground Water Associates (GWA) illustrate the vertical increase in the salinity of water in the Dakota aquifer and the importance of low permeability units in separating low- from high-salinity zones. The KGS chemically analyzed many of the samples to determine whether there was any oil brine contamination contributing to the chloride content of the water; no detectable evidence of an oil-brine source was found in the test-hole waters. Most of the test wells drilled for GWA were in southeast Russell County. These included 12 test wells in nine different sections in an area 7 by 7 mi (11 by 11 km) (table 16). The wells were located in the upland between the valleys of the Smoky Hill and Saline rivers. Most of the wells penetrated a small thickness of upper Cretaceous strata above the Dakota Formation, although a few wells were at the edge of the outcrop/subcrop boundary of the Dakota strata (fig. 1). The chemical data for water samples from the test wells are in table 17.
Table 16--Sample interval information for test holes drilled into the Dakota Formation by Ground Water Associates in Russell County.
| Test-hole number |
Graph symbol |
Legal location | Sample depth interval, ft |
Depth to middle of sample interval, ft |
Elevation of land surface, ft |
Middle of sample interval, elevation, ft |
Depth to top of first Dakota sand, ft |
Elevation to top of first Dakota sand, ft |
Depth of sample interval below top sand, ft |
|---|---|---|---|---|---|---|---|---|---|
| TH 4-92 | C | 13S-12W-31DDDD | 261-282 | 271.5 | 1,853 | 1,581.5 | 137 | 1,716 | 134.5 |
| TH 4-92 | C | 13S-12W-31DDDD | 310-331 | 320.5 | 1,853 | 1,532.5 | 137 | 1,716 | 183.5 |
| TH 5-92 | D | 13S-12W-25CCCB | 261-282 | 271.5 | 1,813 | 1,541.5 | 200 | 1,613 | 141.5 |
| TH 5-92 | D | 13S-12W-25CCCB | 282-303 | 292.5 | 1,813 | 1,520.5 | 200 | 1,613 | 162.5 |
| TH 6-92 | E | 13S-12W-36AAAB | 219-240 | 229.5 | 1,792 | 1,562.5 | 193 | 1,599 | 112.5 |
| TH 6-92 | E | 13S-12W-36AAAB | 240-261 | 250.5 | 1,792 | 1,541.5 | 193 | 1,599 | 133.5 |
| TH 2-93 | F | 13S-11W-30CBBB | 264-284 | 274 | 1,809 | 1,535 | 175 | 1,634 | 143 |
| TH 3-93 | G | 14S-12W-11BBBB | 209-230 | 219.5 | 1,807 | 1,587.5 | 130 | 1,677 | 114.5 |
| TH 3-93 | G | 14S-12W-11BBBB | 272-293 | 282.5 | 1,807 | 1,524.5 | 130 | 1,677 | 177.5 |
| TH 3-93 | G | 14S-12W-11BBBB | 293-314 | 303.5 | 1,807 | 1,503.5 | 130 | 1,677 | 198.5 |
| TH 4-93 | H | 14S-12W-12CBCC | 65-75 | 70 | 1,735 | 1,665 | 47 | 1,688 | 27 |
| TH 4-93 | H | 14S-12W-12CBCC | 135-145 | 140 | 1,735 | 1,595 | 47 | 1,688 | 97 |
| TH 4-93 | H | 14S-12W-12CBCC | 220-230 | 225 | 1,735 | 1,510 | 47 | 1,688 | 182 |
| TH 5-93 | J | 14S-12W-12CBCC | 55-75 | 65 | 1,735 | 1,670 | 47 | 1,688 | 26 |
| TH 6-93 | K | 14S-12W-09AABB | 221-242 | 231.5 | 1,822 | 1,590.5 | 126 | 1,696 | 113.5 |
| TH 7-93 | L | 14S-11W-30BAAB | 41-62 | 51.5 | 1,671 | 1,619.5 | 47 | 1,624 | 85.5 |
| TH 7-93 | L | 14S-11W-30BAAB | 105-126 | 115.5 | 1,671 | 1,555.5 | 47 | 1,624 | 149.5 |
| TH 7-93 | L | 14S-11W-30BAAB | 126-147 | 136.5 | 1,671 | 1,534.5 | 47 | 1,624 | 170.5 |
| TH 8-93 | M | 14S-12W-23DDDA | 152-173 | 162.5 | 1,695 | 1,532.5 | 62 | 1,633 | 172.5 |
| TH 10-93 | N | 14S-12W-23CCCC | 113-124 | 118.5 | 1,710 | 1,591.5 | 45 | 1,665 | 113.5 |
| TH 11-93 | O | 14S-11W-30ADDD | 96-117 | 106.5 | 1,636 | 1,529.5 | 21 | 1,615 | 175.5 |
| TH 11-93 | O | 14S-11W-30ADDD | 117-138 | 127.5 | 1,636 | 1,508.5 | 21 | 1,615 | 196.5 |
Table 17--Chemical data for samples collected from test holes drilled into the Dakota Formation by Ground Water Associates in Russell County. The analytical data are from KGS analyses except where noted as analyzed by Servi-Tech for GWA.
| Test-hole number |
Graph symbol |
Legal location |
Sample date |
TDS sum mg/La |
Ca mg/L |
Mg mg/L |
Na mg/L |
HCO3 mg/Lc |
SO4 mg/L |
Cl mg/L |
F mg/L |
NO3-N mg/L |
|---|---|---|---|---|---|---|---|---|---|---|---|---|
| TH 4-92 | C | 13S-12W-31DDDD | 9/17/92 | 3,640 | 80 | 52 | 1,230 | (254) | 405 | 1,736 | 1.21 | 2.6 a |
| TH 4-92 | C | 13S-12W-31DDDD | 9/16/92 | 3,696 | 79 | 52 | 1,260 | (381) | 405 | 1,712 | 1.16 | < 0.1 a |
| TH 5-92 | D | 13S-12W-25CCCB | 9/28/92 | 1,274 | 5.2 | 2.4 | 477 | (427) | 214 | 326 | 4.58 | 7.8 a |
| TH 5-92 | D | 13S-12W-25CCCB | 9/28/92 | 1,551 | 40 | 20 | 525 | (400) | 233 | 535 | 1.22 | < 0.1 a |
| TH 6-92 | E | 13S-12W-36AAAB | 9/30/92 | 815 | 24 | 9.8 | 261 | (223) | 184 | 187 | 2.52 | 8.4 a |
| TH 6-92 | E | 13S-12W-36AAAB | 9/30/92 | 1,099 | 7.2 | 3 | 405 | (295) | 221 | 307 | 2.54 | 1.8 a |
| TH 2-93 | F | 13S-11W-30CBBB | 6/4/93 | 1,511 | 36 | 19 | 513 | 398 | 338 | 400 | 1.60 | < 0.02 |
| TH 3-93 | G | 14S-12W-11BBBB | 6/10/93 | 926 | 47 | 15 | 266 | 335 | 267 | 154 | 1.74 | 0.36 |
| TH 3-93 | G | 14S-12W-11BBBB | 6/9/93 | 5,745 | 77 | 58 | 2,080 | 484 | 481 | 2,790 | 2.14 | 0.07 |
| TH 3-93 | G | 14S-12W-11BBBB | 6/9/93 | 7,137 | 100 | 81 | 2,570 | 528 | 603 | 3,500 | 2.25 | 0.09 |
| TH 4-93 | H | 14S-12W-12CBCC | 6/16/93 | 926 | 231 | 17 | 46.3 | 225 | 416 | 67.8 | 0.26 | 7.41 |
| TH 4-93 | H | 14S-12W-12CBCC | 6/16/93 | 587 | 43 | 11 | 161 | 256 | 111 | 126 | 1.06 | 0.41 |
| TH 4-93 | H | 14S-12W-12CBCC | 6/16/93 | 12,307 | 146 | 131 | 4,410 | 492 | 861 | 6,490 | 1.77 | 0.14 |
| TH 5-93 | J | 14S-12W-12CBCC | 6/17/93 | 281b | 18b | 45b | 77b | 0.24b | ||||
| TH 6-93 | K | 14S-12W-09AABB | 6/21/93 | 1,164 | 122 | 29 | 235 | 299 | 489 | 133 | 0.76 | 0.09 |
| TH 7-93 | L | 14S-11W-30BAAB | 9/29/93 | 1,628 | 81 | 21 | 503 | 361 | 213 | 620 | 1.27 | 0.75 |
| TH 7-93 | L | 14S-11W-30BAAB | 9/29/93 | 2,090 | 93 | 24 | 663 | 383 | 237 | 874 | 1.33 | 0.11 |
| TH 7-93 | L | 14S-11W-30BAAB | 9/28/93 | 3,388 | 105 | 35 | 1,130 | 419 | 280 | 1,617 | 1.83 | 0.09 |
| TH 8-93 | M | 14S-12W-23DDDA | 9/30/93 | 1,259 | 106 | 18 | 340 | 393 | 182 | 412 | 0.86 | 0.05 |
| TH 10-93 | N | 14S-12W-23CCCC | 10/5/93 | 2,062 | 24 | 13 | 772 | 454 | 139 | 879 | 3.26 | 0.02 |
| TH 11-93 | O | 14S-11W-30ADDD | 10/10/93 | 2,271 | 137 | 30 | 672 | 327 | 289 | 970 | 1.22 | 0.14 |
| TH 11-93 | O | 14S-11W-30ADDD | 10/10/93 | 2,884 | 103 | 29 | 943 | 398 | 286 | 1,313 | 1.54 | 0.05 |
| a Analysis by Servi-Tech b Sum of constituents in table plus an estimated 15 mg/L SiO2 c Values in parenthesis were calculated from the charge balance difference. |
||||||||||||
The salinity of the waters in the Russell County test holes generally increases with depth. Figure 65 illustrates the change in TDS concentration for the test-hole waters with depth from land surface to the middle of the sample interval, elevation of the sample interval, and the sample interval depth below the top of the Dakota Formation (or extrapolation of the top where eroded). The lines in the figures connect the letter symbols (listed in tables 16 and 17) that represent groundwaters from different depths in the same test hole. An individual letter symbol without a connecting line indicates that a water sample was collected from only one depth in a test well. Plots B and C in fig. 65 are relatively similar because the top elevation of the Dakota Formation does not change substantially across the area. The relative spread in the vertical dimension for the points in the figures is smaller for graphs B and C than for graph A in fig. 65. This indicates that the vertical location within the Dakota strata can be a better predictor of the salinity than the depth below land surface within an area with substantial differences in topographic surface elevation. However, below a depth of 130 ft (40 m) from the top of the Dakota Formation, a large spread in the salinity exists at the same depth or elevation. The data also show that water in sandstone bodies near the outcrop boundary can be more saline than water at the same depth below land surface but at a higher elevation in the Dakota where overlain by Upper Cretaceous rocks. In general, water at the same depth below the top of the Dakota Formation is fresher on the northern than on the southern flank of the upland between the Saline and Smoky Hill River valleys because the gentle north-northeast dip of the strata and lower elevation of the Saline River valley appear to have resulted in deeper flushing of the aquifer by fresh recharge.
Figure 65--TDS concentration versus depth below land surface (A), elevation (B), and depth below the top of the Dakota Formation (C) of the middle of the sample interval for test wells in Russell County. See tables 16 and 17 for identification of letter symbols.
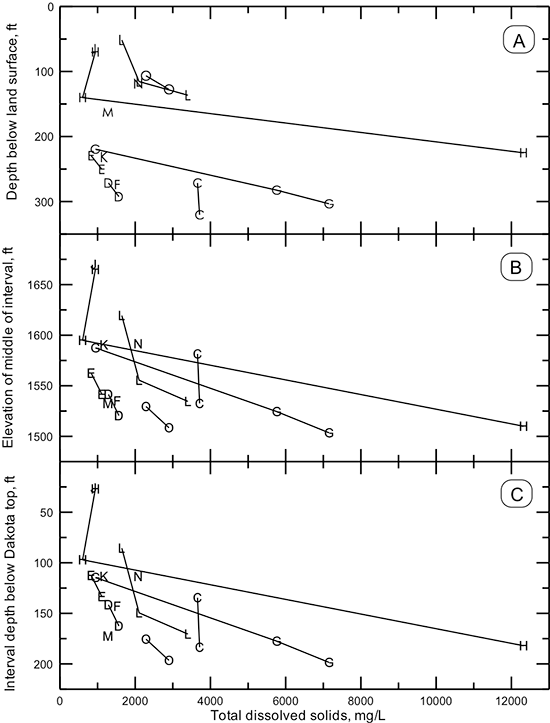
Figures 66 and 67 illustrate changes in selected, individual constituent concentrations with depth for the same test-hole samples in Russell County as for fig. 65. The letter symbols and connecting lines in all three figures represent the same samples and test holes as listed in tables 16 and 17. The main dissolved constituents that control the range in salinities of the Russell County waters are sodium and chloride (table 17). Sulfate concentration in the groundwaters is substantial (111-861 mg/L) but has an appreciably smaller range than chloride content (67.8-6,490 mg/L). Sulfate concentration increases moderately with depth in some of the test wells (fig. 66A) in comparison with chloride content, which increases substantially with depth (fig. 66B). The sulfate concentration in the Dakota aquifer waters has both external and internal sources: the saltwater that intrudes from Permian strata into the overlying Dakota, oxidation of pyrite within the aquifer sediments, and sulfate in groundwater flowing from the overlying upper Cretaceous strata, where present, which is derived from pyrite oxidation or dissolution of gypsum. The chloride source is mainly the external, upward intrusion of saltwater from the underlying Permian strata.
Figure 66--Sulfate (A) and chloride (B) concentrations versus elevation of the middle of the sample interval for test wells in Russell County. See tables 16 and 17 for identification of letter symbols.
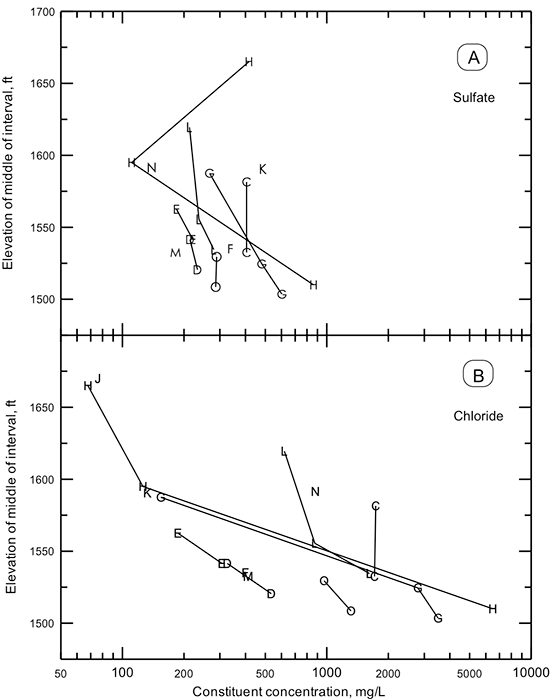
Figure 67--Nitrate (A) and fluoride (B) concentrations versus elevation of the middle of the sample interval for test wells drilled in Russell County. See tables 16 and 17 for identification of letter symbols.
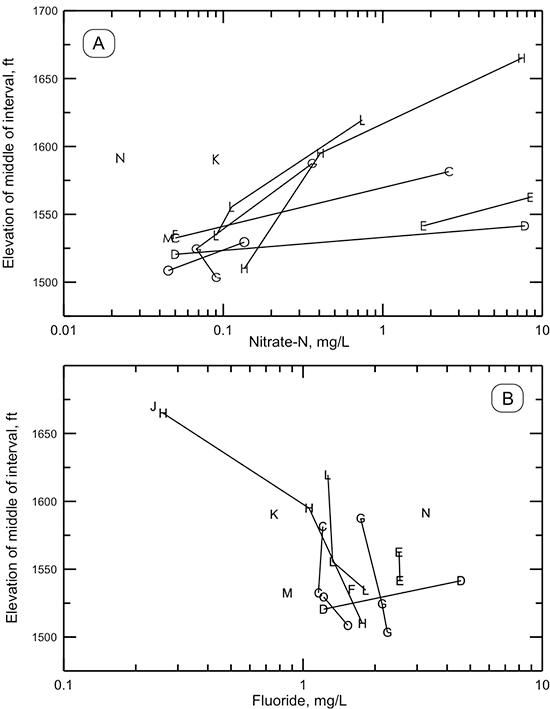
Nitrate concentration (less than 0.1-8.4 mg/L) generally decreases with depth in the test holes in the Dakota aquifer in Russell County (fig. 67A), pointing to a surface source of nitrate. Half of the detection limit was used as the value for plotting nitrate content in the figure to include all samples for which nitrate was determined. Nitrate-nitrogen levels are less than a mg/L in the Dakota aquifer in this area where not impacted by surface sources.
The range in fluoride concentration (0.24-4.58 mg/L) is substantial for the relatively small area in which the test holes are located (fig. 67B). Although the correlation of fluoride content with depth is not as apparent as for nitrate, fluoride values do increase with depth in some of the test holes. The areal and vertical changes in fluoride concentration in the Dakota Formation in Russell reflect the influence of mineral equilibria conditions in the aquifer as indicated by the inverse relationship of fluoride versus calcium concentrations (fig. 68), which is similar to the relationship shown for the regional flow paths in fig. 51. An even better correlation exists between the fluoride concentration and the equivalent ratio of (calcium + magnesium)/sodium (fig. 69). The correlation is high enough that the (calcium + magnesium)/sodium ratio could be used as a predictor of fluoride content in the Dakota groundwater in this area of Russell County. Figure 69 includes a simple function that fits the data and that could be used to estimate fluoride content from calcium, magnesium, and sodium concentrations. The reason that the correlation between fluoride content and the cation ratio is better than between fluoride and calcium concentrations could be related to the ionic strength effect on the cation ratios. The values in a solubility product equation such as for the mineral fluorite are activities of dissolved ions and not concentrations. The activities of dissolved constituents in solution are a product of activity coefficients and the concentration; the activity coefficient depends on the ionic charge of a dissolved species (-1 for fluoride and +2 for calcium) as well as the ionic strength.
Figure 68--Fluoride versus calcium concentrations for test well waters in Russell County. The function for the line is the same as in Figure 51 that is based on the calcium and fluoride relationship in fluorite.
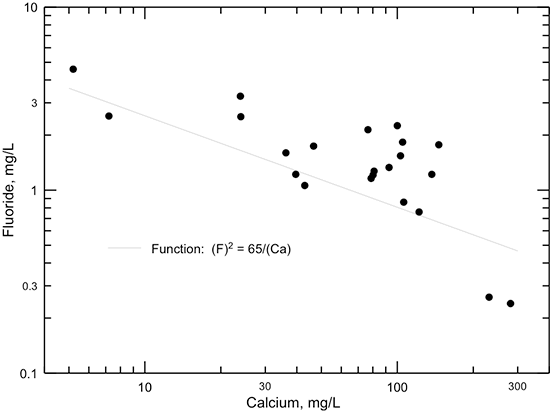
Figure 69--Fluoride concentration versus (calcium + magnesium)/sodium ratio based on equivalent concentrations for test well waters in Russell County. The function is a visual fit to the data and is nearly the same as a more complicated function based on a computed best fit to the data, for which the R2 is 0.905.
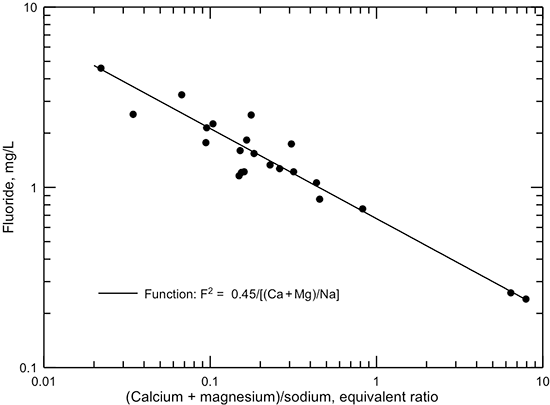
Geochemical Modeling of Groundwater Evolution
Chemical data for groundwater samples indicate that distinct chemical water types occur in different regions of the Dakota aquifer system. These water types have been generated by a combination of mixing of groundwaters of different chemical types and chemical reactions that occur in response to rock-water interactions. Cation exchange and concomitant mineral dissolution and precipitation are the main reactions that affect water chemistry. Mixing of fresh groundwater (derived from the interaction of surface recharge with Dakota sediments) and saline groundwater (affected by the intrusion of saltwater from underlying Permian strata) in the Dakota aquifer is the main factor setting up conditions for substantial chemical changes in the aquifer. These geochemical and mixing processes were simulated by numerical modeling to better understand the evolution of groundwater in the Dakota aquifer in central and north-central Kansas. The modeling was conducted by T.-M. Chu for his doctoral dissertation (Chu, 1995). A model of one-dimensional flow coupled with chemical reactions (1-D model) was developed to simulate the hydrogeochemical processes involving cation exchange and calcite precipitation/dissolution along a hypothetical flow path in the aquifer. A model of two-dimensional flow coupled with chemical reactions (2-D model) was designed to simulate a chemical transition zone along a subregional lateral profile that incorporated geohydrologic complexities of the Dakota aquifer. The following sections on the 1-D and 2-D models are summaries of the modeling results in Chu's (1995) dissertation.
Chemical Water Types and Mixing
The profiles of water chemistry described in the section on regional groundwater geochemistry in this chapter indicate the general changes in chemical water types in the Dakota aquifer along the regional flow path from the recharge area in southeast Colorado, through the confined aquifer in southwestern and west-central Kansas, and to the discharge area in central Kansas (figs. 41-46). The water type changes from predominantly calcium-bicarbonate in the unconfined aquifer in the recharge zone to sodium-bicarbonate that typically occurs in the confined aquifer in west-central Kansas. As the regional flow in the confined Dakota aquifer approaches the western edge of the subcrop of the Cedar Hills Sandstone, the salinity of the confined Dakota groundwater increases substantially from the intruding saltwater and the water changes to sodium-chloride type. The groundwaters are then diluted by local recharge to the east of the Cedar Hill subcrop and revert primarily to calcium-bicarbonate in the outcrop zone of the unconfined aquifer in central and north-central Kansas.
The vertical profile of water chemistry in the confined Dakota aquifer in central Kansas just west of the Cedar Hills subcrop is somewhat similar to that along parts of the regional profile from southeast Colorado to central Kansas. A small amount of recharge enters the top of the confined Dakota aquifer from the overlying confining beds of the upper Cretaceous strata. This groundwater typically ranges in composition from calcium-bicarbonate to calcium-sulfate type. For example, fresh groundwater in the upper Cretaceous Greenhorn Limestone is commonly of calcium-bicarbonate type and has a composition that is relatively similar to that of groundwater with similar TDS concentration in the unconfined Dakota aquifer. Groundwater in the Greenhorn Limestone also ranges to calcium-sulfate in type. The vertical profile of groundwater in the confined Dakota aquifer at a borehole in southwest Ellis County (figs. 61-64) represents a change from fresh, calcium-sulfate water derived from upper Cretaceous recharge at the top of the profile, to sodium-bicarbonate type water in the middle of the profile, to saline, sodium-chloride type water in the lower part of the profile.
The origin of the saline water now present in the Dakota aquifer is predominantly from halite dissolution, as indicated by bromide-chloride relationships (see discussion of bromide in the subsection on minor and trace dissolved constituents in this appendix). The substantial decrease in the bromide/chloride ratio that results from the mixing of fresh groundwater with saltwater in the Dakota aquifer is illustrated by the points within the two mixing-curve boundaries, which represent Dakota water uncontaminated by oil field brine, in fig. 29. This decrease reflects the low bromide/chloride ratio in saltwater from halite dissolution that is derived from underlying Permian formations such as the Cedar Hills Sandstone. Although the bromide/chloride ratio in saltwater in the Dakota aquifer ranges up to about twice that of natural saltwater with the same chloride concentration in Permian strata in Kansas, the ratio places a maximum limit of only a couple percent of remnant seawater in the Dakota aquifer. This seawater could potentially come from slow diffusion from the thickest shale units in the Dakota strata. Alternatively, the additional bromide could come from the diagenesis of organics enriched in bromide in thick shales followed by diffusion from these shales. Overall, the bromide-chloride relationships indicate that salinity in the Dakota aquifer evolved from a seawater origin after deposition in marine to brackish environments to a halite-dissolution source over time as caused by saltwater intrusion from underlying Permian strata.
The high sodium content in seawater that was in the pores of Dakota sediments, such as in estuarine, beach, and deltaic environments, would have adsorbed on clays in the sediments to give very low (calcium + magnesium)/sodium ratios for the exchangeable ions on the clays. The later intrusion of saltwater from underlying Permian strata would also have produced very low (calcium + magnesium)/sodium ratios for the exchangeable ions on the Dakota sediments. Fresh groundwaters of calcium-bicarbonate or calcium-sulfate type have a high (calcium + magnesium)/sodium ratio. Recharge of this freshwater into the Dakota aquifer containing saline water would not only dilute the salinity but cause cation exchange of calcium (and other divalent alkaline earth elements, primarily magnesium and strontium) for sodium on clay surfaces. The change in the calcium and magnesium concentrations and the ionic strength of the water caused by the mixing and cation exchange alters the ion activity products relative to minerals that are prevalent in the aquifer sediments, especially the carbonate minerals calcite and dolomite. Dissolution or precipitation of these carbonates result from the chemical changes.
The coupled flow and reaction models for the Dakota aquifer were designed to simulate the primary chemical changes in the system resulting from the mixing of groundwaters with differing salinities along a flow path and the accompanying cation exchange and major mineral dissolution-precipitation reactions, as described in the preceding paragraphs.
1-D Coupled Flow and Reaction Model
The purpose of the 1-D coupled flow and chemical reaction model was to improve the understanding of the fundamental concepts of coupled hydrogeochemical processes occurring in the Dakota aquifer. Although the general characteristics and factors that cause major chemical changes in the chemistry of Dakota groundwater are known, it is unclear how the concomitant reactions interact with each other during mixing of waters along flow paths in the aquifer. A 1-D model helped to explain these interactions and the evolution of the groundwater chemistry with time along a hypothetic flow path (Chu, 1995).
The numerical modeling program HYDROGEOCHEM (Yeh and Tripathi, 1990, 1991; Yeh, 1992a) was used for the simulation of the 1-D model. HYDROGEOCHEM is a 2-D finite-element coupled transport and chemical reaction model that computes solutions by sequentially iterating between transport and geochemical equilibrium equations. The first step in the solute transport simulation was the determination of a flow field for the model using HYDROFLOW (Yeh, 1992b). Then, the chemical reactions were computed by EQMOD (Yeh, 1992c) based on an ion association and equilibrium constant approach under the assumption of local equilibrium.
The 1-D model simulated the chemical interactions occurring as a result of the mixing of fresh to saline water, having a calcium-bicarbonate composition in equilibrium with calcite, with saltwater of sodium-chloride type, along with the reactions of ion exchange, ion complexing, and calcite dissolution/precipitation. The model grid was designed so that the chemical retardation and conservative mixing front of the incoming freshwater and initial saltwater can all be represented at a particular simulation time with a substantial number of nodes for each stage. A lateral flow path 7 km (4.3 mi) in length and 1 m (3 ft) in depth was used with 200 elements and 402 nodes. The conditions along the top and bottom of the 1-m (3-ft) depth were the same to represent one-dimensional flow. Thus, the model effectively has only 201 unique node results. The grid size varied from 10 to 50 m (33-164 ft) in horizontal distance. An effective porosity of 0.2, a bulk density of 2.0 g/cm3, and a longitudinal dispersivity of 25 m (82 ft) were assigned to the model based on hydrogeologic characteristics of the Dakota aquifer. A constant Darcy flow velocity of 5 x 10⁻³ m/day (0.0164 ft/day) from west to east was used based on the regional hydraulic gradient in the Dakota aquifer in central Kansas and hydraulic conductivity values from available pumping-test data.
A cation-exchange capacity (CEC) of 25 meq/kg of sediment was selected for the model after consideration of CEC determinations made on 22 samples of sandstone, siltstone, and mudstone from the Jones #1 core (see Macfarlane, Doveton, and Whittemore [1998] for lithologic characterization of the strata through which the borehole was drilled). Seven basic chemical components (H+, Ca2+, Mg2+, Na+, CO32-, SO42-, Cl-), six aqueous complex species (OH-, H2CO3, HCO3-, CaSO4o, MgSO4o, NaSO4o), and one mineral (low magnesian calcite, Ca0.95Mg0.05CO3) were included in the model. The equilibrium constants for the complex species and calcite were from the geochemical model SOLMINEQ.88 (Kharaka et al., 1988). The selectivity coefficients for the cation exchange reactions were based on Bruggenwert and Kamphorst (1979) and additional literature review.
The base run for the 1-D model involved freshwater entering the western boundary of the flow path, all of which initially contained saltwater (table 18). The compositions of the incoming freshwater and initial saltwater were based on waters sampled from the Dakota aquifer and the Cedar Hills Sandstone, respectively. These conditions represented the end-member, extreme salinity contrast between the incoming water and initial saltwater. Higher salinities for the incoming water and lower salinities for the initial saltwater were used to examine the sensitivity of the model to ranges in water chemistry. These additional incoming water and initial saltwater compositions were based on chemical analyses of groundwaters sampled from wells in the Dakota aquifer. Adjustments were made to the dissolved constituent concentrations of the analyzed samples before input to the model using geochemical equilibria calculations to satisfy assumptions such as selected sodium/chloride ratios. Additional sensitivity runs were made using different values of CEC and selectivity coefficients (adsorption of magnesium relative to calcium and of calcium relative to sodium) for the aquifer material.
Table 18--Concentrations of dissolved constituents in the incoming freshwater at the western boundary and initial saltwater used in the base run of the 1-D model.
| TDS mg/L |
pH units |
Ca meq/L (mg/L) |
Mg meq/L (mg/L) |
Na meq/L (mg/L) |
HCO3 meq/L (mg/L) |
SO4 meq/L (mg/L) |
Cl meq/L (mg/L) |
|
|---|---|---|---|---|---|---|---|---|
| Incoming water | 450 | 7.1 | 4.87 (98) |
0.884 (10.7) |
1.63 (37.5) |
5.13 (313) |
1.33 (64) |
1.16 (41) |
| Initial saltwater | 76,080 | 7.2 | 37.0 (741) |
159 (1,930) |
1,108 (25,470) |
3.56 (217) |
178 (8,550) |
1,108 (39,280) |
Conservative mixing and transport in the 1-D base run showed that the center (concentration midpoint) of the breakthrough curve or front of freshwater for the conservative constituent chloride dissolved in the water is at 5.17 km (3.21 mi) along the flow path after 2.07 x 10⁵ days (567 years) of travel time (fig. 70). The figure indicates that the saltwater in the aquifer has been flushed by the incoming freshwater up to 3.1 km (1.9 mi) along the flow path. Dispersion caused the curved shape in the flushing front that extends from about 3.1 km (1.9 mi) to slightly downstream of the eastern end of the model.
Figure 70--Dissolved chloride concentration in the groundwater along the 1-D model profile at 567 years resulting from conservative transport.
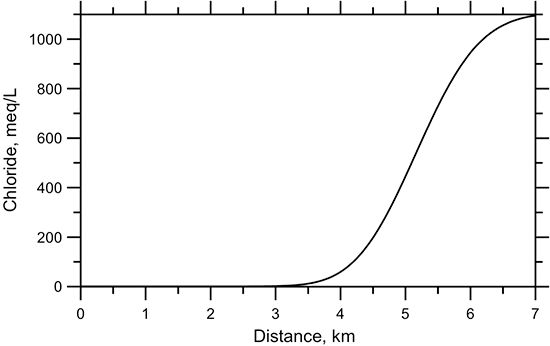
The base model results for the dissolved cations calcium, magnesium, and sodium in the water along the flow path are much different from those for the conservative constituent chloride due to the effect of the cation exchange reactions on the aquifer sediments and calcite dissolution/precipitation (fig. 71). The curves for the dissolved concentrations of calcium and magnesium along the flow path have troughs that represent the removal of these cations by adsorption on the aquifer clay that initially was largely saturated with sodium as a result of equilibrium with a predominantly sodium-chloride solution (fig. 71a and b). The curve for dissolved sodium content has two fronts (fig. 71c), a sharp front near the west end of the flow path and the conservative mixing front in the east half. The shapes of the curves are largely affected by the ion chromatographic process of cation exchange along the flow path.
Figure 71--Dissolved calcium, magnesium, and sodium concentrations in the groundwater along the 1-D model profile at 567 years with cation exchange and calcite dissolution/precipitation.
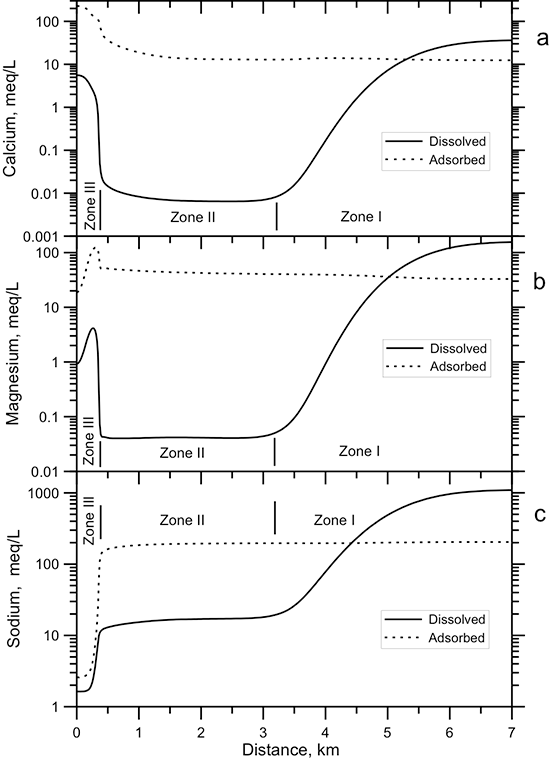
Zone I on the right-hand side of fig. 71 represents the largely unaltered initial saltwater and the conservative mixing front. Zone III is a composite zone that includes the condition near the west edge of the flow path where the aquifer solid (formation sediment) is in equilibrium with the incoming freshwater and a complex transition condition of active cation exchange and calcite dissolution. The shapes of the curves for the different cations in zone III are different due to the different velocities of the retardation fronts of calcium and magnesium that are affected by differences in the incoming concentration, the selectivity coefficients for these cations, and the relative amounts of calcium and magnesium released by calcite dissolution. Zone II is a result of the cation exchange of calcium and magnesium for sodium on clays that occurred in zone III reaching cation ratios similar to those of the cations on the aquifer solids. The much larger cation concentrations adsorbed on the solid than in solution control the cation ratios. The amount of cation exchange from the much lower concentrations of dissolved cations has not yet substantially changed the large buffering capacity of the adsorbed cations in zone II; thus, the (calcium + magnesium)/sodium ratio in the solution is similar in zone II to that in zone I.
Calcite dissolution occurs primarily in zone III and at the western part of zone II (fig. 72). The incoming water is slightly undersaturated with respect to calcite. The amount of calcite that dissolves increases along the flow path in the first part of zone III as the concentration of calcium decreases from adsorption on the aquifer clays in exchange for sodium. The dissolution of calcite releases CO32- ion to solution, much of which converts to dissolved HCO3- by combining with H+ ion from the dissociation of water. The decrease in the H+ ion activity raises the pH (fig. 73), which in turn allows a greater amount of CO32- ion to be in solution based on dissolved carbonate equilibria. Thus, as the water flows along the flow path, the amount of calcite that can dissolve decreases due to the increase in CO32- ion activity.
Figure 72--Dissolution and precipitation of calcite along the 1-D model profile at 567 years.
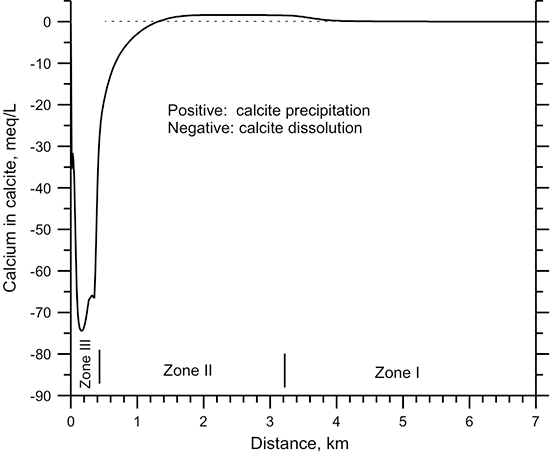
Figure 73--Distribution of pH in the groundwater along the 1-D model profile at 567 years.
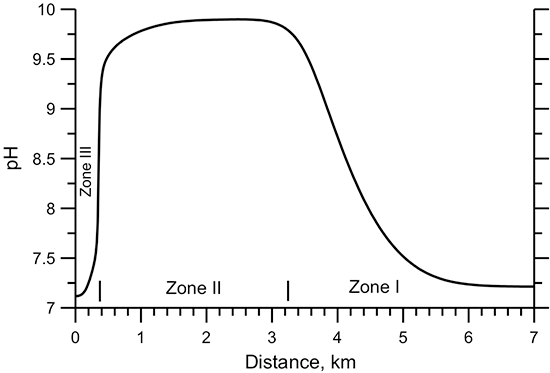
The amounts of calcium and magnesium released to solution through the dissolution of calcite are much greater than the calcium and magnesium concentrations in the incoming water. However, the exchange capacity of the aquifer clay is so great for divalent cations that the extra calcium and magnesium are largely removed from solution by adsorption. If calcite dissolution did not occur, the dissolved calcium and magnesium concentrations would be even lower in zone II than they are with calcite dissolution. The dissolved sodium concentration is greater in zone II with calcite dissolution than without because the extra calcium and magnesium provided by the dissolution increases the amount of sodium exchanged from the aquifer clay. The combined effect of the increased sodium and bicarbonate concentrations in solution raises the TDS content of the water in zone II (fig. 74) above what would be expected from conservative mixing (compare with the curve shape in fig. 70). The dissolved calcium and magnesium concentrations in zone II are relatively small in comparison with the dissolved sodium content (fig. 71). Thus, sodium-bicarbonate type water is generated in zone II.
Figure 74--TDS concentration in the groundwater along the 1-D model profile at 567 years.
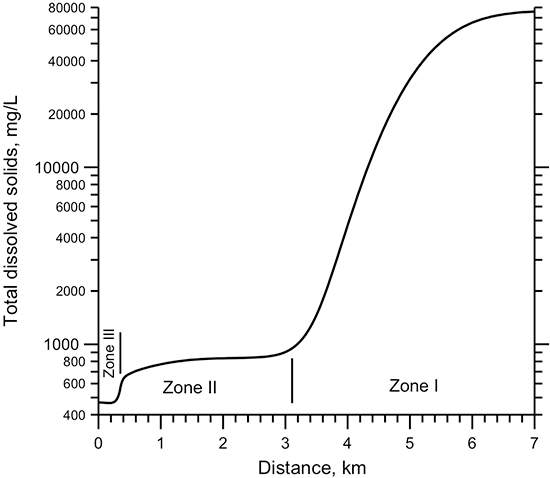
As the dissolved CO32- ion activity increases into the western part of zone II, the solution approaches saturation with respect to calcite. A very small amount of calcite precipitation is indicated in the eastern part of zone II and the westernmost part of zone I in fig. 72, which occurs as a result of the chemical reactions during mixing of water along the flow path. The initial saltwater is saturated with respect to calcite as shown in zone III in fig. 72. The pH exceeds 9.5 units in nearly all of zone II for the base 1-D model (fig. 73). The pH then decreases and the dissolved calcium, magnesium, and sodium concentrations increase in zone I as the water from zone II mixes with the initial saltwater.
The differences between the dissolved cation concentrations with chemical reactions and without the reactions (conservative mixing only) are shown in fig. 75. The magnitudes of the differences are small in zone III because the dissolved concentrations are relatively small. The increase in the amount of sodium with reactions relative to conservative mixing is much larger than that for calcium and magnesium in zone II due to the supply of the divalent cations by calcite dissolution that increases the amount of cation exchange that releases sodium. The sodium peak and the calcium and magnesium troughs in zone I result from the mixing of the high dissolved sodium and low dissolved calcium and magnesium concentrations from cation exchange in zone II with the initial saltwater. The effect of these changes along the flow path not only gives low (calcium + magnesium)/sodium and high sodium/chloride ratios in zone II but also changes these ratios in the western part of zone I from what would be expected from conservative mixing.
Figure 75--Dissolved concentration differences for exchangeable cations between the simulation with reactions and one with only conservative transport (with the same initial and boundary water compositions) along the model flow path at 567 years.
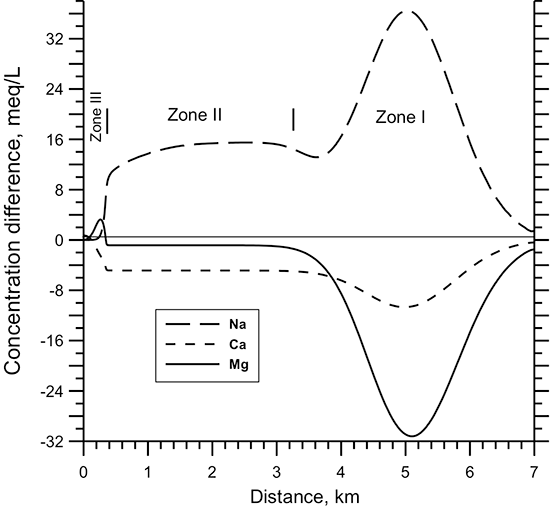
Changes in water chemistry in aquifer systems can be illustrated on a Piper-Hill trilinear diagram (fig. 76). Chemical changes along straight lines on a trilinear diagram are sometimes used to indicate the change from one water type to another during mixing of waters. However, the patterns of chemical changes during evolution of the water chemistry with cation exchange and calcite dissolution as simulated for the Dakota aquifer are not linear in portions of fig. 76. The initial saltwater of sodium-chloride type in the aquifer (at the start of zone I as represented in fig. 76) changes to sodium-bicarbonate type (at the end of zone I) during and after the freshwater mixing front passes a point in the aquifer. The water type (sodium-bicarbonate) remains nearly constant in zone II as indicated by the short evolution paths for this zone in fig. 76. In zone III, the chemistry first evolves to a mixed cation-bicarbonate type before changing to the calcium-bicarbonate type of the incoming water. The changes displayed in fig. 76 indicate that a conservative mixing model is not able to describe the chemical evolution occurring as a result of the chromatographic and dissolution reactions simulated by the coupled geochemical model. The path for a conservative mixing model would be represented by a straight line from the start of zone I to the end of zone II. Although the simulated evolution path is not greatly different from a straight line for the anion triangle, the simulated paths for the cation triangle and the composite diamond parts of the diagram greatly diverge from a straight line connecting the starting and ending compositions.
Figure 76--Evolution of water chemistry along the flow path in the 1-D model with coupled flow and chemical reactions at 567 years. The bicarbonate concentration was assumed to be equal to the total dissolved carbonate concentration. The arrows indicate the evolution direction.
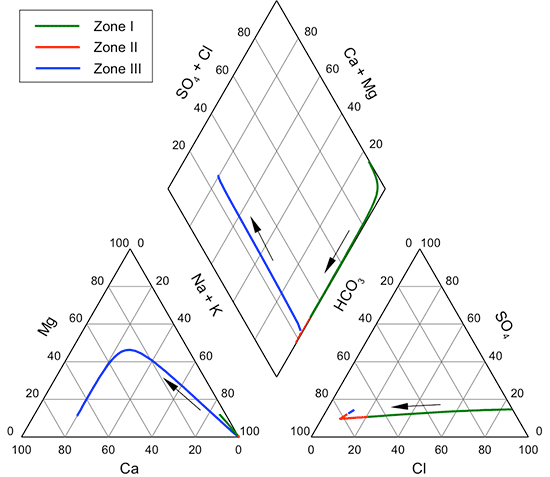
Comparison of fig. 76 with the Piper-Hill diagram displaying water sample data for the Dakota aquifer (fig. 37) indicates that the evolution paths fit parts of the distribution of the observed groundwater chemistry. For example, the distribution of points for the confined aquifer near the axis of the diamond that represents 100% sodium and 0-100% bicarbonate (the lower right-hand axis) fits the evolution path in zone I. The curved evolution path in the cation triangle fits well the maximum extent of the points for observed water composition. Comparison of the path in the cation triangle with the data distribution suggests that the magnesium concentration used for the starting saltwater may have been too high for the actual typical composition of saltwater in the Dakota aquifer derived from intrusion from the Cedar Hills Sandstone. A lower starting magnesium content would have produced a curved evolution path that did not reach as high a magnesium percentage as simulated. Another factor that would cause a lower curve trajectory in the cation triangle would be if the starting freshwater in the simulation had a higher calcium content, such as from gypsum dissolution or combined pyrite weathering and calcite dissolution.
A greater sulfate concentration in the incoming freshwater would have produced an evolution path for zone III that would be rotated in a clockwise direction to end at a higher sulfate percentage in the anion triangle of fig. 76 and shifted towards a higher sulfate and chloride percentage in the diamond part of the diagram. These paths would fit the distribution of many points for water analyses in fig. 37 that have a greater sulfate percentage.
2-D Coupled Flow and Reaction Model
The 1-D numerical model demonstrates the effect of mixing and cation exchange on groundwater chemistry. Chemical data for groundwater samples from the Dakota aquifer show that the mixing process in the aquifer system is more complicated than simulated by the 1-D model (Chu, 1995). The chemical data imply that the past distribution of salinity in the Dakota aquifer was not uniform. In addition, the unevenly distributed intrusion of saltwater is continuing, as indicated by the saltwater zone above the subcrop of the Cedar Hills Sandstone. The area of zone II sodium-bicarbonate type water currently extends over a large area of the confined aquifer from southwest to central Kansas before entering the saltwater zone in central to north-central Kansas.
A 2-D profile model was designed to simulate complexities of the hydrogeological system of the Dakota aquifer in the chemical transition zone along the regional groundwater flow path that extends across Ellis and western Russell counties. The 2-D numerical model simulated the mixing of slightly saline groundwater in the confined Dakota aquifer flowing from the west, intruded saltwater from the Cedar Hills Sandstone, and fresh to slightly saline leakage from the overlying confining layer of Upper Cretaceous strata. The west end of the model started east of the middle of R. 19 W. along the line separating T. 13 and 14 S. in west-central Ellis County, and extended in an easterly direction across the Cedar Hills subcrop zone, curving in the last fourth of the flow path to the northeast to end at the Saline River valley along the line separating T. 12 and 13 S. west of the middle of R. 14 W. in northwestern Russell County (fig. 77). The conceptual geologic framework of the model (fig. 78) was constructed based on the hydrostratigraphy of the study area. The cross-section length is 48 km (30 mi).
Figure 77--Location of the flow path for the 2-D model on a map of major hydrogeologic zones of the Dakota aquifer in part of central and north-central Kansas.
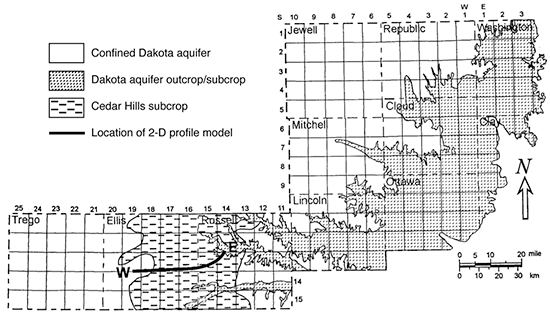
The model included six hydrogeological units: an alluvial aquifer (representing the Saline River valley), the upper Dakota aquifer (Dakota Formation), a lower Dakota aquifer (representing the Longford Member of the Kiowa Formation), a combined unit of Kiowa marine shale and Cheyenne Sandstone, a Permian aquitard, and the Cedar Hills Sandstone (fig. 78). The Saline River is at the edge of the alluvial aquifer at the east end of the model. The marine shale of the Kiowa Formation was lumped with the underlying Cheyenne Sandstone to reduce the model complexity. The dip, thickness, and subcrop zone of the Cedar Hills Sandstone was based on previous studies and test-hole logs. The model thickness ranged from 227 m (745 ft) at the west boundary to 102 m (335 ft) at the east boundary (fig. 78).
Figure 78--Hydrogeologic units and dimensions for the profile in the 2-D coupled flow and chemical reaction model.
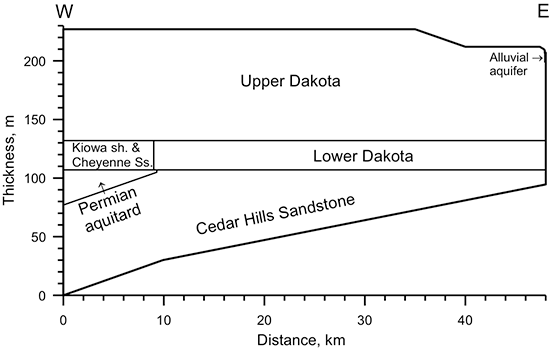
The finite element grid used in the 2-D simulation in the program HYDROGEOCHEM had 1,848 nodes and 1,700 quadrangular elements (fig. 79). The ranges in the horizontal and vertical distances between the nodes were 100-500 m (328-1,640 ft) and 2-15 m (6.6-49 ft), respectively. Constant heads were assigned to two sections of the west model boundary to represent the head difference between the confined Dakota aquifer and the underlying Permian strata (fig. 80). The model top was made a constant flux boundary with sections of different recharge rates, which represent the variation in the top leakage due to the thinning of the Upper Cretaceous confining layer from west to east. A constant flux was used for the model bottom boundary to indicate constant diffusion of underlying saltwater. The east boundary was located at the hydraulic divide under the Saline River. A constant head was assigned to the river-bottom nodes, which were the discharge location for the model. The boundary flow conditions are illustrated in fig. 80.
Figure 79--Finite element grid used in the 2-D coupled profile model.
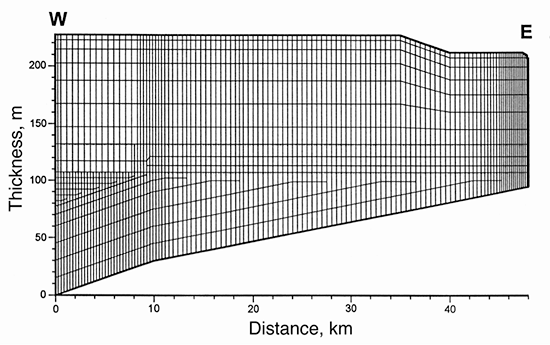
Figure 80--Hydrogeologic units and flow boundary conditions for the 2-D coupled profile model. Constant heads (H) were assigned to the west side boundary and river bottom nodes at the upper-right corner of the model. Constant fluxes were given to the top and bottom boundaries.
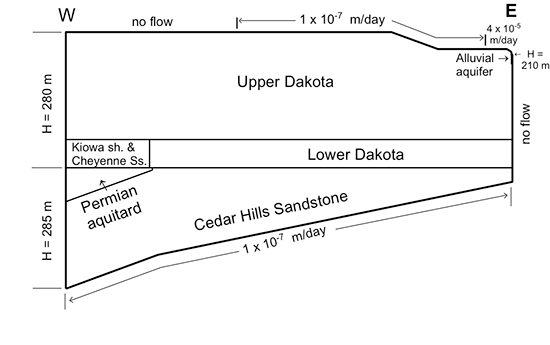
One set of hydrological parameters was associated with each of the hydrogeologic units in the model. The assumption of homogenous units was necessary to simplify the model to allow computation of the coupled flow and chemical reactions in a practicable manner. The homogenous hydrologic properties are effective averages for the actual heterogeneous strata of shales, siltstones, sandstones, and limestones in the system. Initial hydrologic parameters were assigned to each hydrogeologic unit based on values for previous numerical simulations (Macfarlane, 1995) and general characteristics of the strata, such as anisotropy in the hydraulic conductivity. Some of these parameters were then adjusted after analyses of the sensitivity of the model by steady-state conservative transport of chloride concentration in the groundwater. The sensitivity analyses included tests for the horizontal and vertical hydraulic conductivities, vertical dispersivity, the hydraulic head difference between the Dakota and Cedar Hills aquifers at the west boundary, and vertical recharge rates from the top and bottom boundaries. The final parameters were selected based on the aquifer properties and matching of the steady-state distribution of chloride concentration in the hydrogeologic units with that based on well water samples in the general area of the model profile (table 19).
Table 19--Geohydrological parameters for the hydrogeological units used in the 2-D profile model.
| Unit | Hydraulic conductivity (m/day) |
Dispersivity (m) | Diffusion coefficient (m2/day) |
Bulk density (g/cm3) |
CEC (meq/100g) |
Porosity | ||
|---|---|---|---|---|---|---|---|---|
| Kx | Kz | αl | αv | |||||
| Alluvial aquifer | 30 | 5 | 20 | 0.3 | 0 | 1.8 | 2.5 | 0.30 |
| Upper Dakota | 3 | 0.001 | 20 | 0.3 | 0 | 2.0 | 2.5 | 0.20 |
| Lower Dakota | 1 | 0.0005 | 15 | 0.2 | 0 | 2.1 | 5.4 | 0.18 |
| Kiowa shale & Cheyenne Sandstone |
1 | 1 x 10⁻⁵ | 10 | 3 x 10⁻³ | 5 x 10⁻⁷ | 2.2 | 20 | 0.15 |
| Upper Permian aquitard | 1 x 10⁻⁵ | 1 x 10⁻⁶ | 1 | 1 x 10⁻³ | 3 x 10⁻⁷ | 2.4 | 10 | 0.05 |
| Cedar Hills Sandstone | 1 | 0.05 | 15 | 0.2 | 0 | 2.2 | 3.0 | 0.15 |
| Kx and Kz are the horizontal and vertical hydraulic conductivities, respectively. αl and αv are the longitudinal and vertical dispersivities, respectively. |
||||||||
The chemistry of the pore water at the boundaries and in the different hydrogeologic units of the model was based on water samples (table 20). The top recharge was represented by calcium-sulfate, bicarbonate type water in the Greenhorn Limestone. It was assumed that the water chemistry would not change substantially after passing through the Graneros Shale. The water entering the west boundary of the confined Upper Dakota aquifer in the model was represented by a groundwater sample from eastern Trego County. The chemistry of saline water along the west boundary of the combined Kiowa shale and Cheyenne Sandstone was based on a sample from the Cheyenne Sandstone in central Ellis County. Saltwater along the west boundary of the Permian aquitard and the Cedar Hills Sandstone and along the bottom boundary of the Cedar Hills Sandstone was represented by a water sample from that Sandstone in southwest Russell County. The basic chemical components and the chemical reactions in the 2-D model were the same as in the 1-D model except that dissolution/precipitation of minerals included magnesite (MgCO3) as well as calcite.
Table 20--The groundwater chemistry used as the initial and boundary conditions in the 2-D profile model.
| Location | 7S-10W-08BBB | 14S-22W-21BCB | 12S-18W-30AA | 14S-14W-25BB |
|---|---|---|---|---|
| Geology | Greenhorn Limestone | Dakota Formation | Cheyenne Sandstone | Cedar Hills Sandstone |
| pH | 7.02 | 8.45 | 7.45 | 6.56 |
| Ca meq/L (mg/L) | 9.88 (198) | 0.210 (4.2) | 3.19 (64) | 39.4 (790) |
| Mg meq/L (mg/L) | 1.49 (18) | 0.182 (2.2) | 58.9 (716) | 94.3 (1,146) |
| Na meq/L (mg/L) | 5.00 (115) | 19.4 (446) | 448 (10,300) | 976 (22,440) |
| HCO3 meq/L (mg/L) | 4.88 (298) | 7.93 (484) | 17.5 (1,068) | 11.4 (696) |
| SO4 meq/L (mg/L) | 7.72 (371) | 4.00 (192) | 85.6 (4,110) | 128 (6,150) |
| Cl meq/L (mg/L) | 3.53 (125) | 5.70 (202) | 412 (14,600) | 970 (34,400) |
| TDS mg/L | 1,002 | 1,122 | 30,410 | 65,610 |
Steady-state flow for the 2-D model shows a nearly linear regional flow through the Dakota aquifer units and the Cedar Hills Sandstone in most of the model and upward, local flow to the discharge location of the Saline River valley (fig. 81). The flow lines from the Cedar Hills Sandstone enter the Lower Dakota aquifer in the subcrop zone. The flow lines also cross from the Lower to the Upper Dakota aquifer above the Cedar Hills Sandstone subcrop. The upward flow and dispersion of the saltwater transported from the Cedar Hills Sandstone generates saline water in the Lower and Upper Dakota east of the subcrop zone as indicated in the steady-state distribution of chloride concentration (fig. 82). However, dispersion also causes some of the slightly saline Dakota aquifer to slightly dilute the saltwater in the uppermost part of the Cedar Hills Sandstone. Leakage from the Upper Cretaceous strata in the eastern two-thirds of the model profile produces a relatively thin zone of slightly saline water along the top of the Upper Dakota aquifer above the Cedar Hills subcrop. The discharge of groundwater at the Saline River valley results in highly saline water at a relatively shallow depth.
Figure 81--Flow field for the steady-state simulation by the 2-D coupled profile model.
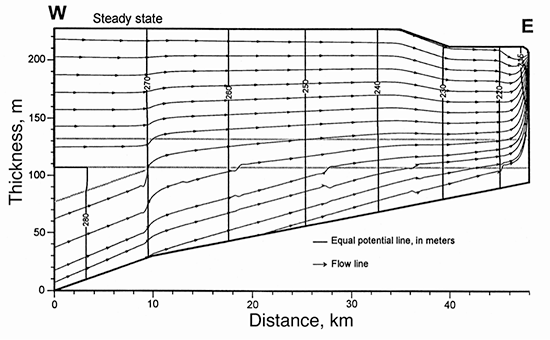
Figure 82--Distribution of dissolved chloride concentration for the steady-state simulation by the 2-D coupled profile model.
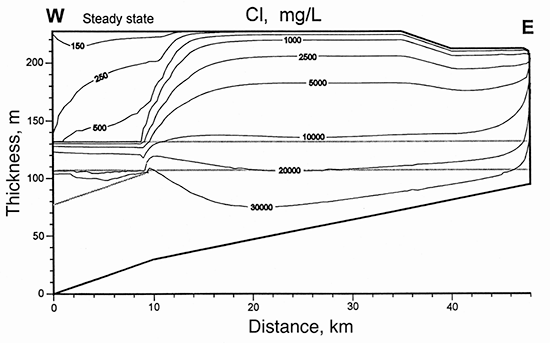
The time step used in the transient simulation increased from 1 to 100 years. The simulation required about 3,000 years for the flow entering the west boundary of the Upper Dakota aquifer to travel far enough to the east to produce the transition zone from relatively low to high chloride concentration above the start of the Cedar Hills Sandstone subcrop similar to that in the steady-state model. The water in the Upper Dakota aquifer entering the west boundary of the model was already affected by cation exchange. Thus, no substantial change occurs in the water chemistry due to cation exchange reactions as in the transition from zone II to zone III in the 1-D model. Figure 83 displays the dissolved calcium concentration in the 2-D coupled flow and reaction model for the 3,000-year simulation. Although no leakage exists from the top of the western third of the model, the constant chemistry conditions along the top boundary and the slow lateral movement of the regional flow result in a zone of calcium content greater than in the incoming Upper Dakota aquifer water in the uppermost part of the Upper Dakota to the west of the Cedar Hills subcrop. East of the subcrop, the calcium concentration within most of the Upper Dakota aquifer remains within a relatively small range from about 200 mg/L to less than 400 mg/L.
Figure 83--Distribution of dissolved calcium concentration for a 3,000-year simulation by the 2-D coupled profile model.
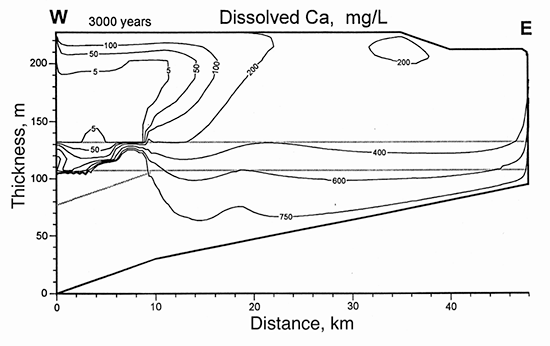
The mixing and cation exchange that occur within the 2-D model produce conditions in which a small amount of calcite can be dissolved throughout most of the Upper and Lower Dakota aquifers east of the Cedar Hills Sandstone subcrop (fig. 84). The starting calcite content in the model was 30,000 mg per volume containing 1 L of pore water. For a porosity of about 0.2, the calcite content is approximately equivalent to 0.3% by weight of dry aquifer mass. A zone of greater calcite dissolution occurs along the top of the Upper Dakota aquifer east of the Cedar Hills subcrop. These results could explain why parts of the Dakota aquifer are commonly not cemented by carbonate minerals. Calcite dissolution could have increased the permeability of parts of the Dakota aquifer.
Figure 84--Calcite dissolution for a 3,000-year simulation by the 2-D coupled profile model. The initial calcite concentration was 30,000 mg per volume containing 1 L of pore water in the hydrogeologic units (equivalent to about 0.3% by weight of dry rock). Values less than 30,000 represent calcite dissolution.
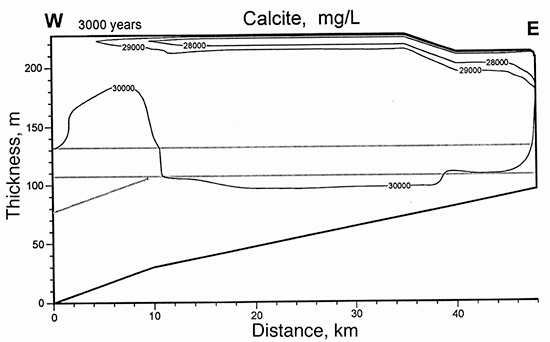
The sensitivity of the water chemistry to vertical leakage from above and the distribution of the zone of most calcite dissolution near the top of the Upper Dakota aquifer in the 2-D model indicate the importance of a small amount of recharge through the strata overlying the confined Dakota aquifer. Thus, the increase in the amount of vertical recharge along the transition from thick confining strata in the regional flow system of the aquifer to a thinner confining layer approaching the Dakota outcrop zone helps explain the substantial chemical changes observed along the transition from the regional to local flow system.
Summary and Conclusions
During the Dakota Aquifer Program, the KGS assembled existing water chemistry data for the Dakota aquifer from several different sources and reviewed the data for errors and uncertainties. The KGS also added substantial amounts of new data by sampling and analysis of groundwaters from observation and supply wells across the aquifer. The data are for chemical properties and concentrations of inorganic constituents and are in online Excel spreadsheets on the KGS website. The data base includes 1,594 chemical records for wells yielding water entirely or partly from the Dakota aquifer. The records represent 1,192 sampling locations, of which 1,123 well locations are for only the Dakota aquifer. TDS concentration was estimated from 977 geophysical logs in northwest Kansas to supplement the chemical analyses in the region where essentially no water-supply wells exist due to the high salinity of the groundwater in the Dakota aquifer. TDS values of Dakota groundwaters, as well as concentrations of sodium, chloride, and sulfate for waters with more than a few thousand mg/L TDS, can be estimated well from a specific conductance measurement of a water sample.
The TDS content and chemical character of groundwater in the Dakota aquifer range substantially in both spatial and vertical dimensions across Kansas. The TDS concentration is as low as 100 mg/L in shallow groundwater in the Dakota aquifer and exceeds 50,000 mg/L in saltwater sampled from the confined aquifer in parts of north-central Kansas. Freshwaters in the outcrop and subcrop areas of the Dakota aquifer in Kansas, in parts of the confined aquifer in Kansas where the confining beds are thin, and in portions of the recharge area of southeast Colorado are usually of calcium-bicarbonate type. Sodium-bicarbonate type water is common in the confined aquifer and along the transition zone from the confined to unconfined aquifer. Calcium-sulfate type water occurs in some locations in both the unconfined and confined aquifer. Waters of a composition transitional among these types are also common, such as mixed cation-bicarbonate type (usually in the unconfined aquifer) and sodium-mixed anion type (typically in the confined aquifer). The transitional water types have a greater TDS concentration than that of calcium-bicarbonate type water. Large areas of the Dakota aquifer contain saltwater (sodium-chloride type). The saltwater occurs within the entire thickness of the confined Dakota aquifer in parts of central and north-central Kansas overlying the Cedar Hills Sandstone and in the confined aquifer in northwest Kansas. Elsewhere in most of the confined and parts of the unconfined aquifer, fresh to slightly saline water exists in the upper part of the aquifer and the salinity increases substantially with depth, especially below major shale units.
The flushing of saltwater from the Dakota aquifer by vertical and lateral recharge is the main process leading to the diversity in chemical character of groundwaters. Data for the chemical nature of the water, mineralogy of the sediments, and hydrogeologic properties of the aquifer, together with numerical modeling of coupled hydrologic and geochemical processes, provide an understanding of the evolution of water quality in the aquifer. The origin of the saltwater in the aquifer is interpreted as the intrusion of saltwater from underlying Permian strata in which evaporite deposits (mainly rock salt) have been dissolved. Bromide/chloride ratios indicate that little seawater remains in the Dakota aquifer even though most of the Dakota sediments probably contained seawater either during their deposition or after deposition when the sea covered Dakota formations. The seawater has apparently been flushed and replaced by fresh recharge, intruding Permian saltwater, or a mixture of these two.
The rate of vertical and lateral freshwater recharge relative to the rate of Permian saltwater intrusion controls the overall salinity of groundwater in the Dakota aquifer. The inflow of fresh recharge is too small to flush the saltwater in the region of thick confining beds in northwest Kansas, in the area where the rate of saltwater intrusion from the Cedar Hills Sandstone is large, and elsewhere within the aquifer where it contains saltwater below thick confining beds. The varying rates of local and regional flow of freshwater recharge cause a range in groundwater salinities in lateral and vertical directions by mixing with and diluting the saltwater. The dilution mixing affects the water chemistry faster than cation exchange because the clays in the sediment contain a large cation exchange capacity.
Large amounts of sodium adsorbed on clays in Dakota strata while the pore waters in the sediments contained saltwater (sodium-chloride type water). During the inflow of freshwater recharge of calcium-bicarbonate type, which usually also contains a relatively significant magnesium concentration, the dissolved calcium and magnesium exchange for sodium on the clays. This increases the dissolved sodium content above that resulting from the conservative mixing of the freshwater and saltwater, while decreasing the calcium and magnesium concentrations in the pore water, often to the point where the water becomes undersaturated with respect to calcite and dolomite. Where these carbonate minerals are present in the aquifer, they can dissolve, leading to increases in dissolved calcium and magnesium that can then drive further cation exchange. The carbonate mineral dissolution increases the bicarbonate concentration and the pH of the water. This process generates sodium-bicarbonate type groundwater. The composition of the recharge water and the different adsorption affinities of calcium and magnesium relative to sodium result in bicarbonate waters with differing ratios of dissolved cations and anions. The large exchange capacity of the clays means that it takes much longer for the cation and bicarbonate chemistry of the water in the aquifer to become similar to that of the inflowing recharge than the flushing of the salinity.
The low dissolved calcium concentration that results from the cation exchange process not only results in dissolution of calcite but also of calcium-containing minerals that include fluoride, such as fluorite and fluorapatite. This can increase the dissolved fluoride concentration in the Dakota aquifer to more than 2 mg/L. Most of the high-fluoride water is present in the confined aquifer where the water type is sodium-bicarbonate.
Iron sulfide minerals (primarily pyrite) occur in shales in the Dakota aquifer and overlying upper Cretaceous shales. Recharge water containing dissolved oxygen can oxidize the sulfide minerals and increase the sulfate concentration of pore waters. The oxidation of sulfide minerals also increases the dissolved iron content of the pore water. Oxidation and hydrolysis of the dissolved iron to ferric oxyhydroxides decreases the pore water pH and produces the orange to red coloring often present in Dakota sands and silts. The lower pH can dissolve carbonate minerals. Recharge water containing a substantial calcium content from the dissolution of calcite or dolomite can combine with the high sulfate from pyrite oxidation to precipitate secondary gypsum in upper Cretaceous shale, such as has occurred in the Graneros Shale overlying the Dakota Formation. The dissolution of this gypsum by later recharge and the entrance of this recharge into underlying Dakota strata can increase the sulfate content of the aquifer groundwater. Pyrite weathering and dissolution of calcium carbonate minerals in Dakota strata or the entrance of recharge water that had dissolved gypsum in overlying shale can produce calcium-sulfate type water in either the unconfined or confined Dakota aquifer. This groundwater usually contains a TDS concentration that is greater than that for calcium-bicarbonate type water.
Contaminants in recharge from or near the land surface or introduced through poorly constructed wells can further change the chemical characteristics of Dakota groundwater by introducing additional substances or increasing the concentration of existing constituents. The main inorganic constituent affected by this type of contamination is nitrate. Past injection of oil brine into saltwater-containing strata of the Dakota aquifer has altered the composition of the saltwater in only limited areas.
The processes of conservative mixing, reactive cation exchange, and mineral dissolution and precipitation produce a complex range of chemical characteristics for the groundwater in the Dakota aquifer due to the differing rates of flow and dispersion of the end-member freshwaters and saltwaters and of diffusion of dissolved constituents, coupled with the differing freshwater and saltwater composition and sediment mineralogy. The multidisciplinary approach of the Dakota Aquifer Program provided the information for understanding how these processes affected the origin and evolution of the current water quality of the aquifer. These processes also control the concentrations of other constituents such as heavy metals.
Prev Page--Groundwater Geochemistry, start || Next Page--References
Kansas Geological Survey, Geohydrology
Placed on web Feb. 6, 2015.
Comments to webadmin@kgs.ku.edu
The URL for this page is http://www.kgs.ku.edu/Publications/Bulletins/260/app_chem2.html