Previous--Report Start || Next--Water Chemistry and Sustainable Yield
This article available as an Acrobat PDF file (577 kb).
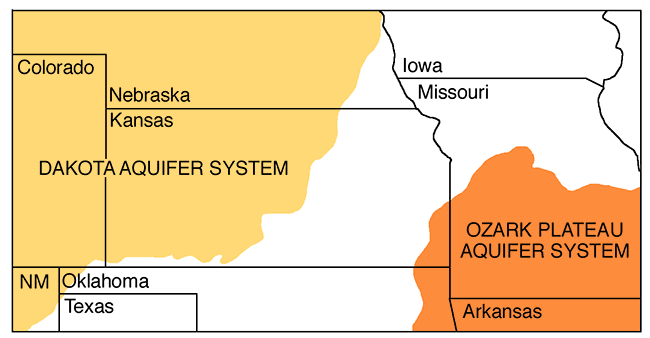
Unlike shallow unconfined aquifers, which are bounded only by a low-permeability layer below, a confined aquifer is bounded by two low-permeability layers. The confined aquifers that are major sources of water in Kansas are the Dakota and the Ozark Plateau aquifer systems (fig. 4.1). Other confined aquifer systems that are minor sources of ground water are the sandstone aquifers in the Pennsylvanian Douglas Group in northeastern Kansas and the karstified limestones of the Permian Barneston Limestone. Confined to semi-confined conditions also exist locally in the more clayey parts of the High Plains aquifer. Management of these confined systems has not been aggressively pursued because, until recently, they have been poorly understood. However, as the shallower sources of water have become increasingly unable to meet existing demands, interest in these deeper aquifer systems as replacement or supplemental sources has increased. More stringent and informed management policies need to be formulated now to ensure the continued availability of water supplies from these confined systems.
Figure 4.1--Extent of the Ozark Plateau and Dakota aquifer systems in Kansas and adjacent states.
These newer proactive policies will most certainly rely on an assessment of aquifer sustainability. The policies formulated by planners and managers to achieve sustainability will depend on the planning horizon (i.e. the length of time into the future covered by a management plan) selected, the goals for managing the water resource, and the hydrogeology of these confined systems. For example, Walton (1964) recognized the limited nature of water supplies in confined aquifer systems. He defined the long-term practical sustained yield for the confined Cambrian-Ordovician aquifer in northeastern Illinois as the total withdrawal rate that could be maintained without completely depleting the aquifer. The goal of this chapter is to evaluate the viability of applying sustainability concepts to the management of confined-aquifer systems in Kansas. In this chapter, the achievement of sustainability is defined using Walton's criteria of nondepletion. This evaluation will be done by reviewing aspects of confined-aquifer hydrology that have a bearing on the concept. Examples from the Dakota and the Ozark plateaus aquifer systems will be used to illustrate the key points in this chapter. It is assumed that the other minor aquifer systems behave in a manner similar to the major confined systems.
The issues surrounding the sustainability of water resources in confined systems are complex and involve both the quantity and the quality of ground water. These systems will not respond to development in the same manner as unconfined systems because of differences in the sources and amounts of recharge and differences in the mechanisms by which ground water is released to pumping wells. Because of their greater average depth below surface, these confined systems are more likely to contain or be hydraulically connected to other aquifers that contain unusable ground water. As a result, water quality can be a very important consideration in determining the amount of water that can be withdrawn.
In many instances we have a good understanding of the regional flow systems in these confined aquifers; that understanding can not be directly translated to the well-field scale because of uncertainty. The geologic units that constitute the framework of these confined aquifers were deposited in a complex mosaic of depositional environments that range across the marine to nonmarine continuum. The nature of transitions within and between adjacent environments is often reflected in the variability of the deposited sediments. Hence, the composition, distribution, and hydrologic properties of these sediments are initially highly variable. Lithification and chemical reactions with enclosed pore waters over geologic time may further enhance the permeability and porosity contrasts between adjacent rock units. As a result, distribution of porosity and permeability within a sedimentary rock sequence mayor may not coincide with formational boundaries. The resulting high degree of heterogeneity in these deposits is a major influence on the hydraulic connection between aquifer systems and the flow of ground water to pumping wells.
Another problem for the development of suitable management policies for confined aquifers is the difficulty of conceptualization. Our understanding of the hydrology of unconfined ground-water systems is more easily pursued on an intuitive level than is the case for confined systems. For example, a saturated thickness can be easily visualized and related to the total amount of water in an unconfined aquifer. Large-scale withdrawals eventually produce water-level declines in the aquifer, and the volume of water removed is not that much different from the change in saturated thickness integrated over the affected area under some circumstances. However, under confined conditions pumping generally does not dewater the aquifer adjacent to the well because the water level remains above the aquifer top. Many planners and managers have a poor grasp of the fundamental differences in the hydrologic mechanisms of water production between unconfined and confined systems.
The analysis of regional ground-water flow in large sedimentary basins requires an understanding of the geologic framework through which fluids flow. The total thickness of sedimentary rocks above the Precambrian varies considerably across Kansas and adjacent areas of the plains ranging from less than 2,000 ft (600 m) in southeastern Kansas and southeastern Colorado to almost 7,000 ft (2,100 m) in southwestern Kansas. The sedimentary rock units above the Precambrian range in age from Cambrian through Quaternary and consist of both consolidated and unconsolidated deposits that were deposited in a variety of marine and nonmarine environments (table 4.1, fig. 4.2). Periodic episodes of deposition, uplift, and erosion over geologic time and local variations in the rates of these processes are largely responsible for the observed variation in thickness of sedimentary strata across the state, their hydrologic properties, and chemical quality of their contained porewaters.
Table 4.1--Stratigraphy and hydrostratigraphy of the Kansas subsurface above the Precambrian, showing the major aquifer and aquitard (confining units). Modified from Macfarlane (1993) and Jorgensen et al. (1993).
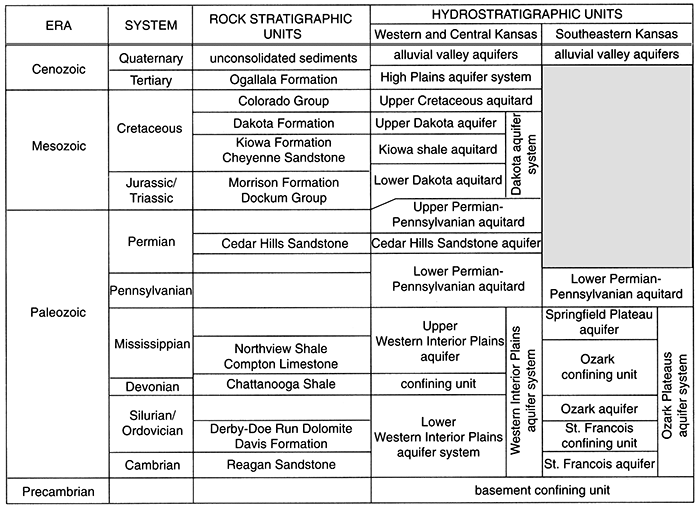
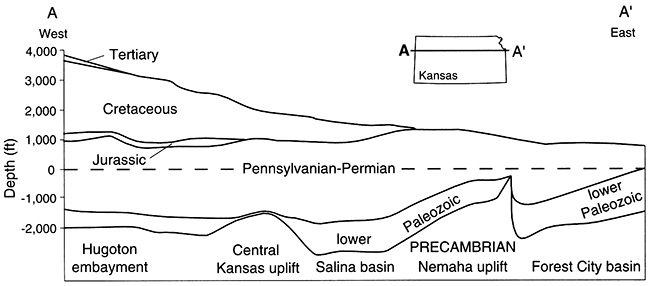
Figure 4.2--Generalized west to east cross section from the Kansas-Colorado border to the Kansas-Missouri border approximately along I-70 Showing the major subsurface geology features of Kansas. Modified from Merriam (1963).
In a heterogeneous sedimentary basin, the spatial variability of hydraulic conductivity can vary over a range of 11 orders of magnitude or more (Macfarlane, 1993). To better understand ground-water now through such a highly variable geologic framework, it is convenient to delineate hydrostratigraphic units. A hydrostratigraphic unit can be defined as a part of a body of rock that forms a distinct hydrologic unit with respect to the flow of ground water (Maxey, 1964). In a review of the concept, Seaber (1988) redefined the term as "a body of rock distinguished and characterized by its porosity and permeability." Delineation of these units subdivides the geologic framework into aquifer and aquitard units and thus aids in definition of the flow system across all spatial scales. Fetter (1994) regards a hydrostratigraphic unit with a hydraulic conductivity (K) of greater than about 0.2 ft/day (0.06 m/day) as an aquifer. Table 4.1 shows the generalized subsurface stratigraphy of Kansas subdivided into regional aquifer and aquitard units. In the midcontinent, including Kansas, the regional aquitard units are at least three orders of magnitude less permeable than the regional aquifers (Macfarlane et al., 1992). Figure 4.1 shows the extent of the Dakota and the Ozark Plateaus aquifer systems in Kansas and adjacent areas.
In general, the criteria for delineating aquifer and aquitard units depend on the spatial and temporal scales under consideration. Hydrostratigraphic units defined at one scale may have little bearing on ground-water flow at another scale if the units are spatially highly heterogeneous. For example, some units might be considered aquifers at the regional scale and at the scale of geologic time; however, the same units may be considered aquitards or aquicludes at the more local and shorter time scales associated with a pumping test on a production well. Likewise, local aquifer units contained within a thick regional aquitard may have very little bearing on the regional flow of ground water across the aquitard. Furthermore, units that are considered hydraulically continuous regionally may, at smaller spatial and time scales, become discontinuous. For example, to analyze a basin-wide problem, it may be sufficient to identify the upper and lower Dakota aquifers. However at the well-field scale, it may be necessary to identify the extent of individual sandstone bodies that form the local aquifer units and the enclosing mudstones within these geologic units that form the local aquitard units. For the local problem, the geometry and hydraulic continuity of the sandstones as well as their hydrologic properties determine the nature of the aquifer units (Macfarlane et al., 1994).
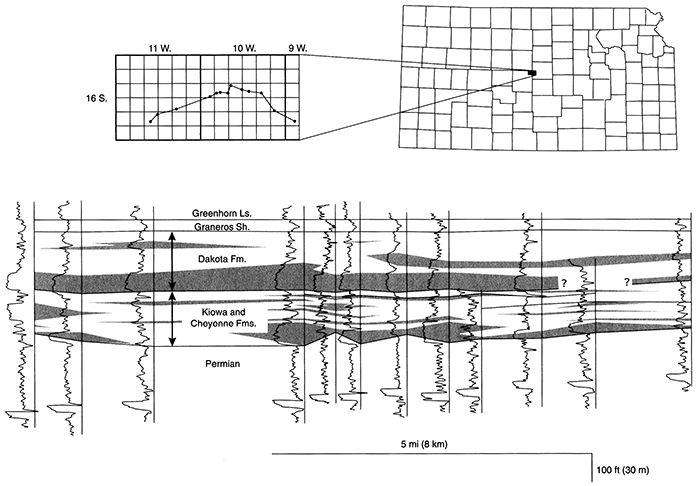
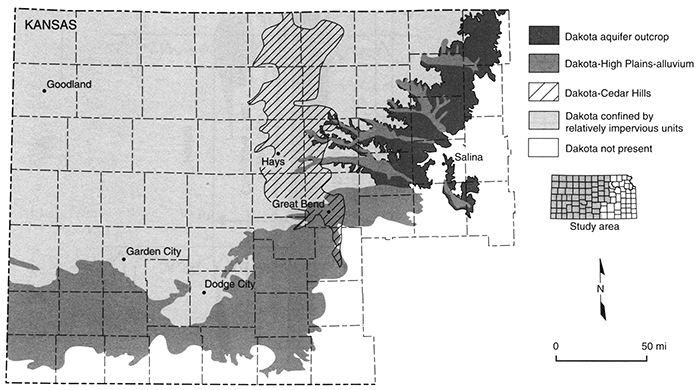
The geologic units that form the Dakota aquifer in Kansas are the Cretaceous Dakota Formation, the Kiowa Formation, and the Cheyenne Sandstone (table 4.1). The combined thickness of these units can range up to more than 700 ft (214 m) in west-central parts of the state. However, not all of the units that constitute the Dakota contain aquifer-grade material that can yield water to wells. The amount of sandstone, considered to be the aquifer material, varies from less than 10% to more than 50% of the total thickness, even over very short lateral distances. Statewide, the average proportion of sandstone is approximately 30% of the entire thickness. The sandstones occur as irregular, discontinuous bodies within relatively impervious shaly strata and generally occur in several, more or less distinct zones within these geologic units. These ribbonlike, irregular bodies of sandstone were deposited during the early part of the Cretaceous Period (approximately 90-100 million years ago) in river valleys crossing a coastal plain and in coastal environments along the eastern shoreline of the Western Interior sea. Figure 4.3 is a schematic cross section of the Dakota aquifer framework from geophysical logs. Typically, these sandstone bodies range in length up to 20 miles (32 km), in width up to 1.5 miles (2.4 km), and in thickness up to more than 100 ft (30 m). With some exceptions, they tend to be oriented primarily in an east-west direction, parallel to the direction of the ancient drainage. The most permeable part of the aquifer is generally in the river-deposited sandstones in the Dakota Formation and the Cheyenne Sandstone.
Figure 4.3--Cross section constructed from gamma-ray logs of oil wells in a small area of central Kansas. Deflections of the gamma-ray curves to the right indicate shaly strata. Deflections to the left indicate sandstone, limestone, or dolomite. The shading shows the interpreted distribution of sandstone beds as in the Dakota, Kiowa, and Cheyenne formations.
The Dakota aquifer system is the most geographically extensive of all the aquifer systems in the upper 2,000 ft (610 m) of the subsurface of western and central Kansas (table 4.1, figs. 4.1 and 4.2). The upper Dakota aquifer consists of sandstones in the Dakota Formation and the upper part of the Kiowa Formation. The lower Dakota aquifer consists of the Cheyenne Sandstone and the sandy lower part of the Kiowa Formation. Over most of western Kansas these two aquifers are separated by a marine shale unit of the Kiowa Formation. Elsewhere, both the regional upper and lower Dakota aquifers are hydraulically connected.
Over most of its extent, the Dakota aquifer is confined by younger Cretaceous chalks and shales that form the Upper Cretaceous aquitard (table 4.1, fig. 4.4). The total thickness of the aquitard generally increases to the west and north of the outcrop/subcrop belt up to more than 2,000 ft (610 m) in northwestern Kansas. In most of southwest and most of south-central Kansas, the Upper Cretaceous aquitard has been eroded and the upper and lower Dakota aquifers subcrop beneath and are in hydraulic connection with the High Plains aquifer. In the river valleys of the central part of the state, the Dakota aquifer is hydraulically connected to the alluvial deposits, which form the alluvial-valley aquifers. Westward-dipping Jurassic and Permian rocks directly underlie the Dakota aquifer in Kansas (Hamilton, 1994). In extreme southwestern Kansas, sandstone aquifers in the Morrison Formation and Dockum Group are considered aquifers that are hydraulically connected to the overlying lower Dakota (Kume and Spinazola, 1985). Consequently, the Morrison-Dockum aquifer is here considered to be part of the lower Dakota aquifer (table 4.1). Elsewhere, the Morrison Formation is not known to be sandy or yield water to wells. Therefore, it is considered to be a part of the Permian-Pennsylvanian aquitard. Permian rocks beneath the Dakota aquifer consist of shale, siltstone, sandstone, and bedded salt with minor amounts of limestone and dolomite. In Kansas, they generally form the upper part of thick regional aquitard composed of Pennsylvanian and Permian units. Within this aquitard is the Cedar Hills Sandstone aquifer. In central Kansas, the Permian Cedar Hills Sandstone directly underlies and is hydraulically connected to the lower Dakota aquifer (fig. 4.3).
Figure 4.4--Extent of the confined and unconfined Dakota aquifer in Kansas showing areas of hydraulic connection with other aquifer systems.
In Kansas and Missouri this aquifer system consists of karstified and fractured carbonate rock units of Upper Cambrian, Lower Ordovician, and Mississippian age (Jorgensen et al., 1993; Macfarlane and Hathaway, 1987). This regional aquifer system is confined above by a sequence of shales and limestones that forms the Permian-Pennsylvanian aquitard (table 4.1). Below, the aquifer is confined by rocks of Precambrian age. In southeastern Kansas and adjacent parts of Missouri, the Ozark confining unit has been thinned or completely removed by erosion. In most cases, the Ozark aquifer is the only ground-water source used for water supply in southeast Kansas.
The Western Interior Plains aquifer system in table 4.1 consists of karstified and fractured carbonate rock units of Upper Cambrian, Lower Ordovician, Silurian, and Mississippian age to the west of the Ozark Plateau aquifer system in Missouri, Kansas, and Oklahoma (Jorgensen et al., 1993). The Ozark Plateau aquifer system contains fresh and usable ground water and the Western Interior Plains aquifer system contains brackish to unusable brines. The boundary between these two aquifer systems is the 2,500 mg/L isochlor line that cuts across southeast Kansas from Missouri into Oklahoma (fig. 4.1). This isochlor coincides approximately with the hydrologic boundary separating the shallow, freshwater flow system in the Ozark region of Missouri, Arkansas, and northeastern Oklahoma from the deep, regional saltwater-flow system in Kansas and Oklahoma.
Without exception, ground water is constantly moving from points of recharge where it enters the subsurface hydrologic system to points of discharge where it exits back to the surface. Some of the water only travels a short distance through the shallow subsurface from local recharge to local discharge areas. However, some of the water travels a much longer distance from regional recharge to discharge areas through the deeper subsurface. To define the pattern of moving ground water in a flow system, hydrogeologists use measurements of water-level elevation taken in wells scattered throughout the aquifer system. In most cases, the water-level elevation above mean sea level in a well is equal to the hydraulic head in the region of the aquifer adjacent to the well screen. The movement of ground water through the aquifer pores involves a loss of energy and the effect is comparable to the flow of water in river systems. Water naturally flows downhill from elevated regions of the continent (higher hydraulic head) to the sea (lower hydraulic head). In much the same way ground water moves from points of higher hydraulic head to points of lower hydraulic head in a flow system. In a confined aquifer, the hydraulic head is above the top of the aquifer whereas in an unconfined or water-table aquifer, the water table defines the top of the aquifer.
In the central Great Plains region of eastern Colorado and Kansas, the ground-water flow system in the confined Dakota aquifer is influenced primarily by regional and local topography and the Upper Cretaceous aquitard (Macfarlane, 1995). Hydrogeologists have long observed that the water table or the top of the saturated zone mimics the topography of the land surface. The land surface of this region slopes generally to the east and decreases in elevation from 5,000 ft (1,524 m) or more in eastern Colorado to 1,400 ft (427 m) or less in central Kansas (figs. 4.5 and 4.6). This results in an easterly flow of ground water across the region in all of the aquifer systems.
Figure 4.5--Flow directions in the regional flow system in the confined Dakota aquifer from the regional recharge to the regional discharge area. The trace of the vertical cross section A-A' shown in fig. 4.6 is indicated on this figure.
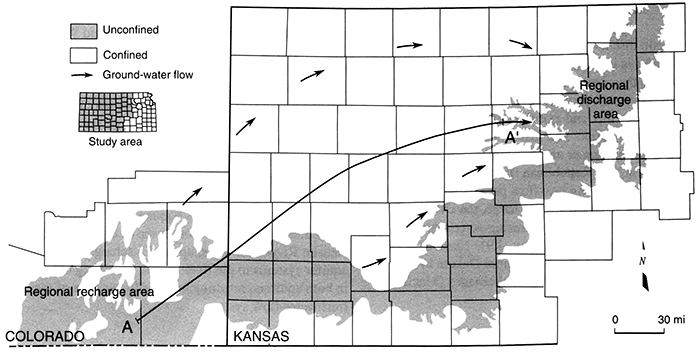
Figure 4.6--A conceptual model of ground-water flow through the confined Dakota aquifer from the regional recharge area in southeastern Colorado to the regional discharge area of central Kansas. Most of the recharge to the Dakota aquifer is routed back to the surface by local flow systems in central Kansas and southeastern Colorado.
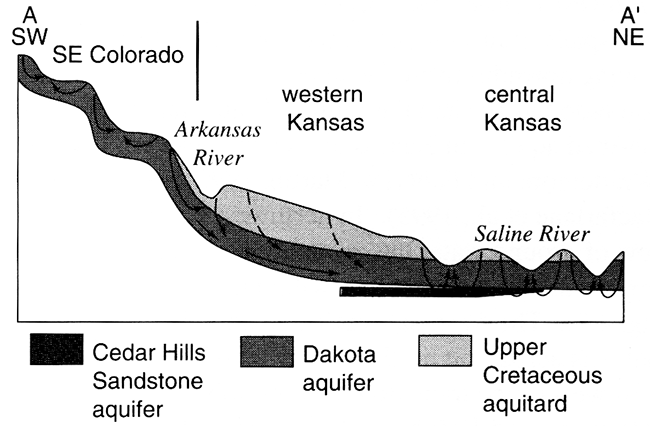
Due to its great thickness and extremely low permeability in the Denver basin of eastern Colorado, the Upper Cretaceous aquitard hydrologically isolates the flow system in the Dakota from the overlying water table. The Upper Cretaceous aquitard is more than 2,000 ft (610 m) thick in northwest Kansas and thins toward its eastern and southern extent in central and southwestern Kansas. As a result, its control on the flow system in the Dakota aquifer diminishes toward the outcrop/subcrop belt. Within the last 10 million years, differential uplift and intense local dissection of the High Plains surface have created considerable local and regional topographic relief. Incisement is a common feature of the drainage in the Arkansas River basin in southeastern Colorado, and southern Kansas and the Smoky Hill, Saline, and Solomon river systems in north-central Kansas. Many of these river systems have cut down through the aquitard and into the geologic units that constitute the Dakota aquifer system. Consequently, the hydraulic-head difference between the Dakota and the overlying water table is less than 1,000 ft (305 m) in most of western and central Kansas and southeastern Colorado where the confined aquifer is relatively shallow. Here, local topographic relief is an important influence on ground-water flow in the Dakota aquifer.
The regional recharge area for the confined Dakota aquifer system is in the topographically elevated region of southeastern Colorado, south of the Arkansas River (figs. 4.5 and 4.6). Within this part of Colorado, Cenozoic uplift of the High Plains region and erosion by the Arkansas River and its tributaries removed most the Upper Cretaceous aquitard leaving the Dakota aquifer at the surface. The total recharge from precipitation depends on the downward movement of water below the root zone to the water table or seepage into exposed bedrock outcrops. Within this recharge area a part of the Dakota aquifer underlies and is hydraulically connected to the High Plains aquifer. The total amount of seepage downward into the Dakota from the High Plains depends on the hydraulic connection between the two aquifers and the hydraulic-head gradient. In fig. 4.5, most of the recharge is intercepted by local flow systems that discharge back to the surface drainage in the recharge area (Macfarlane, 1995). These local flow systems are shallow and have short flowpath lengths. Consequently, the age of ground water in this part of the system is generally less than 10,000 years (Macfarlane et al., 1995).
North of the Arkansas River and within the confined aquifer, ground water moves slowly northeastward towards the regional discharge area in central Kansas due to low aquifer transmissivity (Macfarlane, 1993). Over most of western Kansas, the vertical hydraulic conductivity of the overlying Upper Cretaceous aquitard is very low, on the order of 1 x 10⁻⁷ ft/day (3 x 1O-8m/day) or less (Macfarlane, 1993; Belitz and Bredehoeft, 1988). Freshwater recharge to the confined Dakota is negligible, less than 0.1% of the lateral flow within the aquifer. Most of the freshwater recharge to the confined Dakota enters where the aquitard is relatively thin and dissected near the outcrop/subcrop areas. Here, the vertical hydraulic conductivity is two to three orders of magnitude higher and recharge from overlying sources may amount to as much as 10% of the lateral flow within the aquifer (Smith and Macfarlane, 1994; Smith, 1995). In central Kansas, an additional source of recharge to the Dakota comes from the underlying Permian Cedar Hills Sandstone aquifer where both aquifers are hydraulically connected (fig. 4.6). The total recharge from this source amounts to less than 1% of the lateral flow in the upper Dakota aquifer.
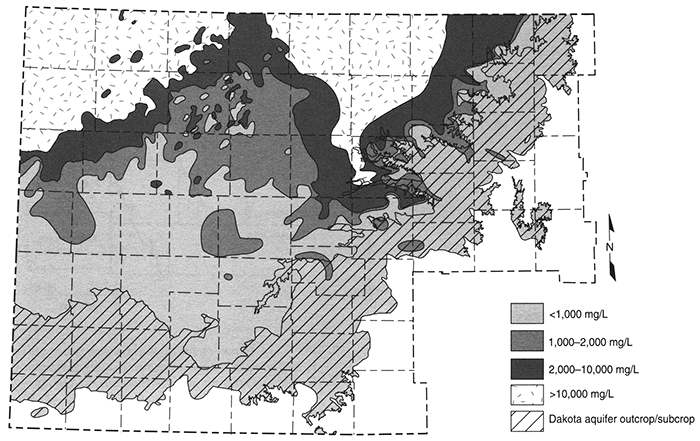
Because of the low flow rates in the confined Dakota, variable rates of recharge from overlying sources, and the range in flow-path lengths, the age of ground water ranges from 10's to 100's of thousands of years nearer the outcrop/subcrop belt and may exceed a million years in far northwest Kansas (Macfarlane et al., 1995). Acting over time spans of millions of years, the cumulative flow moving downdip from the recharge area in southeastern Colorado has flushed the salinity from a large part of the confined aquifer in Kansas and in southeastern Colorado (Whittemore and Fabryka-Martin, 1992; Smith, 1995; Macfarlane et al., 1995). In northwest Kansas, the lateral flow of ground water has probably not been sufficient to remove the remnant salinity within the confined aquifer (fig. 4.7). The fresh-saltwater transition is a narrow band that cuts across the northwest comer of the state. To the northwest of the transition, total dissolved solids concentrations exceed 10,000 mg/L. In central Kansas, the total dissolved solids concentrations of the brines moving upward from the Cedar Hills Sandstone exceed 20,000 mg/L (figs. 4.6 and 4.7). Freshwater recharge from overlying sources has been insufficient to depress the fresh-saltwater interface much below the top of the upper Dakota aquifer (Smith, 1995). In this part of the state all of the Dakota aquifer is unusable, except perhaps for the uppermost part (fig. 4.7).
Figure 4.7--Distribution of total dissolved solids (tds) concentrations in ground waters in the upper Dakota aquifer in western and central Kansas. Waters less than 1,000 mg/L TDS are defined as fresh. Water with 1,000-2,000 mg/L TDS is usable for many purposes but is less desirable than freshwater. A concentration of 10,000 mg/L TDS is defined in the State regulations of the Kansas Corporation Commission as the upper limit of usable water; above 10,000 mg/L, a water is classified as unusable or mineralized.
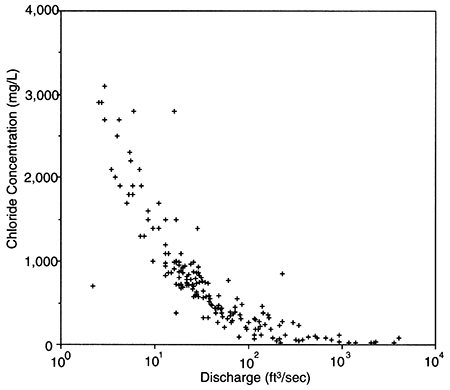
The main discharge area for flow from the confined Dakota aquifer is in the river valley systems in central Kansas where they cross the outcrop region (Macfarlane, 1993). In this part of the state, the flow from the regional and local systems mix and exit through fresh and saline water springs and seeps. Salt marshes associated with discharge to surface water are common features in the Saline, Solomon, and Republican river valleys of central Kansas (fig. 4.8). During low-flow periods when baseflow constitutes the bulk of stream discharge, the chloride concentration escalates rapidly causing deterioration of surface-water chemical quality (fig. 4.9). Elsewhere, the freshwater is discharged from the upper Dakota to the Arkansas, Pawnee, and Wet Walnut drainages (Macfarlane and Smith, 1994).
Figure 4.8--Distribution of salt marshes, salt seeps, and salt-affected reaches of streams in central Kansas.
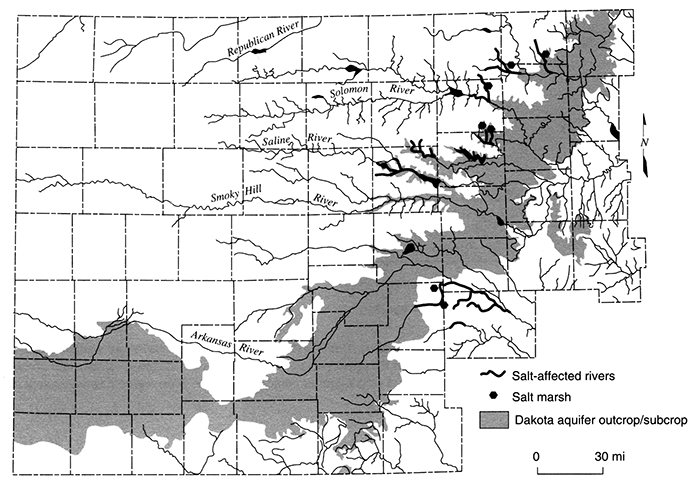
Figure 4.9--Stream discharge vs. chloride concentration at the Saline River gaging station north of Russell, Kansas, for the period 1966-1975.
The regional recharge area for the Ozark Plateau aquifer system is in the topographically elevated Ozark region of southern Missouri (Macfarlane and Hathaway, 1987; Jorgensen et al., 1993; fig. 4.1). In this region, the outcrop area roughly coincides with the central part of the Ozark uplift. The recharge area for the Ozark Plateau aquifer system (see table 4.1) in Kansas is located nearer the crest of the uplift south of Springfield, Missouri. Where the Ozark aquifer crops out, recharge is from precipitation that has infiltrated below the root zone, seepage into outcrops, solution channels, and fractures. Elsewhere in the recharge area, seepage across the Ozark confining unit (see table 4.1) provides additional recharge to Ozark aquifer. As in the case of the Dakota, not all of the recharge that enters the aquifer system in its recharge area becomes regional flow in the confined aquifer. Jorgensen et al. (1996) estimate that slightly more than half of the infiltrated precipitation in the recharge area is discharged from local flow systems to streams.
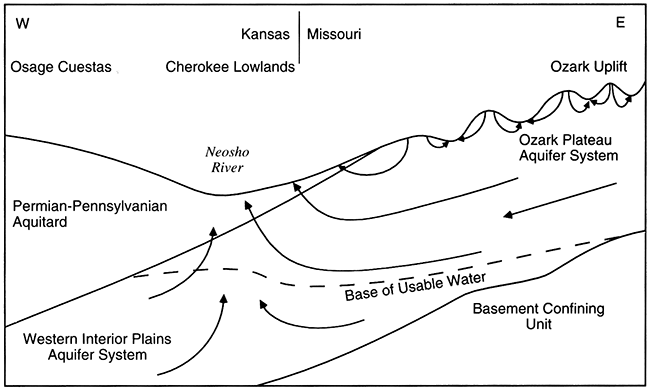
Ground-water flow within the Ozark aquifer is gravity driven and is northwestward into the deeper confined part of the aquifer system in southeastern Kansas (fig. 4.10; Jorgensen et al., 1993). In southeastern Kansas, the flow from regional recharge area in the Ozarks of southern Missouri encounters basinal flow in the Western Interior Plains aquifer system (see table 4.1) moving eastward (Macfarlane and Hathaway, 1987; Jorgensen et al., 1993). Ground water in the Western Interior Plains aquifer system is a sodium-chloride brine with dissolved solids concentrations that exceed 20,000 mg/L (Macfarlane and Hathaway, 1987). Where these two water masses meet, a 20-30-mi-wide (32-48-km-wide), fresh-to-saline water transition zone stretches northeast to southwest across the region (fig. 4.11). Figure 4.12 illustrates the likely pattern of ground-water flow in the Ozark Plateau and Western Interior Plains aquifer systems in vertical cross section. Within the transition, the flow direction turns south toward Oklahoma. Well data from within the transition suggest that the freshwater forms a lens below which formation water has not been flushed from the aquifer systems (Macfarlane and Hathaway, 1987). Computer simulation of this part of the Western Interior Plains and Ozark Plateau aquifer systems in the vicinity of the transition zone suggests that ground water is discharged upward across the Permian-Pennsylvanian aquitard to the Neosho River and its tributaries (Jorgensen et al., 1996). Near the Neosho River in Kansas, upward discharge from both aquifer systems to the river causes upwelling of saltwater in both aquifers, resulting in a shallower base of the freshwater-flow system.
Figure 4.10--Ground-water-flow directions in the Ozark Plateau and Western Interior Plains Aquifers. In southern Kansas most of the withdrawals of usable ground water come from the upper part of the Ozark aquifer (the lower aquifer unit of the Ozark Plateau aquifer system). The extent of the unconfined Ozark aquifer coincides with the main regional recharge area for the Ozark system.
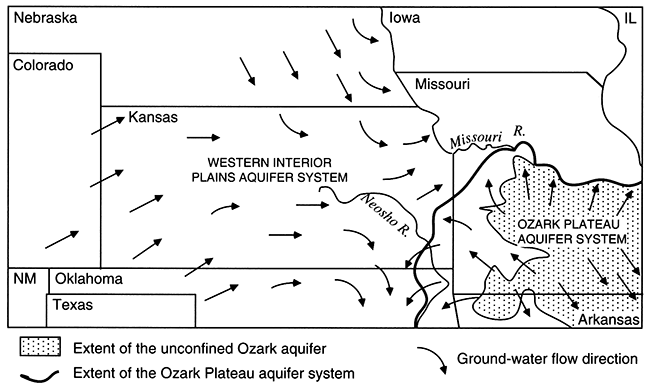
Figure 4.11--Extent of the fresh-saltwater transition zone in the Ozark Plateau aquifer system in southeastern Kansas and adjacent areas of Missouri and Oklahoma. The dashed line is the 2,500-mg/L isochlor line. Modified from Macfarlane and Hathaway (1987).
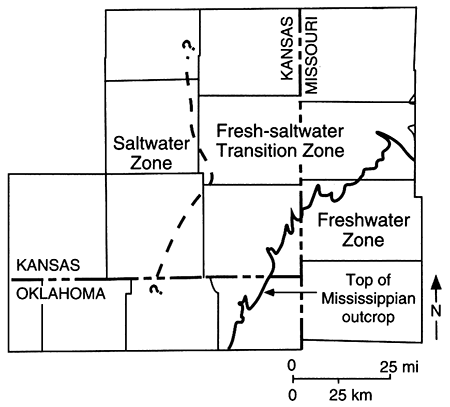
Figure 4.12--Vertical cross section showing ground-water-flow patterns in the vicinity of the fresh to saline water transition zone separating the Western Interior Plains and Ozark Plateau aquifer systems.
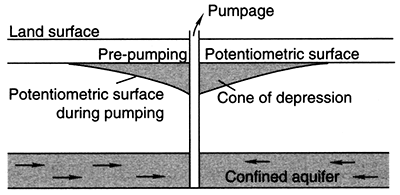
Ground water must be released from storage within the aquifer and move toward a pumping well in order for the well to produce. As water is removed from the well by pumping, the hydraulic head in the well and in the aquifer adjacent to the well screen is decreased. This causes ground water in the aquifer to move laterally toward the well. The drawdown is the decline of water level observed in wells screened in the aquifer being pumped. The amount of drawdown is a maximum at the pumping well and diminishes to zero some distance away. The region affected by drawdown from pumping is referred to as the cone of depression (fig. 4.13).
Figure 4.13--The cone of depression that results from pumping water from a confined aquifer. Pumping decreases the fluid pressure and, consequently, the hydraulic head (potentiometric surface) in the aquifer.
The flow of ground water to a pumping well and the potential well yield are determined by the transmissivity and the storativity properties of the confined aquifer framework (Freeze and Cherry, 1979). The transmissivity of a confined (or an unconfined) aquifer is the product of the hydraulic conductivity of the aquifer and its thickness:
T= Kh, (eq. 4.1)
where T is the transmissivity (L2/D, K is the hydraulic conductivity (L/T), and b is the aquifer thickness (L). The hydraulic conductivity is a measure of the overall resistance of the aquifer framework to the flow of water and the properties of the moving fluid (Domenico and Schwartz, 1990). Hence, transmissivity is a measure of the ability of the aquifer to transmit water through its entire thickness.
For the upper Dakota aquifer, transmissivities vary widely and generally increase from west to east because of the eastward increase in hydraulic conductivities and net thickness of sandstone. The occurrence of thicker and more permeable units in central Kansas may result from the dominance of alluvially deposited sandstones in the upper Dakota (Macfarlane et al., 1994). In southwestern Kansas, the reported transmissivities are less than 2,100 ft2/day (195 m2/day) (Watts, 1989). In central Kansas, transmissivities of the thicker river-deposited sandstones range from 2,000 to more than 7,000 ft2/day (186 to more than 650 m2/day) (Lobmeyer and Weakly, 1979; Wade, 1991). Only a few pumping tests have been conducted in the Ozark aquifer in southeastern Kansas and adjoining areas of Missouri and Oklahoma (Macfarlane and Hathaway, 1987). The reported values range from 34,000 ft2/day (3,159 m2/day) at Pittsburg, Kansas, to 540 ft2/day (50 m2/day) at Webb City, Missouri. In comparison, the transmissivities reported for pumping tests in High Plains and alluvial valley aquifers are generally higher, reflecting the more permeable nature of the aquifer. Reported values range from 1,400 to 62,000 ft2/day (130 to 5,760 m2/day) for the High Plains aquifer (Stullken et al., 1985). Reported transmissivities for the coarser alluvial deposits in Kansas are within the range of values reported for the High Plains aquifer.
The storativity of a confined aquifer is the product of the specific storage and the aquifer thickness:
S = Ssb, (eq.4.2)
where S is the storativity (dimensionless), and Ss is specific storage (1/L). The release of water from storage in confined aquifers is analogous to the process of consolidation in soil mechanics. Water is released from storage by (1) the expansion of water under confinement due to the decrease in fluid pressure due to pumping, and (2) the consolidation (compaction) of the confined aquifer framework due to increase in overburden stress on the aquifer framework. These two phenomena are expressed jointly in the specific storage term:
Ss = ρg (α + nβ), (eq.4.3)
where ρ is the water density (M/L3), g is the acceleration of gravity (L/T2), n is the porosity (dimensionless), and α and β are the compressibilities of the aquifer framework and the water, respectively (LT2/M). In eq. 4.3 the loss of porosity due to changes in grain packing of the framework is reflected in α and the expansion of the water is reflected in the nβ term. In most cases expansion of the water is the most important influence on the specific storage.
When water is released from storage in the aquifer under confined conditions, no loss of saturated thickness occurs, only a decrease in the fluid pressure. The cone of depression around the pumping well describes the decrease in the fluid pressure within the aquifer. In contrast, ground water is released from an unconfined aquifer by the combined effects of partial dewatering of the void space in the fully saturated part of the aquifer and gravity drainage to the water table from the unsaturated zone. The specific yield describes the storage property for an unconfined aquifer and is the volume of water that is released by a unit bulk volume of the aquifer per unit surface area of aquifer per unit decline in the water table (Freeze and Cherry, 1979). Because only drainable water in the pores is released, the specific yield is always less than the porosity. In contrast to the confined condition, the release of water from an unconfined aquifer during pumping causes a decrease in saturated thickness because of the partial dewatering of the aquifer adjacent to the well.
Because the mechanisms that allow water to be released from confined and unconfined aquifers are fundamentally different, the potential recoverable volume of water from each type is drastically different. For example, the storativities of confined aquifers typically range from 5 x 10⁻³ to 5 x 10⁻⁵ (Freeze and Cherry, 1979). In Kansas, the storativities of the Dakota and the Ozark aquifers generally fall at the lower end of this range. In contrast the reported specific yield values for most Kansas aquifers are in the range of 0.05-0.20. The amount of water that can be released to a pumping well withdrawing water from either a confined or unconfined aquifer is (Fetter, 1994)
V = S A (Δh), (eq.4.4)
where S is either the specific yield or the storativity, A is the surface area overlying the aquifer affected by a decline in the hydraulic head (L2), and Δh is the hydraulic-head decline experienced due to the withdrawal (L).
In ideal confined and unconfined aquifer systems of infinite areal extent with no regional hydraulic-head gradient, the cone of depression that develops during pumping is circular in plan view. As a result, ground water moves toward the center of the cone of depression from all directions uniformly. The drawdown within, and the size of the cone of depression depend in part on the transmissivity and storage properties of the aquifer (Freeze and Cherry, 1979). Because the storage is less, the hydraulic-head drawdown due to pumping in eq. 4.4 is greater at the well and the cone of depression is more areally extensive in a confined than in an unconfined system.
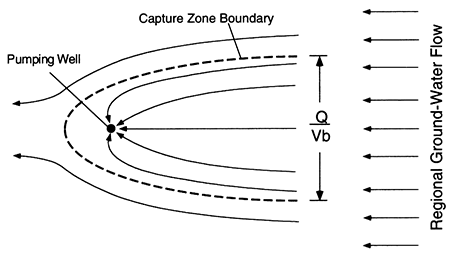
Where a regional hydraulic-head gradient occurs, the shape of the cone of depression is parabolic in plan view (fig. 4.14). The open end of the parabola is directed upgradient and defines a capture zone. The extent of the capture zone delineates the portion of the flow system that supplies ground water to the pumping well. At steady-state, the rate of withdrawal from the well balances the flow rate moving toward the well in the capture zone. All else being equal, the lower the hydraulic conductivity of the confined aquifer the greater width of the capture zone in plan view (Walton, 1985).
Figure 4.14--The capture zone created by a pumping well withdrawing water at a rate Q in a regional flow system of thickness b. The aquifer is assumed to be homogenous and isotropic. The Darcian velocity of flow is V. The width of the capture is a function of the pumping rate, the Darcian velocity, and the aquifer thickness. Modified from Walton (1985).
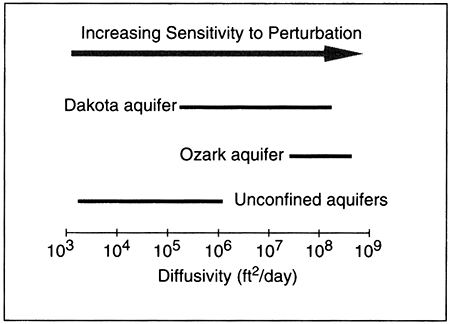
In general, confined aquifer systems are much more sensitive than unconfined systems to well pumping. The hydraulic diffusivity, D (L2/T), is a measure of the sensitivity of an aquifer to hydrologic perturbations and is calculated as
D = T/S = K/Ss, (eq. 4.5)
where S is either the storativity or the specific yield. Higher values of hydraulic diffusivity indicate that local perturbations of the flow system will be transmitted across a larger part of the aquifer than lower values. Figure 4.15 clearly shows that on the whole, the confined aquifer systems in Kansas are more sensitive to the perturbations associated with pumping than are the unconfined aquifers. Locally, the relatively higher values of diffusivity indicate that the cone of depression associated with a pumping well will have a larger areal extent and will develop faster in confined than in unconfined aquifers. If pumping wells are spaced too closely together, their capture zones will overlap, causing mutual interference between the wells. Mutual interference decreases the lateral flow toward each of the pumping wells producing additional drawdown in the aquifer. If both wells continue pumping for longer periods of time, local depletion may occur as less and less of the produced water in both wells comes from areas outside of the coalescing cones of depression. Hence, the spacing between pumping wells needs to be greater in the confined than in the unconfined aquifers to minimize the effect of mutual interference.
Figure 4.15--The range of diffusivities of the major confined and unconfined aquifer systems.
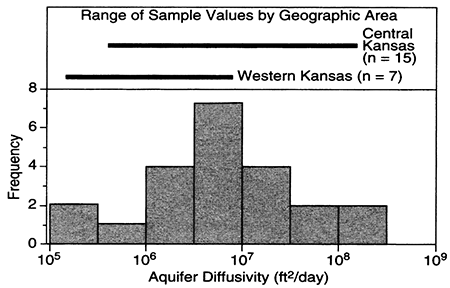
In the Dakota aquifer of Kansas, hydraulic-diffusivity values range over more than three orders of magnitude and the sample of 22 values appears to be log-normally distributed (fig. 4.16). Hydraulic diffusivities in western Kansas are generally less than the geometric mean (the average of the log-normal distribution) of the available data. In contrast, diffusivities have a larger range of values in central Kansas. These data suggest that for the same rates of withdrawal, the well spacing may need to be larger in central Kansas than in western Kansas to minimize the impact of mutual interference effects.
Figure 4.16--Distribution of Dakota aquifer diffusivities in Kansas. The available data suggest a log-normal distribution with a geometric mean value of 6.0 x 106 ft2/day, The central Kansas diffusivities show a wider range than the data from western Kansas with a higher geometric mean.
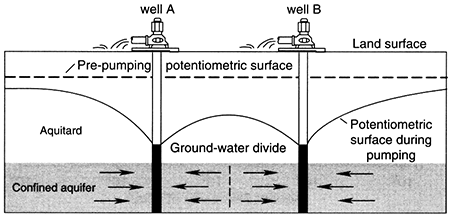
Aquifer heterogeneity further modifies the impact of well pumping on real flow systems. Aquifer heterogeneity is caused by extreme and systematic spatial variations in the hydraulic conductivity of the aquifer framework. For example, the Dakota aquifer consists of lenticular, permeable sandstone bodies that may be hydraulically connected or isolated. These sandstone bodies are encased in relatively impervious mudstone. Because the mudstones are much less permeable than the sandstones by at least several orders of magnitude, the boundaries of the sandstone bodies form local hydrologic barriers to flow as pumping continues. Analysis of available pumping-test results in Kansas suggests that even for long periods of continuous pumping over several days, the contribution of water from the mudstones to the adjacent aquifer is negligible (Macfarlane et al., 1994). These barriers channelize the flow within these ribbonlike bodies during the pumping period. As a result, the region of the aquifer that experiences drawdown may extend out from the well along the length of these bodies for several miles or more in both the upgradient and downgradient directions. Other hydraulically connected sandstone bodies may also experience some drawdown during pumping. However, in the direction perpendicular to the long axis of these bodies, the drawdown may only extend to its edge. In some cases this may be less than a mile away from the pumping well (fig. 4.17). In the figure, the relatively close proximity of a pumping well to these hydrologic barriers accelerates the water-level drawdown with time in nearby observation wells. If two pumping wells are spaced even a few miles apart and are withdrawing water from the same sandstone body, they will likely experience mutual interference (fig. 4.18).
Figure 4.17--Ground-water flow to a pumping well in a river-deposited sandstone aquifer. Ground-water flow follows the axis of the channel. The effects of ground-water withdrawals may be felt a long distance away from the pumping well depending on the geometry of the sandstone body and its hydraulic diffusivity.
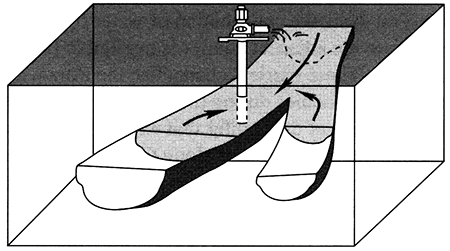
Figure 4.18--The mutual interference that develops when pumping wells are spaced too closely together in a confined aquifer. Note how the drawdown is greater at the ground-water divide between the wells than at the same point outboard from each well.
All the water withdrawn by a pumping well in a confined aquifer comes either from storage or capture. (See Chapter 2 in this volume for a more detailed discussion of capture.) Initially, water produced by the well comes entirely from storage in the aquifer adjacent to the well. As the well continues to pump, more and more of the aquifer experiences water-level declines. Eventually, these declines propagate to either the recharge or the discharge area, or both, producing "capture," given sufficient time. When this happens, additional recharge enters or the discharge is decreased from the aquifer system, resulting in an additional source of water added to the aquifer to balance the withdrawal. For confined aquifers, recharge and discharge include flows to and from other hydraulically connected aquifers. Capture is the sum of the increase in recharge and the decrease in discharge that results from the pumping. As the well continues to pump, more and more of the water produced by the well is replaced by induced recharge to the aquifer from surface water or other sources (see fig. 2.6 in Chapter 2, this volume).
The additional recharge coming from the recharge area results from reduced local discharge to streams in the discharge area or from another hydraulically connected aquifer. The generation of capture by pumping does not create any "new" water, but is merely a re-allocation of the amounts in the total hydrologic budget for a region. All else being equal, the proportion of recharge added to or decreased discharge from the confined aquifer will depend on whether the well is located closer to the source of the recharge or the discharge area. Thus, in the case of the confined upper Dakota aquifer, if the well is located near the fresh/saltwater transition or near the regional discharge area, withdrawals may induce significant saltwater intrusion by increased upward leakage from the lower Dakota or the Cedar Hills Sandstone aquifer. Likewise, withdrawals from the confined aquifer just downgradient of the Arkansas River in southeastern Colorado and adjacent southwestern Kansas or near the area of hydraulic connection with the overlying High Plains aquifer will likely induce additional recharge into the confined Dakota.
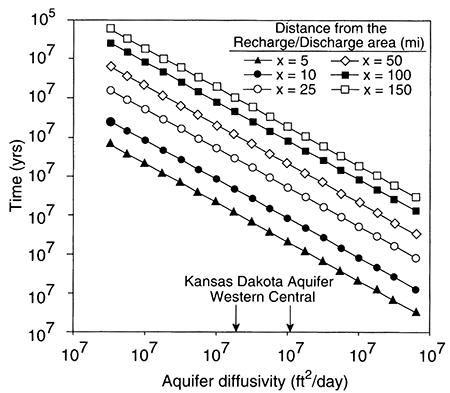
The time it takes to generate capture depends on the distance to the source of recharge or the discharge area and the hydraulic diffusivity of the aquifer (Theis, 1940; Glover, 1974). For example, from fig. 2.6 in Chapter 2 of this volume, the dimensionless time, 4Tt/x2S, required for capture to be added to a uniform confined aquifer from a source of recharge equal to 50% of the total withdrawal by pumping is approximately 4.4. In this expression, t is the length of the pumping period, and x is the distance from the source of recharge or discharge area. Because the hydraulic diffusivity, D, is equal to T/S, we can solve for the length of the pumping period required in terms of x and D by rearranging terms:
t = 1.1 x2/D. (eq. 4.6)
This relationship is plotted in fig. 4.19 for a number of distances from the recharge or discharge areas of the uniform confined aquifer. Using the geometric mean values of diffusivity for the confined Dakota aquifer in western and central Kansas, the plot shows that wells in western Kansas have to pump longer by almost an order of magnitude to achieve the same effect as the wells in central Kansas. For example, the time required to induce recharge equal to 50% of the withdrawal rate 5 mi (8 km) away from the recharge or discharge area in the confined aquifer is approximately one year in western Kansas. However, the same effect can be achieved in central Kansas in approximately one month.
Figure 4.19--Aquifer diffusivity vs. the time required for the well to generate induced recharge equal to 50% of its discharge for a number of distances from either the recharge or the discharge area of a confined aquifer.
If the heterogeneity of the Dakota is considered in this example, the perturbation of the flow field due to pumping is constrained by the boundaries of the sandstone bodies and is not omnidirectional as it would be in a uniform aquifer. Propagation of the effects of pumping also depends on the hydraulic conductivity of the framework near the boundary between adjacent sandstone bodies where they are physically in contact. For example, if there is a significantly less-permeable layer at the bounding surface between adjacent sandstones, the hydraulic connection between them may be poor even though the sandstones are permeable. Thus, the actual time required to generate significant capture may be considerably less or considerably more depending on the connectivity of the sandstone bodies in the aquifer framework.
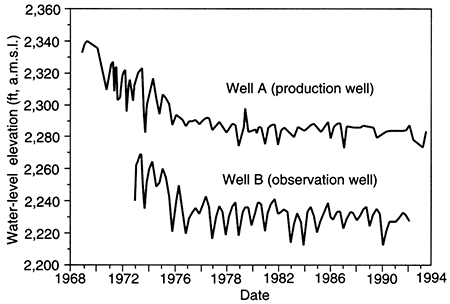
Hydrographs of several wells located within the confined Dakota aquifer and near the area of hydraulic connection with the overlying High Plains aquifer demonstrate that capture is occurring due to withdrawals. Figure 4.20 shows the location of a production and an observation well located approximately 6 mi (10 km) apart. Both wells are in Ford County and are screened in the upper Dakota aquifer. The production well (B in fig. 4.20) is 5 mi (8 km) away from where the Dakota is hydraulically connected to the High Plains aquifer to the south. The observation well (A in fig. 4.20) is about 4 mi (6 km) away from where the Dakota discharges to Saw Log Creek to the north. The production well is an irrigation well that has been in intermittent operation since 1967. The hydraulic heads in both the production and the observation wells show a decline within the confined aquifer for the first seven years of record until 1976 (fig. 4.21). After this date, the hydraulic heads are fairly stable except for seasonal fluctuations. The downward trend in water levels indicates that up to about 1976, withdrawals were removing water from storage in the confined Dakota. This resulted in hydraulic-head declines in the aquifer that had not reached the area of hydraulic connection with the High Plains aquifer and the local discharge area in Saw Log Creek. After this time, continued withdrawals appear to have generated sufficient capture to stabilize water levels in the Dakota at a new equilibrium level.
Figure 4.20--Location of the Hodgeman and Ford county wells discussed in this paper. Observation well A is located in the NW NW NW, sec. 12, T. 25 S., R. 23 W, production well B in SE NE SE sec. 10, T. 26 S., R. 23 W, and Well C in SW SW SW, sec. 7, T. 23 S., R. 26 W The shaded areas on the map indicate areas of hydraulic connection with the High Plains or alluvial aquifers in the Pawnee River drainage.
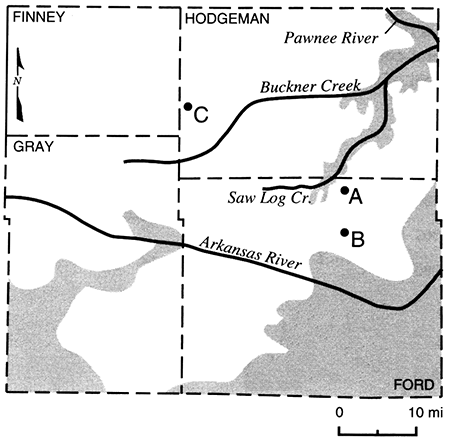
Figure 4.21--Hydrographs of well A (SE NE SE sec. 10, T. 26 S., R. 23 W.) and well B (NW NW NW SEC. 12, T. 25 S., R. 23 W.) in the upper Dakota aquifer of Ford County, Kansas. In fig. 4.20 the wells are approximately 6 mi (10 km) apart.
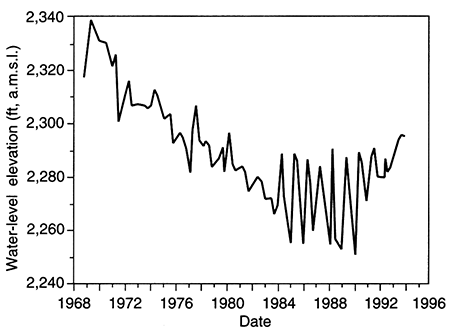
Another similar example comes from the upper Dakota aquifer in western Hodgeman County, Kansas (fig. 4.20). The well (C in fig. 4.20) is 17 miles (27 km) from the area of hydraulic connection with the High Plains aquifer in Gray County to the south and 22 miles (35 km) away from the local discharge point beneath the alluvium in the Pawnee River valley to the east. The hydrograph shows a steady decline of water levels in the confined Dakota from 1968 to 1983 (fig. 4.22). The period following is one of fluctuating water levels associated with seasonal pumping. As in the previous example, the data suggest that ground water was being removed mostly from storage until about 1983. After 1983, a sufficient amount of induced recharge was added to the aquifer to stabilize the water levels in the well during nonpumping periods and, as in the previous example, to establish a new dynamic equilibrium between recharge to and discharge from the aquifer.
Figure 4.22--Changes in hydraulic head in an observation well from 1968 to 1994. The well (C in fig. 4.20) is screened in the upper Dakota aquifer in Hodgeman County, Kansas, and is in use seasonally as a high-capacity well.
The results in fig. 4.19 also show that to a first approximation, withdrawals from the confined Dakota greater than 25-50 miles (40-80 km) away from a recharge or discharge area will probably not generate significant capture to the aquifer for a planning horizon of about 30 years. Thus, withdrawals must come almost entirely from aquifer storage in these areas and will eventually cause localized areas of depletion. A computer simulation of ground-water withdrawals from the Dakota aquifer in Ellis County was conducted to assess the effects of pumping on the 12-township (432-mi2 or 1,106-km2) model region (Smith, 1995). The Dakota was treated as a heterogeneous aquifer with regions of relatively high and low transmissivity determined from geostatistical analysis of borehole logs. The modeling results showed that after 10 years of continuous pumping at 150 gpm (9.5 L/s) by one well in a high transmissivity zone, all the water was produced from aquifer storage with no additional recharge coming from the overlying or underlying unit. At the end of the simulation period, the resulting cone of depression covered a large part of the modeled area and extended out from the pumping well in an east-west direction up to 12 miles (19 km) and in a north-south direction to 3 miles (5 km). More than 100 ft (30 m) of drawdown was produced at the pumping well.
Unconsolidated deposits of gravel, sand, silt, and clay occur as discontinuous lenses and layers throughout the High Plains aquifer in Kansas (Stullken et al., 1985). Semi-confined conditions may exist locally in the High Plains aquifer where more permeable sections of the aquifer are interbedded with multiple less-permeable clay and silt layers. The unconsolidated clay and silt layers generally have a higher vertical hydraulic conductivity than their lithified equivalents. Hence, the vertical flows across these layers can be a significant contributor of water to semi-confined aquifers. Hydrographs of a significant number of widely distributed wells in the High Plains aquifer suggest that local semi-confined aquifer conditions are widespread.
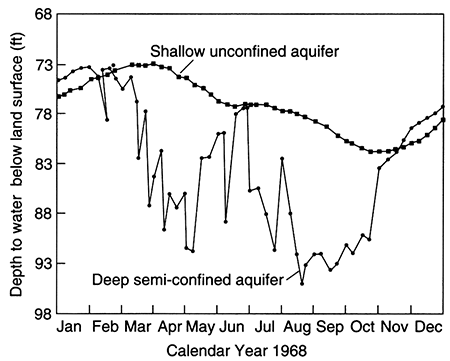
In parts of the aquifer that are largely semi-confined, ground-water withdrawals produce much larger declines in hydraulic head during the pumping season than in the unconfined part of the aquifer (Gutentag et al., 1972). The annual hydraulic-head fluctuations in semi-confined aquifers may approximate the fluctuations experienced in confined aquifer systems that are affected by seasonal withdrawals. Figure 4.23 shows the hydrographs of a shallow and a nearby deep well in the High Plains aquifer near Garden City, Kansas, taken from Gutentag et al. (1972). The annual fluctuation of water level in the shallow well is less than 10 ft (3 m), but is more than 20 ft (6 m) in the deep semi-confined aquifer. Due to limited extent of the confining layers, the large drop in hydraulic head from seasonal withdrawals induces significant recharge from the unconfined to the semi-confined part of the aquifer. Leakage into the semi-confined aquifer also is induced due to the increased hydraulic-head difference across the confining layers. This results in a partial or complete rebounding of the hydraulic head within the semi-confined aquifer during the nonpumping season. If withdrawals are greater than the capture, the hydraulic head will not totally rebound each year and the pattern of water-level fluctuations may not reflect regional changes in the unconfined aquifer over longer periods of time.
Figure 4.23--Hydrographs of a shallow and nearby deep well in the High Plains aquifer at the Irrigation Farm, Garden City Experiment Station, Garden City, Kansas. From Gutentag et al. (1972).
Sustainability implies the attainment of a new dynamic equilibrium under conditions of widespread development. Under sustainability, an approximate balance exists between recharge, discharge, and withdrawals from the aquifer system. The most direct evidence of this new balance is long-term stability of hydraulic heads in the aquifer that are lower than they were under predevelopment conditions. At that point, recharge into the aquifer increases and discharge from the aquifer decreases, producing capture that is equivalent to the amount of water being withdrawn.
If the production wells are distant from sources of recharge or discharge, the generation of capture is unlikely within a time frame that is practical. Where the High Plains aquifer is present, additional significant freshwater recharge to the confined Dakota is unlikely because of the low vertical-hydraulic conductivity of the overlying aquitard. Hence, all of the water withdrawn from the aquifer will come from storage. Meaningful management plans in this part of the system should be premised on an acceptable rate of water-level decline within the planning period. The primary management tools to control declines are well spacing, restrictions on the rates of withdrawal from the aquifer, and artificial recharge. Depletion of the aquifer will occur if production wells are too close together and if the rates of withdrawal from the aquifer are unregulated. Smith (1995) demonstrated that in the confined upper Dakota aquifer, coalescing cones of depression form quickly when wells pumping continuously at 100 gpm (6.3 L/s) are spaced from 1 to 4 miles (1.6-6 km) apart. After 10 years, larger drawdowns than would be expected from a single pumping well are produced and a much larger area of the aquifer is affected by the withdrawals. Taking into account the heterogeneity of the upper Dakota in Ellis County, Smith recommended well spacings 20 miles (32 km) in an east-west direction and 5 miles (8 km) in a north-south direction to avoid significant mutual interference problems.
Is sustainability a viable concept that can be used to manage the Kansas confined aquifer systems? As we have seen, the attainment of a dynamic equilibrium may be possible only in regions of the aquifer that are close to either the regional recharge/discharge areas or to areas of hydraulic connection with other aquifer systems. Several examples have been presented that demonstrate a new dynamic equilibrium has been established locally in the confined aquifer. The time to attain this new equilibrium depends on the distance away from the source of recharge or discharge and the properties of the aquifer. Management on the basis of sustained yield may be more realistic in this part of the confined system for planning horizons on the order of a few decades.
Ultimately, however, sustainability is not a viable management concept for these regions of the confined aquifer. The reallocation of water within a region's total hydrologic budget may have undesirable consequences for other parts of the hydrologic cycle. The generation of capture may result in saltwater-intrusion problems if the points of withdrawal from the aquifer are located too closely to water-quality transitions, as in the case of the Ozark aquifer, or sources of saltwater recharge, as in the case of the Dakota and the Cedar Hills Sandstone aquifers. The generation of capture may not be beneficial if the additional recharge moving into the confined aquifer is coming from an already over-appropriated, hydraulically connected aquifer system.
The steps taken to prevent depletion in other parts of the Kansas confined aquifer systems clearly depend on the total intensity of development. For example, at low intensities of development in the Dakota aquifer, a well spacing greater than about 20 miles (32 km) and control of pumping rates should be adequate to prevent overdevelopment. At higher intensities, prevention of depletion is only possible by maintaining the points of withdrawal in proximity to sources of recharge or the discharge areas from the aquifer, if capture from these sources is deemed desirable in the overall management plan for the aquifer. Walton (1964) correctly noted that the practical sustained yield of the heavily pumped Cambrian-Ordovician aquifer in northeastern Illinois depended not on the natural recharge rate, but on the rate at which water could move toward the pumping centers from the recharge area.
All the major confined aquifer systems in Kansas are multistate in extent. Unfortunately, the recharge areas for the confined Ozark and the Dakota aquifer systems in Kansas are located in Missouri and Colorado, respectively, and their flow paths cross state lines (figs. 4.5 and 4.10). The sensitivity of these aquifer systems to development suggests that their management should be coordinated across state lines, possibly through interstate compacts to minimize the potential for depletion or saltwater encroachment. This could be particularly crucial for Kansas because of its "downgradient" location with respect to the recharge areas for these systems.
Confined aquifer systems are different from unconfined systems because of fundamental differences in their response to withdrawals. The transmissivities are generally lower in confined aquifers than in unconfined aquifers because they are less permeable. The storage is also smaller in the conti ned aquifer. As a result, well yields are generally lower and the drawdown due to pumping is much greater. Water is released to a pumping well in a confined aquifer by consolidation of the aquifer framework and volume expansion of the water, whereas in the unconfined aquifer, the water produced comes from the drainable porosity of the aquifer. Consequently, rates of withdrawal from the confined system are generally much less because of the larger drawdowns experienced in these aquifer systems. The larger drawdowns result from higher hydraulic diffusivities in confined than in unconfined aquifer systems.
Confined aquifer systems are more sensitive to development than unconfined systems because of their hydrologic properties. Hydraulic diffusivity, a measure of the ability of the aquifer to transmit perturbations through the aquifer, is much higher in confined than in unconfined aquifers. The ability to increase recharge, decrease discharge, or both (capture) is directly related to the aquifer diffusivity and inversely related to the distance from the point of withdrawal and the source of the capture.
The creation of a new dynamic equilibrium after development is achievable in a practical sense in areas of confined aquifer systems that are close to sources of recharge or discharge areas and for planning horizons on the order of a few decades. These shallower parts of the confined aquifer systems should be managed as part of a unit including the aquifers to which they are in hydraulic connection. Elsewhere, in the deeper and more isolated parts of confined aquifer systems, management based on the sustainable yield concept is not practical within a reasonable planning horizon. Management policies could be based on an acceptable rate of hydraulic-head decline within the aquifer during the planning period and implemented using controls on well spacing and rates of withdrawal.
Belitz, K., and Bredehoeft, J. D., 1988, Hydrodynamics of the Denver basin-Explanation of fluid subnormal pressures: American Association of Petroleum Geologists, Bulletin, v, 72, no. 11, p. 1,334-1,359
Domenico, P. A., and Schwartz, F. W., 1990, Physical and chemical hydrogeology: New York, John Wiley and Sons, 824 p.
Fetter, C. W., 1994, Applied hydrogeology, 3rd edition: New York, Macmillan College Publishing Co., 691 p.
Freeze, R. A., and Cherry, J. A., 1979, Groundwater: Englewood Cliffs, New Jersey, Prentice Hall Inc., 604 p.
Glover. R. E., 1974, Transient ground-water hydraulics: Department of Civil Engineering, Colorado State University, Fort Collins, 413 p.
Gutentag, E. D., Lohmeyer, D. H., McGovern, H. E., and Long, W. A., 1972, Ground water in Finney County, southwestern Kansas: U.S. Geological Survey, Hydrologic Investigations Atlas, HA-442
Hamilton. V. J., 1994, Sequence stratigraphy of Cretaceous Albian and Cenomanian strata in Kansas; in, Perspectives on the Eastern Margin of the Cretaceous Western Interior Basin, G. W. Shurr, G. A. Ludvigsen. and R. H. Hammond, eds.: Geological Society of America, Special Paper 287, p. 79-96
Jorgensen, D. G., Helgesen, J. O., and Imes, J. L., 1993, Aquifer systems underlying Kansas, Nebraska, and parts of Arkansas, Colorado, Missouri, New Mexico, Oklahoma, South Dakota, Texas, and Wyoming--Geohydrologic framework: U.S. Geological Survey, Professional Paper 1414-B. 238 p. [available online]
Jorgensen, D. G., Helgesen, J. O., and Imes, J. L., 1996, Aquifer systems underlying Kansas, Nebraska, and parts of Arkansas, Colorado, Missouri, New Mexico, Oklahoma, South Dakota, Texas, and Wyoming--Regional aquifer systems analysis: U.S. Geological Survey, Professional Paper 1414-A, 67 p. [available online]
Kurne, J., and Spinazola, J. M., 1985, Geohydrology of sandstone aquifers in southwestern Kansas: Kansas Geological Survey, Irrigation Series 8, 49 p. [available online]
Lobmeyer, D. H., and Weakly, E. C., 1979, Water in the Dakota formation, Hodgeman and Ford counties, southwestern Kansas: Kansas Geological Survey, Irrigation Series 5, 41 p. [available online]
Macfarlane, P. A., 1993, The effect of topographic relief and hydrostratigraphy on the upper part of the regional groundwater flow system in southeastern Colorado and western and central Kansas. with emphasis on the Dakota aquifer: Ph.D. dissertation, The University of Kansas, Lawrence, 197 p.
Macfarlane, P. A., 1995, The effect of river valleys and the upper Cretaceous aquitard on regional flow in the Dakota aquifer in the central Great Plains of Kansas and southeastern Colorado; in, Current Research in Earth Sciences: Kansas Geological Survey, Bulletin 238, p. 11-30 [available online]
Macfarlane, P. A., and Hathaway, L. R., 1987, The hydrogeology and chemical quality of ground waters from the lower Paleozoic aquifers in the Tri-State region of Kansas, Missouri, and Oklahoma: Kansas Geological Survey, Ground-water Series 9, 37 p. [available online]
Macfarlane, P. A., and Smith, M. E., 1994, The Dakota aquifer of the central Great Plains--A unique example of the transition from deep basin to near-surface steady-state ground-water flow regimes: Water and Energy Resources of the Dakota Aquifer, Workshop and Clinic, Great Bend, Kansas, p. 4-5
Macfarlane, P. A., Doveton, J. H., Feldman, H. R., Butler, J. J., Jr., Combes, J. M., and Collins, D. R., 1994, Aquifer/aquitard units of the Dakota aquifer system in Kansas--Methods of delineation and sedimentary architecture effects on ground-water flow and flow properties: Journal of Sedimentary Research, v. B64, no. 4, p. 464-480
Macfarlane, P. A., Whittemore, D.O., Chu, T., Butler, J. J., Jr., Wade, A., Coleman, J., Doveton, J. H., Mitchell, J. E., and Kay, S., 1992, The Dakota Aquifer Program annual report, FY91: Kansas Geological Survey, Open-file Report 92-1, 93 p. [available online]
Macfarlane, P. A., Whittemore, D.O., and Davisson, M. L., 1995, The use of major-ion geochemistry and geochemical tracers to evaluate conceptual, steady-state flow simulations of the Dakota aquifer in Kansas and southeastern Colorado: EOS, v. 76,no. 46, p. F265
Maxey, G. B., 1964, Hydrostratigraphic units: Journal of Hydrology, v. 2, p. 124-129
Seaber, P. R., 1988, Hydrostratigraphic units; in, Hydrogeology, The Geology of North America, W. Back, J. R. Rosenshein, and P. R. Seaber: Geological Society of America, v. O-2, p. 9-14
Smith, M. E., 1995, Hydrostratigraphic controls on ground-water flow and the distribution of chloride in the upper Dakota aquifer of southwestern Ellis County, Kansas: M.S. thesis, University of Kansas, Lawrence, 229 p.
Smith, M. E., and Macfarlane, P. A., 1994, Automated groundwater modeling with ARC/INFO and MODFLOW--A three-dimensional regional flow model of the Dakota aquifer: Water and Energy Resources of the Dakota Aquifer, Workshop and Clinic, Great Bend, Kansas, p. 20-21
Stullken, L. E., Watts, K. R., and Lindgren, R. J., 1985, Geohydrology of the High Plains aquifer, western Kansas: U.S. Geological Survey, Open-file Report 85-4198, 86 p. [available online]
Theis, C. V., 1940, The source of water derived from wells--Essential factors controlling the response of an aquifer to development: Civil Engineering, v. 10, no. 5, p. 277-280
Wade, A., 1991, Determination of aquifer properties of the Dakota aquifer in Washington County, Kansas, from a pumping test: Kansas Geological Survey, Open-file Report 91-1c, 62 p. [available online]
Walton, W. C., 1964, Future water-level declines in deep sandstone wells in the Chicago region: Ground Water, v. 2, no. 1, p. 13- 20
Walton, W. C., 1985, Practical aspects of ground water modeling: Worthington, Ohio, National Water Well Association, 587 p.
Watts, K. R., 1989, Potential hydrologic effects of ground-water withdrawals from the Dakota aquifer, southwestern Kansas: U.S. Geological Survey, Water Supply Paper 2304, 47 p. [available online]
Whittemore, D.O., and Fabryka-Martin, J., 1992, Halogen geochemistry of Cretaceous sandstone aquifers of North America; in, Proceedings of the 7th International Symposium on Water-Rock Interaction, Y. K. Kharaka and A. S. Maest, eds.: Rotterdam, Netherlands, A. A. Balkema Publishers, p. 855-858
Previous--Report Start || Next--Water Chemistry and Sustainable Yield
Kansas Geological Survey
Comments to webadmin@kgs.ku.edu
Web version placed online May 6, 2013. Original publication date 1998.
URL=http://www.kgs.ku.edu/Publications/Bulletins/239/Macfarlane/index.html