Previous--Effects of Agriculture on Water Yield in Kansas || Next--Managing Uncertainty in Yield Estimates
This article available as an Acrobat PDF file (380 kb).
Other chapters of this book describe some of the complexities that underlie the apparently simple terms "safe yield" and "sustainable yield." Although these can be defined with the seemingly authoritative rigor of equations based on hydrologic balance, the definition and interpretation of the terms of the equation quickly become dependent on less precise and more problematic human values--risk assessment and acceptance, relative valuation of diverse shared resources, and cultural expectations concerning decision-making and conflict resolution.
Even if some agreement on values and goals can be reached, the technical basis for determination of "safe yield" is not simple. At the most fundamental level, it depends on the assumption of basic stability in the larger features of the hydrologic cycle: long-term consistency of water input in the form of precipitation and the flow of surface water and ground water, and of the factors such as temperature, wind, and sunlight that control evaporation and transpiration. We may not know the natural patterns and quantities well enough, they may be uncomfortably variable, and human activities (such as land use and water development) may alter local or regional aspects of the hydrologic system. Nevertheless, if the basic natural patterns are stable we can hope to learn what they are, to compensate for their variability, and to enhance beneficial human effects and control or reverse the undesirable ones.
The purposes of this chapter are to examine and to challenge the comfortable assumption of underlying stability in the hydrologic cycle. Water flux--the rates, patterns, and distribution of evaporation, precipitation, runoff, and recharge--is a key component of what we call climate. We know that climate is subject to both natural and human-induced changes on various scales. Past climate changes can complicate modern water-budget calculations if present ground-water reserves are the result of past periods of much higher net recharge; much of the water in the Ogallala aquifer probably represents such an accumulation during periods of cooler, wetter climate (see chapter 1 on Kansas water resources).
Although past climate changes can combine with modern withdrawal practices to produce present concerns about "mining ground water," the major focus of this chapter is on the probable consequences of future and presently occurring climate change. The local and regional hydrologic effects of global changes cannot be reversed or stabilized at a local level: adaptation is the only near-term management option. Such adaptation will almost certainly require reconsideration of the concepts, as well as the present water quantities, associated with "safe yield" and ideas of sustainability.
Many definitions of "climate" are possible, but from a practical, quantitative standpoint, climate is 30 years worth of weather. The U.S. National Weather Service (NWS) uses the data from its network of climatological stations to prepare "30-year norms" at 10-year intervals, and these compiled statistics on weather/climate parameters are commonly used as representative of long-term average behavior. Such data--on rain, snow, temperature, and streamflow--are available for most of the developed world for a period of many decades to over a century. These form the engineering basis for such practical applications as reservoir design and water-rights appropriations.
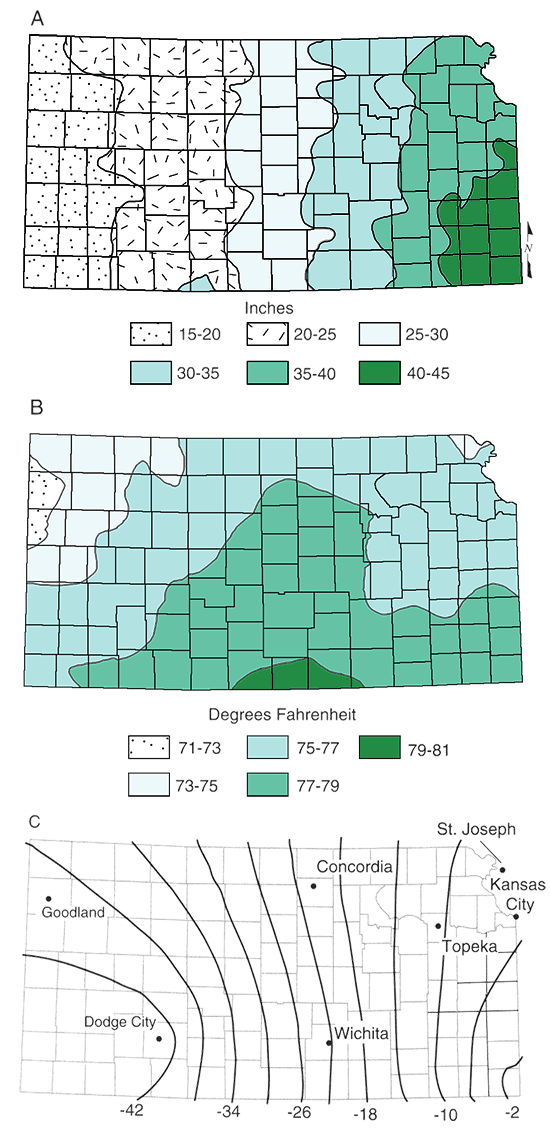
Figure 8.1 shows examples of some of the key climate variables for Kansas. Average annual precipitation tells us something about the total water availability, summer mean temperature suggests patterns of drying and evaporation, and the difference between precipitation and potential evaporation addresses directly the major controls on the average aridity of regions within the state.
Figure 8.1--(A) Normal annual precipitation for Kansas (Goodin et al., 1995); (8) Distribution of summer mean temperatures in Kansas (Goodin et al., 1995); (C) Distribution of potential water balance (precipitation minus free water surface evaporation) for the state (from fig. 1.12B, chapter 1; see also remainder of chapter 1 discussion of Kansas hydroclimatology).
Yet farmers, highway crews, and hydrologists all know that there is more to climate than average weather. Observations taken on the scale of counties and averaged over days, months, or years do not adequately capture the hydrologic effects of intense local thunderstorms, or the complex time-sequence of weather conditions that causes greatly enhanced runoff over saturated or frozen ground. Over longer time scales our data base is inadequate to do more than hint at the frequency with which we might expect a recurrence of the Dust Bowl of the 1930's, the great EI Nino of 1982-83, or the Mississippi Valley floods of 1993. This critical information is calculated, almost always on the basis of assumptions that the observed climate means and variabilities are stable and a reliable guide to the future (see Chapter 1 on Kansas water resources, and Chapter 9 on statistics and variability).
Over these longer time scales and over regions where human instrumental records do not exist, we rely on other human observations and historical records, and on inferences about the present and past controls on biology and other natural processes that leave records behind-in sediment or soil formation, in tree rings or pollen deposits, or in the isotopes and trace element ratios of natural products. To test our assumptions and understanding of the past and present, and to make predictions of the future, we rely upon models--ranging from simple conceptual analogies to computer simulations of complex physical and chemical processes.
A broad classification scheme for climate has emerged from biogeography and ecology. Ecologically based climate zones, based on large-scale ecosystem classifications (biomes), represent an operational approach to defining the climate of a region by the characteristics of its plant communities. Although somewhat less precise and quantitative than numbers derived from instrumental data, biotic climate zones of the past can be inferred from paleoenvironmental records. Their present distribution has the advantage of focusing attention on an issue of prime concern to humans: the amount and nature of the real or potential productivity of the land, and its climatic controls.
Humans have an understandable tendency to think of natural climate change as something slow and distant-woolly mammoths and cave men are unimaginably far removed from the video store and the coffee shop. In part this is due to the historical accident of our position on top of an unusually long and stable climatic plateau (see Boxed section 8.2). Yet even within this period of relative stability there have been major variations. The prairies have been dominated by grasslands for thousands of years, yet in historical times the Norsemen colonized Greenland (ca. 985 AD) during a period of mild climate known as the Medieval Warm Period, and were frozen out in the mid- 15th century by the onset of a protracted cold period called the Little Ice Age. In the late 19th century, settlement of the Plains experienced "booms" in wet periods and "busts" (economic depressions) caused by multi-year droughts (Shortridge, 1995); droughts, floods, and temperature extremes persist in the news in the present decade. It is a stock inter-generational joke that winters were always colder when the older people were young-but sometimes it is true. As concerns about human alteration of climate have caused us to look more closely at both past and present environments, we are finding ever more evidence for changes more rapid and more extreme than we have assumed.
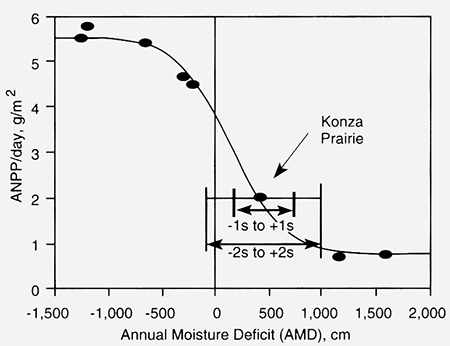
The Konza Prairie Reserve in north-central Kansas is an area of grassland preserved essentially as it was before European settlement. It also is the site of a Long-term Ecological Research (LTER) site operated by Kansas State University with National Science Foundation support. The LTER program studies and compares ecosystem dynamics at a range of locales nationwide. The results of the first phases of investigation are striking: the prairie is intermediate between desert and forest in terms of its average production of biomass (growth of vegetation)-but its relative range of variation is far greater than the other ecosystems. In unusually good (wet) years, the prairie may be nearly as productive as the forests, while in bad (dry) years productivity may be nearly as low as some desert environments. Figure 88.1.1 shows these results in graphic and tabular form. Compare the annual moisture-deficit values (shallow-lake evaporation minus precipitation) plotted here with fig. 8.1 and chapter 1 on Kansas water resources.
Dominance by a plant community able to respond over this wide range of conditions implies that high variability has been a major long-term climate feature of the Great Plains. The potential for high productivity under conditions of adequate water supply exemplify the recognized agricultural potential of the area-water, land management, and irrigation to provide enough moisture are human adaptations to a variable but potentially productive environment. The high natural variability, in turn, also implies that the productivity of introduced agricultural crop species would be at risk if the available water supply were to diminish, or its variability to increase.
Table B8.1.1 and Figure B8.1.1-Graphed and tabulated values of plant productivity and water balance (positive values of AMD indicate available water) at the various Long-term Ecological Research (LTER) sites. These data, supplied by J. K. Koelliker of Kansas State University, illustrate the extremely wide range of net primary production corresponding to the moisture variations seen at the prairie site. By contrast, the wetter (forest) and drier (desert or high plains) sites exhibit much lower variability for comparable ranges of moisture deficits. This suggests that Kansas is poised at a climatic balance point in terms of supportable ecosystems. Relationship between annual net primary production (ANPP) per day of the growing season and average annual moisture deficit (AMD) at selected LTER sites in the continental United States was prepared by J. K. Koelliker (Kansas State University, January 1996).
| LTER Site | Average annual values | Growing season* |
ANPP/day of growing season, g/m2 |
|||
|---|---|---|---|---|---|---|
| ANPP g/m2 |
Lake evap., mm |
Precip., mm |
Moist. def., mm |
|||
| H.J. Andrews, OR | 1,650 | 508 | 1,778 | -1,270 | 300 | 5.50 |
| Coweeta, NC | 1,450 | 965 | 2,159 | -1,194 | 252 | 5.75 |
| Hubbard Brook, NH | 950 | 547 | 1,118 | -660 | 175 | 5.43 |
| Harvard Forest, MA | 800 | 813 | 1,092 | -279 | 172 | 4.65 |
| Niwot Ridge, CO | 225 | 508 | 711 | -203 | 50 | 4.50 |
| Konza Prairie, KS | 450 | 1,295 | 851 | 444 | 221 | 2.04 |
| Central Plains, CO | 110 | 1,473 | 330 | 1,143 | 160 | 0.69 |
| Jornada, NM | 180 | 1,829 | 229 | 1,600 | 250 | 0.72 |
Essentially all the energy that drives the earth's climate system comes from the sun-other sources of energy, such as heat flow from the center of the earth and tidal energy, are a tiny fraction of a percent of the total supplied by the sun. Natural climate variations are believed to be linked to changes in the energy transfer between sun and earth. Such changes may occur in three ways: variation in solar output, change in the earth-sun geometry, or changes in the proportions of solar energy reflected and absorbed by the earth.
Variations in solar output are the most uncertain and controversial of the possible contributors to climate change. We are confident that the sun's output has declined over the lifetime of the solar system-but the rate of change is imperceptible on the scale of even long-term climate change. We know that the sun has activity cycles of 11 and 22 years--but while these may contribute to climate variability, the cycles are too short to drive longterm trends. There is some evidence for solar variations with time scales of thousands of years (Bond and Lotti, 1995; O'Brien et al., 1996), but the best current quantitative estimate of their magnitude is several tenths of a degree C (Stuiver et al., 1995)--which is climatically significant, but still smaller than the effects attributed to orbital variations and the "greenhouse effect."
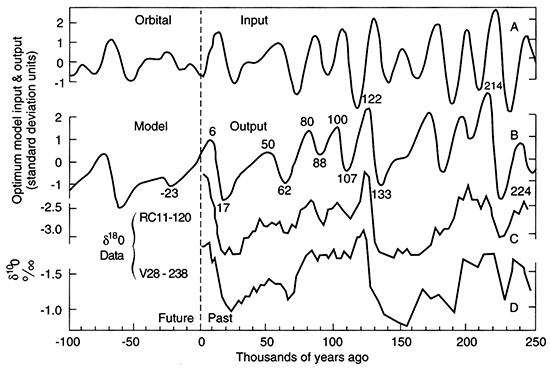
The long-term glacial-interglacial cycles appear to be strongly correlated with the so-called "Milankovich cycles"--systematic variations in the tilt and wobble of the earth's axis relative to the sun, and in the eccentricity of earth's orbit (Imbrie and Imbrie, 1980). These cycles have periods of different lengths, but all are measured in tens of thousands of years. When the effects of orbital cycles on the seasonality of high-latitude radiation are calculated and used as input for a climate model, the resulting output closely matches oceanic isotope tracers of climate variation, as shown in fig. 8.2. Most (but as usual, not all) scientists believe that orbital variations are the dominant factor controlling the occurrence and timing of the glacial cycles of the past few million years, and that their effects on climate can be seen in older times as well.
Figure 8.2--Hindcasts and forecasts of global ice volume based on a model of the insolation variations due to 'Milankovich variations in the earth's orbit' (Imbrie and Imbrie, 1980). The orbital variations produce an input (curve A) that yields the calculated curve of ice volume (curve B--numbers indicate ages in thousands of years). These results can be compared to the 18O data from sediments in the southern Indian Ocean (curve C) and the Pacific Ocean (curve D), which should be related to the actual ice volume at the time. Note that the projection considers orbital factors only and does not take into account any human intervention in the climate cycle.
It is important to understand that these orbital variations make little (in the case of eccentricity) or no (in the case of tilt and wobble) change in the absolute annual amount of total solar energy falling on the earth's projected area. They do, however, make major differences in the seasonal and latitudinal distribution of solar energy. The major temperature and climate changes are the result not of primary energy input, but of how the distribution of this input affects feedback processes within the atmosphere-ocean system. The strength and importance of this internal climate feedback is illustrated by the role of greenhouse gases.
One very important class of components of the climate feedback system is the "greenhouse gases"--so-called because their action is similar to that of the glass in a greenhouse. Incoming solar radiation is primarily in the visible wavelengths, whereas the energy absorbed and reemitted to space by the earth is in the longer, infrared wavelengths. A number of atmospheric gases, both natural and human-made, are transparent to visible light but relatively opaque to infrared radiation. The higher their concentration in the atmosphere, the more energy is trapped near the earth's surface--and it is this trapped energy that drives the climate system. Water, in the form of clouds and atmospheric moisture, is one of the most powerful greenhouse gases, but because its concentration is so variable in time and space, the roles of the other atmospheric greenhouse components are better understood.
For the past several million years, the Earth's climate has oscillated between glacial and interglacial conditions, with global temperature changes of more than 5° Celsius (9° F) and sea-level variations of over 100 m (approximately 400 ft). The most recent cycle is the best characterized, and its general characteristics are illustrated in fig. B8.2.1 (Delacourt and Delacourt, 1991).
Figure B8.2.1--Reconstruction of estimated global climate (expressed as mean global temperature-curves of sea level, the inverse of ice volume, atmospheric CO2, etc. have very similar forms) over the last glacial-interglacial cycle, with a possible projection 25,000 years into the future. A future cooling trend is predicted by the Milankovich astronomical theory of the Ice Ages. However, this cooling trend is expected to be delayed over the next 2,000 years because of a human-induced "superinterglacial" interval resulting from the combustion of fossil fuels and other modifications of atmospheric composition and the earth's surface (Delacourt and Delacourt, 1991).
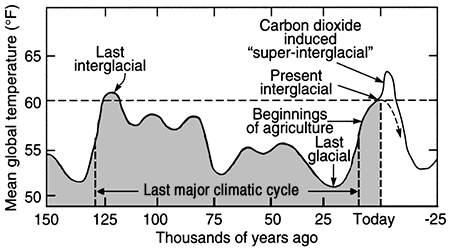
As the glaciers of the last great Ice Age melted and broke up, the earth's environment changed dramatically, and sometimes with great rapidity-for example, at times sea level rose many meters in the period of less than a century (Blanchon and Shaw, 1995). These changes culminated in a warm period (known as the Hypsithermal Interval) between about 9,000 and 4,000 years ago. By 6,000-7,000 years ago, sea level had come very close to its present elevation, and the world settled into a period of benign stability of temperature and sea level unusual in recent geologic history. Although modern humans had been in existence and expanding their range for tens of thousands of years before this, what we know as civilization and culture exploded during the climatic stability of the Late Holocene. Agriculture, permanent cities, written languages-all of their origins are coincident with the onset of climate stability and have developed over its course. Modern human societies are the end products of a rather anomalous period of earth history, and our ideas of "normal" arguably result from a combination of climatic accident and collective amnesia.
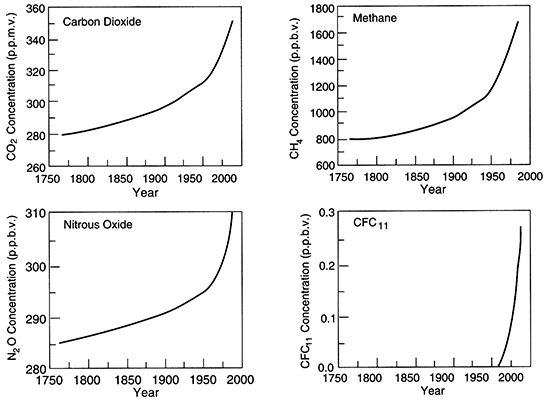
Energy budgets clearly show that the natural "greenhouse effect" is critical for maintaining the earth's surface temperature above freezing, and the potential for human-induced climate change by alteration of greenhouse-gas concentrations has been recognized for nearly a century (MacCracken et al., 1990). The issue has received serious scientific attention since careful measurements of atmospheric CO2 (a major greenhouse gas) concentration showed systematic increases, resulting from fossil fuel combustion, cement production, and biomass burning. A recent update of these observations is shown in fig. 8.3 (Keeling et al., 1995). Measurements of gas bubbles trapped in glacial ice have made it possible to recreate the recent history of atmospheric concentrations of a number of greenhouse gases; their systematic increase, which is closely correlated with industrial development, points unequivocally to human alteration of a critical component of the climate-control system. These records are summarized in fig. 8.4.
Figure 8.3--(A) The CO2 Concentration of the atmosphere, measured in Hawaii (low latitude, Northern Hemisphere) and Antarctica (high latitude, Southern Hemisphere). The trends are identical and the seasonal variations (due to vegetative uptake and release) exhibit the patterns and relative magnitudes predictable from the sampling locations. (B) Comparison of the smoothed trend line of atmospheric CO2 concentration with the best-fit trend line of industrial emissions (calculated from data on global fossil-fuel combustion, cement production, and miscellaneous CO2 sources). It appears that between 50 and 60% of the anthropogenic CO2 emissions remain in the atmosphere. Adapted from Keeling et al. (1995).
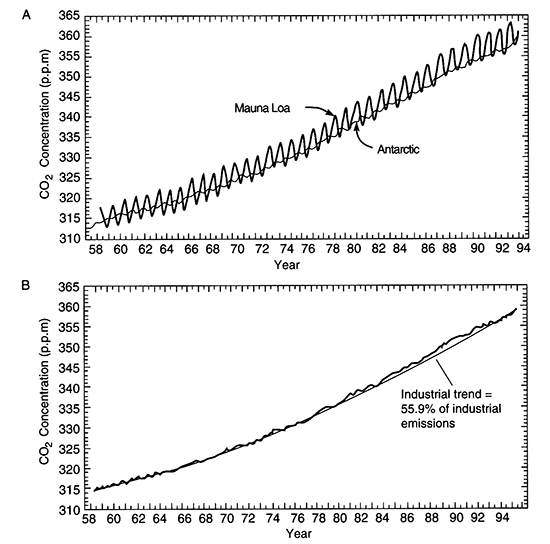
Figure 8.4--Increases in concentrations of selected greenhouse gases since 1750. Concentrations of CO2 and methane, which were relatively constant up until the 1700's, have increased steeply since then due to human activities. Nitrous oxide concentrations have risen since about 1750, with the steepest increases after 1950. CFCs, which are entirely anthropogenic in origin, appeared initially in the 1930's and have increased steeply since 1950; from Houghton et al. (1990).
The Intergovernmental Panel on Climate Change (IPCC) is an international body established in 1988 by the World Meteorological Organization (WMO) and the United Nations Environment Program (UNEP) to review and assess available scientific information on climate change, to assess environmental and socio-economic impacts of climate change, and to formulate response strategies. The IPCC published its initial reports in 1990, and prepared a second series of reports in 1995 (Bruce et al., 1996; Houghton et al., 1996; Watson et al., 1996).
Over the course of its existence, the IPCC has moved from an initial position that anthropogenic climate change is highly probable to its more recent position that "The balance of evidence suggests a discernible human influence on global climate" (Santer et al., 1996). As the data base and scientific consensus supporting the reality of anthropogenic climate change has strengthened, the subject has become more controversial in some political and economic circles, and there is heightened attention to a range of topics that fall under the general classification of global change (see Boxed section 8.3).
Global Change, Global Warming, Climate Change, The Greenhouse Effect--all of these terms and more, with or without adjectives such as "natural," "anthropogenic," "enhanced," etc., are used in news stories and debates. The variety of definitions used and the legitimate scientific uncertainties create confusion that is systematically compounded by those whose political or economic interests would not be served by serious attention to the problems of changing climate (Gelbspan, 1995).
Fortunately, the physical basis for climate concerns is straightforward, and the arguments over temperature effects only serve to highlight the importance of changes in the hydrologic cycle, with which we are primarily concerned.
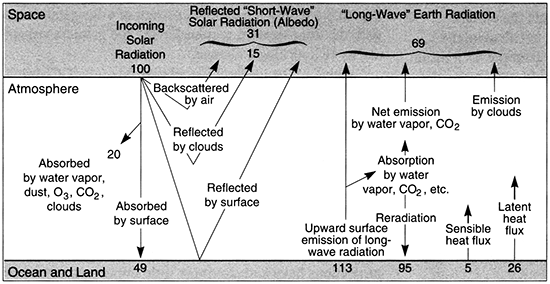
It is known with a high degree of accuracy that the earth receives an annual average of 343 Watts per square meter (W/m2) from the sun (MacCracken et al., 1990). In round numbers, 100 W/m2 are reflected, and 240 W/m2 are absorbed by the atmosphere and land and ocean surface. These 240 W/m2 do the work of driving atmospheric and oceanic circulation, the hydrologic cycle, photosynthesis, etc., and in the process are degraded and re-emitted as infrared radiation (to be in equilibrium, net energy loss must equal net energy gain).
These processes are illustrated in fig. B8.3.1. We also know that the surface temperature of the earth is roughly 15° C., or about 288° K on the absolute (Kelvin) temperature scale. Basic physics and our knowledge that essentially all of the earth's energy comes from the sun tells us that, without feedbacks, there should be about a 1.2° change in surface temperature for a change of one W/m2 absorbed (Houghton et al., 1990).
Figure B8.3.1-Mean annual radiation and heat balance of the atmosphere and earth. Units are assigned so that the incoming solar radiation (343 watts/m2) is set equal to 100 units. "Short-wave" solar radiation has wavelength less than 4 micrometers; "longwave" earth radiation has wavelength greater than 4 micrometers; from Berner and Berner (1996); see also MacCracken et al. (1990).
Just as the energy balance is well understood, so are the atmospheric concentrations of most greenhouse gases (figs. 8.3 and 8.4) and the details of their light- transmission and energy-absorption characteristics. It is possible to calculate with a high degree of accuracy the additional energy absorption due to changing gas concentrations. Table B8.3.1 presents a summary of these calculations for conditions as of 1990 (8erner and Berner, 1996). We can see from this table that the additional "energy forcing" of the climate since the beginning of the Industrial Revolution is substantial--in the simple calculation, equivalent to as much as several degrees of temperature change.
Table B8.3.1--Extra trapping of infrared radiation ΔQ (positive radiative forcing) by excesses of trace atmospheric gases above their preindustrial concentration.
| Gas | Preindustrial Concentration 1765 (ppm) |
Concentration 1990 (ppm) |
Concentration Change per year (%) |
ΔQ (W/m2) |
ΔQ (percent) |
Lifetime (yr) |
|---|---|---|---|---|---|---|
| CO2 | 279 | 354 | 0.5 | 1.5 | 61 | 50-200 |
| CH4 | 0.8 | 1.72 | 0.9 | 0.42 | 17 | 10 |
| Stratospheric H2O | 0.14 | 6 | ||||
| N2O | 0.285 | 0.310 | 0.25 | 0.1 | 4 | 150 |
| CFC-11 | 0 | 0.00028 | 4.0 | 0.062 | 2.5 | 65 |
| CFC-12 | 0 | 0.000484 | 4.0 | 0.14 | 6. | 130 |
| Other CFCs | 0 | 0.085 | 3.5 | |||
| Total | 2.45 | 100 | ||||
| Stratospheric O3 loss | -0.08 | -3.3 |
The fact that this amount of change in air temperature has not yet occurred is one of the sources of debate and confusion about "Global Warming," even though we know that there are major lags in the climate system because of the high heat capacity and slow responses of the oceans and melting ice, and we now realize that some of the predicted warming is being masked by anthropogenic aerosol emissions (Schwartz and Andreae, 1996). Yet when this energy forcing is considered as "Climate Change" rather than simply as "warming," we understand better the implications for water resources. Much of the energy not appearing directly as increased temperature is doing work that changes the hydrologic cycle and the atmospheric and oceanic patterns that redistribute water on the earth's surface.
The energy budget shows that the climate system must be changing, and the modest responses of temperature are very cold comfort indeed for those concerned about water-related issues.
In the late 1980's, as scientific and societal concern about global change was increasing rapidly, atmospheric General Circulation Models (GCMs) were becoming more powerful and more credible. These GCMs are complex numerical computer solutions of the equations that describe the physical interactions within the climate system (see fig. B8.3.1), and are used to calculate the effects of energy budget changes (for example, as a result of doubling atmospheric CO2 concentrations) on the global patterns of temperature and precipitation. As the results of several different approaches to global climate simulation became available, a number of assessments of the effects of climate change on water resources were made. These culminated in major syntheses prepared by organizations such as the U.S. Environmental Protection Agency (USEPA), American Association for the Advancement of Science (AAAS), and the Intergovernmental Panel on Climate Change (IPCC) (Smith and Tirpak, 1989; Tegart et al., 1990; Waggoner, 1990).
Many of the "warmer-world" climate and hydrologic simulations highlight the sensitivity of runoff to relatively minor changes in temperature and precipitation (p. 4-5 to 4-6 in Tegart et al., 1990). An example of this is shown in Boxed section 8.4. Because of Kansas' position at the "balance point" for aridity (see fig. 8.1 and Chapter 1 on Kansas water resources) and water-controlled productivity (fig. B8.1.1), high sensitivity like this points to a particularly high probability of water-supply changes within the state. The authors of numerous chapters in the IPCC 1995 update all point to the special vulnerability to climate change of water resources, agriculture, and freshwater ecosystems in arid or semi-arid environments (Arnell et al., 1996; Kaczmarek, 1996; Reilly, 1996).
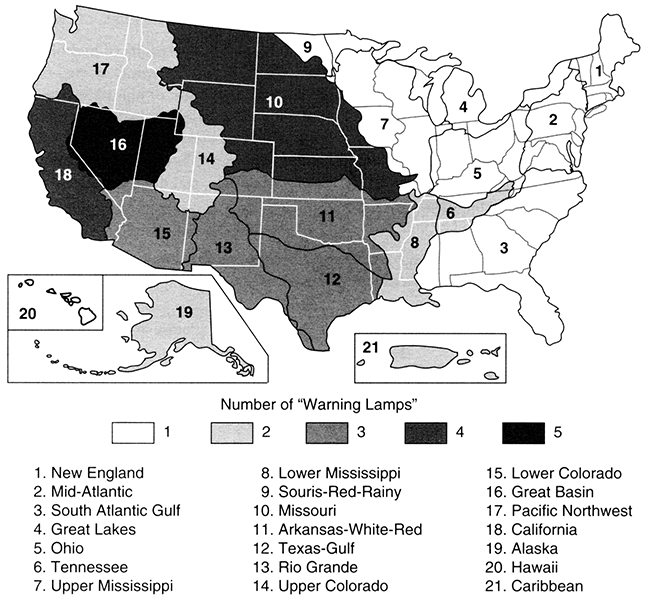
Another study prepared a vulnerability assessment of United States water systems based on storage volume relative to renewable supply, consumptive use relative to available renewable supply, the ratio of hydroelectricity to total electricity, ground-water overdraft relative to total ground-water withdrawal, and variability of streamflow (Gleick, 1990). For each of the five factors considered vulnerable to a change in hydrologic conditions, a basin was awarded a "warning lamp"--the Arkansas-White-Red basin (including southern Kansas) had three lamps "lit," and the Missouri basin (northern Kansas) had four, indicating a relatively high level of potential vulnerability for the state. Figure 8.5 shows the national pattern of vulnerabilities--with the drier western regions having the greatest vulnerability to hydrologic change.
Figure 8.5--Vulnerability to climate change of hydrologic regions (Gleick, 1990). Numbers next to boxes in legend correspond to the number of "warning lamps" judged to be turned on as a result of specific vulnerabilities assessed on the basis of storage volume relative to renewable supply, consumptive use relative to available renewable supply, the ratio of hydroelectricity to total electricity, ground-water overdraft relative to total ground-water withdrawal, and variability of streamflow. In all basins, at least one measure of vulnerability exceeds the warning level. For Kansas, the Missouri basin has four lamps lit, and the Arkansas basin has three- a significant level of estimated vulnerability.
Some of the General Circulation Models (GCMs) indicate increased drying and soil-moisture deficits in the interiors of continents, specifically including North America (Tegart et al., 1990, p. 4-5 to 4-6). Analysis based on historical records has generally focused on the 1930's--the Dust Bowl--as the most likely analogy for future climate (Glantz, 1988). These comparisons, and recognition that runoff and recharge may be extremely sensitive to relatively small changes in the hydrologic cycle, should be disquieting news for Kansas water planners. However, to date the projections have had relatively little impact on water policy and planning, in part because the regional hydrologic estimates from the various GCMs were neither precise nor considered particularly reliable. This is largely due to the coarse-grid scales of the GCM; because they are so computationally intensive, the global models are run with grid cells hundreds of miles on a side and with very simplified surface characteristics. For this reason they cannot resolve convective or cyclonic systems, or topographic features important to local precipitation. Thus vulnerability is estimated on a subcontinent scale, but management is done at the basin scale (Kaczmarek, 1996).
One of the responses to lack of resolution and precision in GCM treatment of such factors as soil moisture and its variability has been to couple the more robust outputs of GCMs (such as temperature and precipitation) to more detailed regional hydrologic models. Gleick (1986, 1987) first applied this method to the Sacramento-San Joaquin basin in California, and Nash and Gleick (1993) subsequently used a similar approach in the Colorado River basin. Both these river basins are highly managed and have a significant component of mountain snowmelt, and the water is fully or largely allocated. Boxed section 8.4, and Table B8.4.1 contained therein, summarize the findings on climate sensitivity of the Colorado River basin.
A striking outcome of these studies that is relevant to discussions of variability (see below) is the effect of shifts in the intra-annual pattern of precipitation and runoff. Climate change scenarios may produce a net increase in annual precipitation and runoff, but if there is a shift to higher peak flows earlier in the year, the result may be less water available because under the new flow regimes, existing reservoirs cannot be operated to preserve both the same storage and the same flood protection for which they were originally designed.
The following excerpts from Nash and Gleick (1993) illustrate the profound effects that seemingly modest changes in temperature or precipitation can have on a highly managed water resource-and the resulting uncertainties in the waterresource outcomes of climate change.
The principal impacts of changes in temperature and precipitation on runoff in the Colorado Basin are summarized below.
In summary, the results of hydrologic modeling suggest that large changes in streamflow may occur in the Colorado River basin as a result of plausible climatic changes. GCM scenarios indicate that runoff in the basin is likely to decrease. The impacts of these potential changes in streamflow would be felt throughout the basin as changes in water deliveries, reservoir storage, and hydroelectricity production.
Table B8.4.1--Sensitivity of water-supply variables to changes in natural flow in the Colorado River basin (Nash and Gleick, 1993), shown in percentages. Values in parentheses represent decreases.
| Change in Natural Flow |
Change in Actual Flow |
Change in Storage |
Change in Power Generation |
Change in Depletions |
Change in Salinity |
|---|---|---|---|---|---|
| -20 | (10-30) | (61) | (57) | (11) | 15-20 |
| -10 | (7-15) | (30) | (31) | (6) | 6-7 |
| -5 | (4-7) | (14) | (15) | (3) | 3 |
| 5 | 5-7 | 14 | 11 | 3 | (3) |
| 10 | 11-16 | 28 | 21 | 5 | (6-7) |
| 20 | 30 | 38 | 39 | 8 | (13-15) |
Whether we forecast by physical model or by historic or paleoclimatic analogies, some kinds of forecasts are easier than others. It is likely (Boxed section 8.3) that the predictable increase in atmospheric energy retention will result in warming, and very likely that warming will speed up the hydrologic cycle on a global basis. An accelerated hydrologic cycle will result in increases in both precipitation and evaporation, but not necessarily in the same places or at the same time--predictions of midcontinent drying reflect the probability that increased precipitation may be concentrated along the trajectories of marine air masses, while evaporation will be more generally distributed.
Since the original IPCC assessments in 1990, our understanding of climate change issues and symptoms has grown faster than anticipated. At that time, it was estimated that it would take a decade or more to confidently identify evidence of anthropogenic climate change (Wigley and Barnett, 1990). Rapid improvements in atmospheric and oceanic modeling, measurement techniques, and methods of data analysis have both shortened the predicted time and increased confidence in predictions (Santer et al., 1996).
However, the details of regional water distribution in time and space are still not yet reliably predictable, and while the fact that oceanic and atmospheric circulation patterns shifted in the 1970's and have not gone back to "normal" (Kerr, 1992; Karl et al., 1995) may argue for the reality of climate change, it also interferes with our ability to use past conditions as an exact model for the future.
In spite of uncertainty about detailed predictions of specific changes in water availability, uncertainty has been drastically reduced in some topical areas. Early in this decade, Karl et al. (1991) estimated that it might be at least another decade before the greenhouse temperature signal could be reliably detected in central North America, and as much as 40 years before the precipitation signal could be discerned. Yet in 1995, two of these same authors (Karl et al., 1995) published an analysis of United States climate trends and stated there is only a 5-10% chance that observed patterns are not the result of climate change. The basis for the turnabout was improved methods of analysis of complex patterns of climate variability.
Karl et al. (1995) present the following adaptation of the IPCC conclusions concerning probable climatic changes for which a credible physical mechanism is understood:
These changes, in rough order of our confidence in the projections, include:
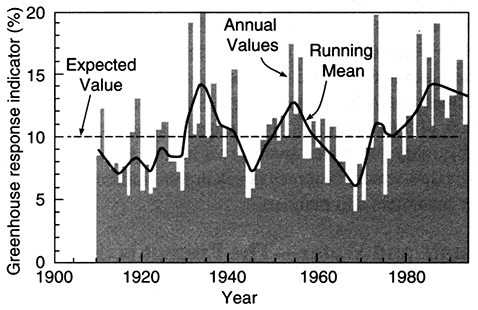
Although no single factor alone would be likely to produce absolutely conclusive evidence of climate change (see Boxed section 8.3), some appropriate combination of the factors should provide much more reliable evidence. Accordingly, the researchers (Karl et al., 1995) created two composite indices--a Climate Extremes Index (CEI), and a Greenhouse Climate Response Index (GCRI). Both are based on data on temperature and precipitation extremes archived at the National Climate Data Center, and both were applied to the records of the conterminous United States over the past century. The results indicate that both the CEI (fig. 8.6) and the GCRI (fig. 8.7) have been above the "expected" (stable climate) value since the 1970's--behavior exhibited only for much briefer periods in the 1930's and 1950's.
Figure 8.6--The historical course of the Climate Extremes Index (CEI) (Karl et al., 1995). This index, based on the proportion of the United States experiencing extreme conditions of temperature or precipitation in a given year, has recently remained above the "stable climate" value for a period roughly three times as long as other positive excursions in the earlier record.
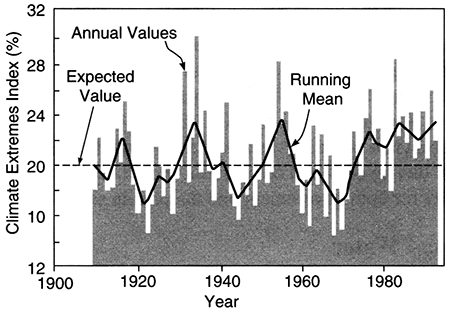
Figure 8.7-The Greenhouse Response Index (GRI), like the CEI (fig. 8.6) shows unusually sustained positive values in recent decades, lending support to the view that anthropogenic climate change is occurring (Karl et al., 1995).
Not only do these analyses lend support to the popular view that weather has been more extreme in recent years, but they approach statistical validation of the reality of greenhouse climate-change trends--as evidenced by the authors' conclusion that there is only a 5-10% chance that the observed United States pattern could be due entirely to natural variation. Indeed, data from even more sensitive regions outside the United States now suggest that there has been a decade-scale shift in high-latitude plant productivity (Myneni et al., 1997).
Water quality is an issue that looms ever larger in societal plans for water use and development. As supplies of good-quality freshwater become more limited or more fully used, we are becoming more painfully aware of the limitations imposed by water-quality problems-some of natural origin, some caused by human waste disposal or contamination, and some the logical consequence of ever more efficient use of available water.
Consumptive use of water results in evaporation of the water, but not of the dissolved salts--so salinity rises with evaporation, and the proportion of water evaporated rises with increased re-use and storage. The problem of soil and water salinization as a result of intensive irrigation is acute in some parts of the country, and is a significant problem in Kansas along parts of the Arkansas River valley. This type of problem can be expected to intensify if climate change increases both irrigation demand and the evaporation rate of the water applied.
Climate change, particularly if it involves longer or more intense dry spells or a shift in the net balance between precipitation and evaporation (fig. 8.1C), may adversely affect the quality of both surface and ground water. The overall topic has been reviewed (Jacoby, 1990), and Boxed section 8.4 contains examples of salinity effects calculated for the Colorado basin.
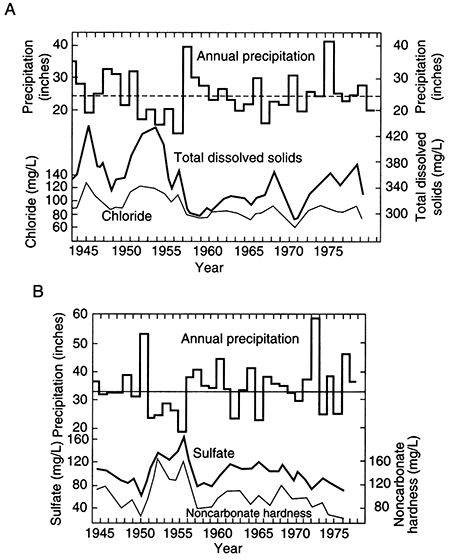
In Kansas, the effects of precipitation and recharge on ground-water quality have been studied (McGregor et al., 1988; Whittemore et al., 1989). Figure 8.8 shows the relationship between precipitation and water-quality variations in two municipal supplies obtained from shallow alluvial aquifers. The prospect of climate-induced water quality and water quantity variations in both surface- and ground-water resources poses major challenges for water managers and planners.
Figure 8.8--Variation in water-quality parameters for public water supplies drawn from two aquifer systems in Kansas. (A) Havensville in northeastern Kansas; precipitation values are shifted six months to the right to demonstrate the match with sulfate and non-carbonate hardness. (B) Arlington in south-central Kansas; precipitation data are shifted three years to the right in this case. The curve matches show the effect of dry periods on water quality of ground water; the time lag (curve shift) in the two cases reflects the differences in recharge pathways and residence times in the two areas; from Whittemore et al. (1988).
An emphasis on variability and a recognition that climate change is very probably already a fact of life brings some perspectives into focus. Regardless of what long-term averages do, we can expect greater seasonality of precipitation, more frequent and intense extreme events (storms), more floods, and possibly more droughts (Arnell et al., 1996; Kaczmarek, 1996; Karl et al., 1997).
The reliability of reservoir yields and surface-water rights will almost certainly decrease because of shifts in the seasonality and patterns of runoff. Soil-moisture deficits in summer and fall are likely to increase--if not on average, then at least in terms of the number of dry years (Arnell et al., 1996). Demand for ground water is likely to increase, especially for the critical irrigated component of world agriculture (Reilly, 1996); whether recharge increases or decreases will depend on complex local combinations of land use and climatic factors. Long-term sustainable yield of the integrated hydrologic system is likely to decrease, and with it the reliability of regional water-resource systems (Kaczmarek, 1996); an increase in the frequency of periods in which yields once considered "safe" can not be assured or delivered seems highly probable.
The analyses of Karl et al. (1997) provide a statistical basis for estimating the new climate norms, and from that, event probabilities. Using these revised norms and probabilities, hydrologic principles and the earlier analyses of hydrologic-system responses can be applied to develop new comparisons of probable demand and probable supply. Because the mismatch is likely to be greater than at present and because water is critical to the state's wellbeing, this revision and comparison should be a high priority for both government and the private sector.
This chapter has focused primarily on climate and hydrology. Climate change has collateral impacts on many aspects of life through nonaqueous mechanisms as well. An area of particular concern to Kansas is agriculture, which uses by far the largest fraction of water consumed within the state (see table 1.3, chapter 1 on Kansas water resources ).
The effects of climate change on agriculture also have been intensively studied on a variety of levels (Adams et al., 1990; Kaiser and Drenne, 1993; Peterson and Keller, 1990; Rosenzweig and Parry, 1994). Although water is an important component of these analyses, there are many others, ranging from government policies to climatic effects on the distribution of pests and diseases. Even the climate-change expectations listed above have other detrimental effects; drier summers and more intense rains will increase the losses associated with soil erosion (O'Hara et al., 1993; Pimentel et al., 1995). Perhaps more intriguing than the model-based studies cited are actual global data indicating that world grain yields may have increased in variability as they have increased in average amount (Naylor et al., 1997).
The complexity of responses to change in a natural system--even a highly altered and managed "natural" system like agriculture--is great. Boxed section 8.5 presents a still-oversimplified chain of relationships that starts with water on the farm and ends with the carbon cycle responses of the global ocean. The optimists will see each new interaction as an opportunity for correction of problems; the author of this chapter is a pessimist who finds it difficult to see how changing the natural environment won't be disruptive to a society and an economy that have been optimized for conditions as they were.
At first glance it seems straightforward to assess the effects of climate change on the sustainable yield of water resources--just figure out how it affects recharge and runoff. We have already seen some of the problems that lie just below the surface of that approach-the amount of usable water is not determined just by annual totals, but also by when, where, and how it arrives.
For a further glimpse of some of the complications, let us run through a series of arguments that arise when we look at climate-change effects on agriculture, which is by far the largest user of water in Kansas.
If we take some of the more worrisome predictions of climate models--a shift in seasonal patterns of precipitation away from the growing season, and increased soil moisture deficits in the midcontinent region--we might conclude that demand will rise faster than supply, and that we are facing the prospect of decreased production and/or increased resource depletion.
However, tests have shown that higher CO2 levels increase growth and productivity of some plants, and even more importantly, may increase water-use efficiency. An optimistic view of these observations would assert that it will all balance out and we need not worry.
Unfortunately, the chain of counter-arguments does not stop here. There are multiple further complications. One is that the increase in water-use efficiency is per unit leaf area--the water use per unit ground area may increase rather than decrease if canopy cover increases (also a potential effect of CO2 fertilization). Another is that it is not just food crops that benefit from CO2; weeds do too, and both insect pests and crop diseases are likely to thrive in warmer climates (Reilly, 1996). This may point to a need for increased biocide use in a high-CO2 environment. A third complication is that CO2 fertilization may boost carbohydrate production, but the plants will not have a matching increase in other nutrients such as nitrogen and phosphorous--so even if gross production goes up, nutritional value and palatability of the product could decline unless fertilization is increased (Allen-Diaz, 1996).
Agricultural chemicals are a major source of water-quality concern in Kansas (see chapters on water-quality and water-resource issues), and efforts are being made to decrease their use rather than increase it, as might be required to compensate for the effects of CO2 and warming. On a larger scale, changes in the nitrogen cycle caused by land use and agriculture are an important feature of "global change" that feeds back into climate issues because the health and nutrient supply of the world's oceans are likely to have a major longterm effect on their exchange of carbon dioxide with the atmosphere (Turner and Rabalais, 1991).
The moral of the story: we cannot stop examining the problem just because we get to an answer that we like, or think we understand.
The evidence summarized in this chapter strongly suggests that we are entering a somewhat warmer and definitely more variable global climate. Sustainable water yields mayor may not be reduced in the long-term average, but they will almost certainly be less reliable in the short term. Extreme events--floods, droughts, storms--will be more frequent occurrences. Climate warming may increase demand for water at a rate even greater than that predicted on the basis of economic development.
Kansans, whether animal, vegetable, or mineral, have a long history of adapting to climate variability. Human Kansans have chosen to adapt by managing both surface-water and ground-water supplies to reduce and mitigate natural variability. In doing so, they have worked with the climate and resources that they found, building reservoirs or well fields and awarding water rights that are consistent with the climate-as-it-was. These rights and structures--or at least their present mode of operation--can not be expected to yield the same results in the now- and- future-climate.
Change is generally uncomfortable, but it need not be disastrous. Action taken now can prepare the state and its citizens to mitigate the worst effects of climate change and take advantage of possible benefits. The following list, although necessarily limited and incomplete, indicates some of the possible approaches.
Adams, R. M., Rosenzweig, c., Peart, R. M., Ritchie, J. T., McCarl, B. A., Glyer, J. D., Curry, R. B., Jones, J. W., Boote, K. J., and Allen, L. H., Jr., 1990, Global climate change and U.S. agriculture: Nature, v. 345, May 17, 1990, p. 219-224
Allen-Diaz, B., 1996, Rangelands in a changing climateImpacts, adaptations, and mitigation; in, Climate Change 1995--Impacts, Adaptation, and Mitigation of Climate Change, Scientific-Technical Analysis, R. T. Watson, M. C. Zinyowera, R. H. Moses, and D. J. Dokken, eds.: Cambridge, Cambridge University Press, p. 131-158
Arnell, N., Bates, B., Lang, H., Magnuson, J. J., and Mulholland, P., 1996, Hydrology and freshwater ecology; in, Climate Change 1995--Impacts, Adaptation, and Mitigation of Climate Change, Scientific-Technical Analysis, R. T. Watson, M. C. Zinyowera, R. H. Moses, and D. J. Dokken, eds.: Cambridge, Cambridge University, p. 325-363
Berner, E. K., and Berner, R. A., 1996, Global environmentWater, air, and geochemical cycles: Upper Saddle River, New Jersey, Prentice-Hall, 376 p.
Blanchon, P., and Shaw, J., 1995, Reef drowning during the last deglaciation-Evidence for catastrophic sea-level rise and ice-sheet collapse: Geology, v. 23, p. 4-8
Bond, G. c., and Lotti, R., 1995, Iceberg discharges into the North Atlantic on millennial time scales during the last glaciation: Science, v. 267, p. 1,005-1,010
Bruce, J., Lee, H., and Haites, E., 1996, Climate change 1995--Economic and social dimensions of climate change; in, Climate Change 1995--Impacts, Adaptation, and Mitigation of Climate Change, Scientific-Technical Analysis, R. T. Watson, M. C. Zinyowera, R. H. Moses, and D. J. Dokken, eds.: Cambridge, Cambridge University Press
Delacourt, H. R., and Delacourt, P. A., 1991, Quaternary ecology--A paleoecological perspective: New York, Chapman & Hall, 242 p.
Gelbspan, R., 1995, The heat is on: Harper's Magazine, v. 291, no. 1,747, p. 31-37
Glantz, M. H., 1988, Societal responses to regional climatic change--Forecasting by analogy: Boulder, Colorado, Westview Press, 428 p.
Gleick, P. H., 1986, Methods for evaluating the regional hydrologic consequences of global climatic changes: Journal of Hydrology, v. 88, p. 97-116
Gleick, P. H., 1987, Regional hydrologic consequences of increases in atmospheric CO2 and other trace gases: Climatic Change, v. 10, p. 137-161
Gleick, P. H., 1990, Vulnerability of water systems; in, Climate Change and U. S. Water Resources, P. E. Waggoner, ed.: New York, John Wiley & Sons, p. 223-240
Goodin, D. C., Mitchell, J. E., Knapp, M. c., and Bivens, R. E., 1995, Climate and weather atlas of Kansas--An introduction: Kansas Geological Survey, Educational Series 12, 24 p.
Houghton, J. J., Meiro Filho, L. G., Callander, B. A., Harris, N., Kattenberg, A., and Maskell, K., 1996, Climate change 1995--The science of climate change; in, Climate Change 1995--Impacts, Adaptation, and Mitigation of Climate Change, Scientific-Technical Analysis, R. T. Watson, M. C. Zinyowera, R. H. Moses, and D. J. Dokken, eds.: Cambridge, Cambridge University Press, xii + 572 p.
Houghton, J. T., Jenkins, G. J., and Ephraums, J. J., 1990, Climate change-The IPCC assessment: Cambridge, Cambridge University Press, 365 p.
Imbrie, J., and Imbrie, J. Z., 1980, Modeling the climate response to orbital variations: Science, v. 207, no. 29, February 1980, p. 943-953
Jacoby, H. D., 1990, Water quality; in, Climate Change and U. S. Water Resources, P E. Waggoner, ed.: New York, John Wiley & Sons, p. 307-328
Kaczmarek, Z., 1996, Water resources management; in, Climate Change 1995--Impacts, Adaptation, and Mitigation of Climate Change, Scientific-Technical Analysis, R. T. Watson. M. C. Zinyowera, R. H. Moses, and D. J. Dokken, eds.: Cambridge, Cambridge University Press, p. 469-486
Kaiser, H. M., and Drennen, T. E., 1993, Agricultural dimensions of global climate change: Delray Beach, Florida, St. Lucie Press, 311 p.
Karl, T. R., Heim, R. R., and Quayle, R. G., 1991, The greenhouse effect in central North America--If not now, when?: Science, v. 251, March 1, 1991, p. 1,058-1,061
Karl, T. R., Knight, R. W., Easterling, D. R., and Quayle, R. G., 1995, Trends in U. S. climate during the twentieth century: Consequences, Spring 1995, p. 3-12
Karl. T. R., Nichols, N., and Gregory, J., 1997, The coming climate: Scientific American, v. 276, May 1997, p. 78-83
Keeling, C. D., Whorf, T. P., Wahlen, M., and van der Plicht, J., 1995, Interannual extremes in the rate of rise of atmospheric carbon dioxide: Nature, v. 375, no. 22, June 1995, p. 666-670
Kerr, R. A., 1992, Unmasking a shifty climate system: Science, v. 255, March 20, 1992, p. 1,508-1,510
Kuchler, A. W., 1974, A new vegetation map of Kansas: Ecology, v. 55, no. 3, p. 586-604
MacCracken, M. C., Budyko, M. 1., Hecht, A. D., and Izrael, Y. A., 1990, Prospects for future climate--A special US/USSR report on climate and climate change: Chelsea, Michigan, Lewis Publishers, Inc., 270 p.
McGregor, K. M., Marotz, G. A., and Whittemore, D.O., 1988, Ground-water quality prediction using climatic indices: Water Resources Bulletin, v. 24, no. 1, p. 43-48
Myneni, R. B., Keeling, C. D., Tucker, C. J., Asrar, G., and Nemani, R. R., 1997, Increased plant growth in northern high latitudes from 1981 to 1991: Nature, v. 386, no. 17 April 1997, p. 698-702
Nash, L. L., and Gleick, P. H., 1993, The Colorado River basin and climatic change--The sensitivity of streamflow and water supply to variations in temperature and precipitation: U.S. Environmental Protection Agency, Report EPA 230-R-93-009, Washington, D.C., 91 p., plus appendices
Naylor, R., Falcon, W, and Zavaleta, E., 1997, Variability and growth in grain yields, 1950-1994--Does the record point to greater instability?: Population and Development Review, v.23, no. 41-58
Norwine, J., Giardino, J. R., North, G. R., and Valdes, J. B., 1995, The changing climate of Texas-Predictability and implications for the future: College Station, Texas, Cartographies, v + 348 p.
O'Brien, S. R., Mayewski, P A., Meeker, L. D., Meese, D. A., Twickler, M. S., and Whitlow, S. I., 1996, Complexity of Holocene climate as reconstructed from a Greenland ice core: Science, v. 270, no. 22, December 1995, p. 1,962-1,964
O'Hara, S. L., Street-Perrott, F. A., and Burt, T. P., 1993, Climate change and soil erosion: Nature, v. 364, July 15, 1993, p. 197
Peterson, D. F., and Keller, A. A., 1990, Effects of climate change on U.S. irrigation: Journal of Irrigation and Drainage Engineering, v. 116, no. 2, p. 194-210
Pimentel, D., Harvey, C., Resosudarmo, P., Sinclair, K., Kurz. D., McNair, M., Crist, S., Shpritz, L., Fitton, L., Saffouri, R., and Blair, R., 1995, Environmental and economic costs of soil erosion and conservation benefits: Science, v. 267, February 24, 1995, p. 1,117-1,131
Reilly, J., 1996, Agriculture in a changing climate--Impacts and adaptation; in, Climate Change 1995--Impacts, Adaptation, and Mitigation of Climate Change, Scientific-Technical Analysis, R. T. Watson, M. C. Zinyowera, R. H. Moses, and D. J. Dokken, eds.: Cambridge, Cambridge University Press, p. 427-467
Rosensweig, C., and Parry, M. L., 1994, Potential impact of climate changes on world food supply: Nature, v. 367, January 13, 1994, p. 113-138
Santer, B. D., Wigley, T. M. L., Barnett, T. P., and Anyamba, E., 1996, Detection of climate change and attribution of causes; in, Climate Change 1995--The Science of Climate Change, J. T. Houghton, L. G. Meiro Filho, B. A. Callander, N. Harris, A. Kattenberg, and K. Maskell, eds.: Cambridge, Cambridge University Press, p. 407-443
Schwartz, S. E., and Andreae, M. O., 1996, Uncertainty in climate change caused by aerosols: Science, v. 272, no. 5265, May 24, 1996, p. 1,121-1,122
Shortridge, J. R., 1995, Peopling the Plains--Who settled where in frontier Kansas: Lawrence, University Press of Kansas, xvii + 254 p.
Smith, J. B., and Tirpak, D., 1989, The potential effects of climate change on the United States: U.S. Environmental Protection Agency, Report EPA-230-05-89-D50, Washington, D.C., 413 p.
Stuiver, M., Grootes, P. M., and Brazunias, T. F., 1995, The GISP2 δ18O climate record of the past 16,500 years and the role of sun, ocean, and volcanoes: Quaternary Research, v. 44, p. 341-354
Tegart, W J. M., Sheldon, G. W, and Griffiths, D. C., 1990, Climate change--The IPCC impacts assessment: Canberra, Australian Government Publishing Service, xv + 308 p.
Turner, R. E., and Rabalais, N. N., 1991, Changes in Mississippi River water quality this century: BioScience, v. 41, no. 3, p. 140-147
Waggoner, P. E., 1990, Climate change and U.S. water resources: New York, John Wiley & Sons, 496 p.
Watson, R. T., Zinyowera, M. C., Moses, R. H., and Dokken, D. J., 1996, Climate change 1995--Impacts, adaptation, and mitigation of climate change, scientific-technical analysis: Cambridge, Cambridge University Press, x + 879 p.
Whittemore, D.O., Mc Gregor, K. M., and Marotz, G. A., 1989, Effect of variations in recharge on ground-water quality: Journal of Hydrology, v. 106, p. 131-145
Wigley, T. M. L., and Barnett, T. P., 1990, Detection of the greenhouse effect in the observations; in, Climate Change--The IPCC Assessment, J. T. Houghton, G. 1. Jenkins, and J. J. Ephraums, eds.: Cambridge, Cambridge University Press, p. 239-256
Previous--Effects of Agriculture on Water Yield in Kansas || Next--Managing Uncertainty in Yield Estimates
Kansas Geological Survey
Comments to webadmin@kgs.ku.edu
Web version placed online May 6, 2013. Original publication date 1998.
URL=http://www.kgs.ku.edu/Publications/Bulletins/239/Buddemeier/index.html