Previous--Yield Estimates for Surface-water Sources || Next--Climate Change and Sustainable Water Yield
This article available as an Acrobat PDF file (336 kb).
Most of the land area of Kansas (over 90%) is used for agricultural purposes. Nearly all of the potential water supply for Kansas (98%) comes from precipitation onto the land surface. The amount of precipitation averages about 28 inches (70 cm) per year over the state. The primary source of water resources available over the long term for other users in the state is runoff and percolation from the precipitation that falls on agricultural land within the state. Therefore, the activities of agriculture to use and manage the land playa role in affecting the amount and quality of water available for water-resource purposes. Effects of agriculture on water yield are of particular interest because the prior appropriation doctrine is used to allocate water rights. Therefore, understanding how agricultural activities influence the quantity of water lost from agricultural lands is crucial to account for the effects of more efficient use of water from precipitation as well as to decide how much water is potentially available for appropriation by other users.
Effects of agriculture on water yield have been of interest for many years. In much of the state, natural ecosystems, particularly prairies, have been converted to agricultural production of cultivated crops. Two important changes occur. First, surface runoff is increased because the potential for loss by runoff is increased from soil that is bare or partially bare during the cropping cycle. Bare soil has a lower rate of infiltration than the same soil covered with growing plants or crop residue. Second, actual evapotranspiration is decreased because annual crops are actively growing for a shorter period of the year than perennial plants. This increases the potential for percolation and subsequent recharge. The exact effects of these changes depend upon the interactions of the climate, soil, and agricultural-management practices including those of soil and water conservation at a particular location.
In most of the state, water supply is limited because precipitation usually is less than potential evapotranspiration for much of the growing season. The success of dry land agricultural technology hinges on its ability to use precipitation as effectively as possible by a combination reducing runoff and increasing the amount of water used as evapotranspiration through useful crops. Additionally, where ground water is available, making use of it is usually very desirable.
The necessity to control wind and water erosion and improve water management was soon recognized in Kansas agriculture. Conservation techniques began to emerge in the 1930's following the disastrous drought. National programs to reduce erosion soon were developed. Kansas has been a leader in the adoption of soil- and waterconserving techniques including terracing, conservation tillage, farm ponds, and watershed dams. A terrace is a broad channel, bench, or embankment constructed across the slope to intercept runoff and to detain the water or to channel the excess water to protected outlets for disposal from the field. Conservation tillage is a practice that uses mechanical or chemical means to control weeds and/or plant crops such that plant residues cover at least 30% of the soil surface to promote wind- and water-erosion control and moisture conservation.
To quantify the effects of agriculture, several factors that interact must be considered--climate, soil, and agricultural-management practices which include type of land use, production practices, and conservation practices. Ideally, there would have been field experiments conducted to determine these effects. However, few have been done, and the length of time the experiments were operated were often insufficient to understand the interactions of all of the factors. Thus, simulation-modeling techniques have been required to obtain estimates of effects and to explain the effects on the availability of water resources in the state. The remainder of this chapter focuses on the development of a model, the results from a specific study, and a broader interpretation of those results for the entire state.
In the 1960's, the U.S. Department of Agriculture Soil Conservation Service (SCS), now known as the Natural Resources Conservation Service (NRCS), and Agricultural Research Service (ARS) used ajoint task force to develop procedures to assess the effects of land and watershed treatment on streamflow. Land and watershed treatment include change in land use from cropland to permanent cover crops such as native or tame grasses, structural measures such as terraces, tillage and surface-residue management, irrigation, farm ponds and watershed dams. The result was a rational approach based upon annual amounts of precipitation, a climatic variable, extent of land-use changes and conservation practices and other factors. At the time this work was done, however, the effectiveness of residue management was uncertain and the extent of future use of land treatment and other conservation practices was not well known. The procedure, however, has been used by the NRCS, and it did serve as a good basis for future work on the effects of land treatment on water yield. One major limitation of the procedure, however, was that the effects of land treatment and conservation practices on a continuous basis on water yield could not be determined easily. In particular, the variability from year to year in climate could not be accounted for very well with the rational technique.
Continuous computer-simulation modeling allows questions about effects of changes in land use, crops, and management practices to be assessed at various locations over a simulation period of many years. While direct comparison with measured results from field experiments are not possible because such measurements have not been made on whole watersheds, results can be compared with measured streamflow if conditions in a drainage area are simulated for a period of time. In the late 1960's, water yield into several flood-control and irrigation-supply western Kansas reservoirs that had been built in the 1950's was much less than expected. When well-above-average amounts of precipitation that occurred in the early 1970's did not result in expected inflows to these reservoirs, the Bureau of Reclamation began a study of the Solomon River basin in Kansas to identify what was happening to the water supply. Speculation implicated changes in land use and soiland water-conservation practices, changes in the precipitation regime, and increased use of ground water from alluvial aquifers were involved. Work began at Kansas State University to develop a method to assess the effects of land use and soil- and water-conservation practices on water yield on a watershed basis.
When a method was needed to assess the effects of land use and conservation practices on large watersheds for the Bureau of Reclamation, a continuous computer simulation model, called the Potential Yield (POTYLD) (Koelliker et al., 1981, Koelliker et al., 1982), was developed for this purpose. POTYLD simulates the daily change in the water budget for different climatic and landuse conditions to estimate the dispensation of precipitation as interception, runoff, actual evapotranspiration, percolation, and change in water content in the soil. The model utilizes values of runoff curve numbers (RCN) to predict the split between runoff and infiltration for land uses from daily amounts of rainfall and snowmelt (See chapter I for more information on RCN values). Individual land uses and conservation-practice conditions can be described by a RCN, and the RCN technique is used widely to predict runoff from design storms. It follows that the RCN method can predict runoff over a period of time provided the antecedent moisture condition (AMC), how wet the soil was at the time of each storm, can be determined. This technique to assess runoff through a computer-simulation model is now used widely in watershedsimulation models. Recently, POTYLD has been modified to include additional refinements and to include irrigation; consequently, the name was changed to Potential Yield Revised (POTYLDR) (Koelliker, 1994a, 1994b). This model simulates the water budget on a daily basis for different land uses and estimates the water yield on a monthly or annual basis for a drainage area. A more comprehensive description of POTYLDR can be found in Appendix 7.A of this chapter.
The POTYLDR model is useful to estimate effects of land-use changes and agricultural soil-water conservation practices on surface-water yield and on percolation. Exact comparisons with data from the field are difficult because such data are very limited. The following section does provide the results of a comprehensive study to combine all impacts on water yield into Webster Reservoir along with estimates of the effects across the state. Extended use of the POTYLDR model for other studies, too, provides evidence that it reasonably documents real effects that have been and are being experienced in Kansas.
Several studies have been done with POTYLD. The most extensive was for the South Fork of the Solomon River basin above Webster Reservoir in northwest Kansas (Koelliker et al., 1981). Webster Reservoir, located on the South Fork of the Solomon River in Rooks County, has a watershed of 1,150 mi2 (2,980 km2; fig. 7.1). It was completed in 1956, primarily to serve as a water supply for an 8,400-acre (3,400-ha) irrigation district and to control flooding and to provide recreation. After about 1975, however, the irrigation district seldom received a full delivery of water, and in several years no water was delivered. At streamflow-gaging stations in the region with 30 or more years of records, average streamflow during the 1970's was less than 25% of the long-term average. A report by the Bureau of Reclamation (1984) concluded that phreatophytes, water-loving plants, and changes in the nature of precipitation events were not important contributors to the declining streamflow. That same report did, however, conclude that withdrawal of ground water from the alluvial aquifer was an important contributor. The largest effect by far upon declining streamflow was that of soil- and water-conservation practices, a finding substantiated by POTYLD.
Figure 7.1--Map of the South Fork Solomon River basin (Koelliker et al., 1981).
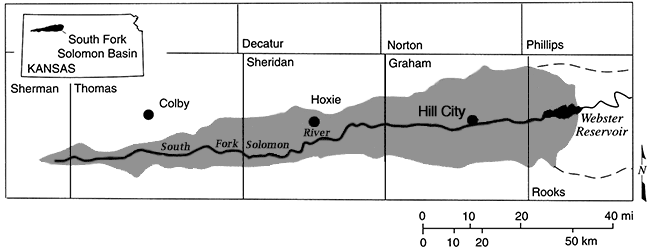
Figure 7.2 shows streamflow for two conditions along with measured streamflow into Webster Reservoir for a period when both daily precipitation and streamflow were available for the study. The curve labeled "1950" represents the expected streamflow into Webster Reservoir if conditions above the reservoir had remained unchanged after 1950 until the end of the simulation period in 1978. The curve labeled "changing" accounted for changes in land use, conservation practices, and ground-water withdrawals during the period simulated. A 3-year moving average is used because of limited availability of continuous weather records to represent the area. Rainfall is spatially quite variable because of the continental-type climate in the area. Because long-term changes were of interest, averaging shows the trend more clearly.
Figure 7.2--Comparison of the three-year moving average actual streamflow above Webster Reservoir with streamflow predicted with changing conditions, and when 1950 conditions were held constant (adapted from Koelliker et al., 1981).
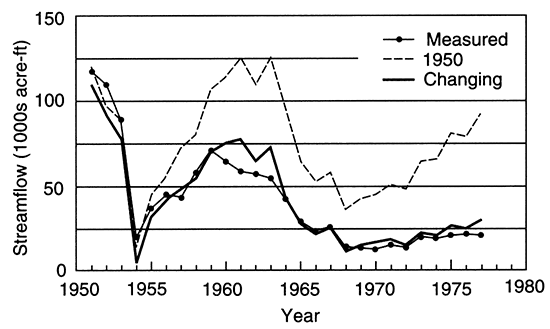
The results of the study showed that by 1980, the expected water yield into Webster Reservoir was predicted to be less than half the historic inflow (1920-1955) of 50,900 acre-feet/year (62.8x10⁶ m3/yr). The Bureau of Reclamation reported the inflow to Webster Reservoir for the period, 1979-1988, averaged 13,300 acre-feet/year (16.4x10⁶ m3/yr; Kutz, 1990), which further substantiated the results obtained by the use of POTYLD.
Fluctuations in all three curves in fig. 7.2 are caused by temporal changes in amounts of precipitation and the ability of that precipitation to produce runoff. Amounts of individual rainfall events and their timing and aerial distribution are critical to the production of runoff. Continuous simulation is very helpful to evaluate fluctuations in streamflow because it can account for conditions in the watershed when precipitation occurs. By aggregating results from several sub-basins for a stream, the aerial distribution also can be accounted for partially. This is very helpful to describe the impact of precipitation on yield. A study of the Upper Republican River basin of northeastern Colorado, southern Nebraska, and northwestern Kansas was done using POTYLD as a major component of the work (Koelliker et al., 1983). While changes in precipitation regime appear to be occurring in the Great Plains, the length of record (1920-1978) available for that study did not show it. When POTYLD was used with 1950 basin conditions held constant, essentially no decrease in water yield with time was expected. A more recent study to estimate the future water supply for the Cheyenne Bottoms Wildlife Refuge, which comes from streamflow originating in west-central Kansas, showed a difference attributable to precipitation. For the period 1973-1988, the ability of precipitation to produce streamflow from this drainage basin was about 27% below that for the earlier period 1948-1972 (Koelliker, 1991).
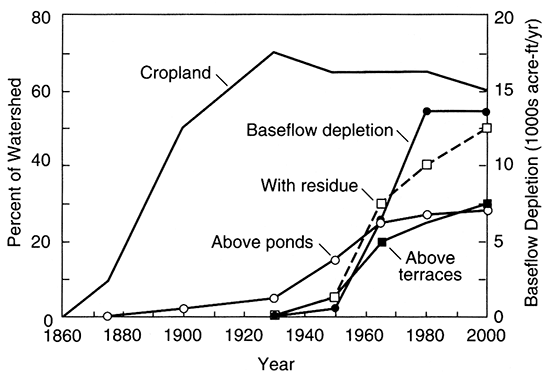
An historical view of land use and development of agricultural technology on streamflow can be done by simulating for many years with conditions in the watershed fixed at given points in time. Then, the average of the results can be graphed against time to see if there are trends and effects. Such an analysis was done for the South Fork of the Solomon River above Webster Reservoir. In addition, the effects of changes in land use, conservation practices, and ground-water withdrawals during the period show the estimated impact of agriculture on water yield (fig. 7.3) (Koelliker, 1984). Initially, the watershed was all rangeland before 1850. Figure 7.4 shows the important changes with time that have occurred in the watershed. Agriculture was started around 1860 and by about 1930, 70% of the watershed was cropland. Drought and erosion has caused some cropland to be put back to grass since 1930. Development and adoption of conservation practices have progressed since the 1930's. From the early 1950's, development of ground-water resources has reduced baseflow in the stream. In the future, amounts of surface-water yield will be less than the amount estimated for conditions before agricultural development began.
Figure 7.3--Historical perspective of the effect of agricultural technology on water yield above Webster Reservoir showing increases caused by conversion to cropland and depletions caused by various soil- and water-conservation practices and changes in agricultural technology (adapted from Koelliker, 1984).
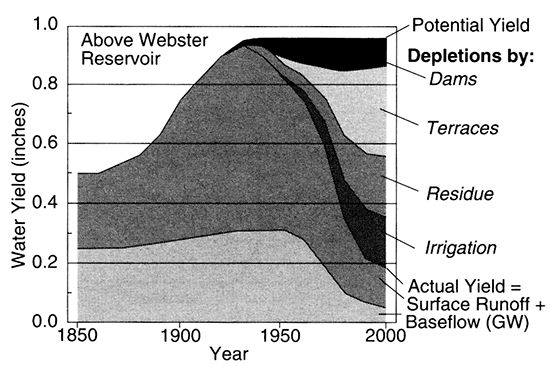
Figure 7.4--Historical amounts of cropland, conservation practices, and baseflow depletions in the South Fork Solomon Basin above Webster Reservoir (adapted from Koelliker, 1984).
In fig. 7.3, the line labeled POTENTIAL YIELD represents an estimate of the total streamflow from the watershed if agricultural land use and practices in the 1930's had remained in place. That period is chosen only because it was the set of conditions in the last 150 years that produced the greatest streamflow. Records from that period also probably influenced the design conditions that were used for the development of Webster Reservoir and its original operations plan. The line labeled ACTUAL YIELD represents the expected amount of streamflow into the reservoir as affected by the changing conditions in the watershed. This line does not imply that water yield does not fluctuate from year to year. It shows an expected average for a given date that would have resulted if the precipitation from 1920 to 1978 had occurred on the watershed when it was in a particular set of conditions that were in place on that date. The split of the actual yield into surface runoff and ground water is an estimate based upon the types of land use with time and the effects of withdrawals of ground water for irrigation.
The contributions of the various soil- and water-conservation practices are estimated with time on the graph. Dams are stockwatering and erosion control structures that create features commonly known as farm ponds. These farm ponds in aggregate collect runoff from over one-third of the watershed. Terraces have been installed on nearly one-half of the cropland in the watershed to reduce water erosion and to improve moisture conservation. Here, residue refers to a variety of agricultural-management practices to keep the soil surface partially or totally covered with plant residue to reduce potential for water and wind erosion. Conservation tillage of various kinds is the most widely used practice. Irrigation is used to describe the effects of withdrawals of ground water from the alluvial aquifer. Nearly all the water withdrawn is subsequently lost as evapotranspiration from the irrigated areas.
The latest conditions in the watershed above Webster Reservoir have not been studied with POTYLDR. Further evidence of the effects of agriculture on water yield appeared from the flood of 1993. This flood and the precipitation that caused it were remarkably similar to the flood year of 1951 (see chapter 1 comparison of 1951 and 1993 floods). Although the reservoir was not completed in 1951, the streamflow-gaging station just upstream was operational and estimates of the inflows to the reservoir had the lake existed have been made for that period by the Bureau of Reclamation. Figure 7.5 shows the precipitation and inflow to Webster Reservoir on a monthly basis for both floods. The amount of inflow in 1993 was essentially half the amount in 1951. This points out that even in years with high precipitation, the effects of agriculture on watersheds in the western half of Kansas can be and are substantial.
Figure 7.5--Comparison of monthly inflow to Webster Reservoir for the floods of 1951 and 1993.
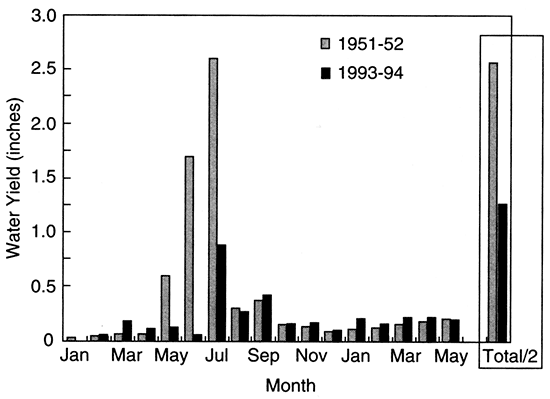
At the same time that runoff is reduced, more water is added to the soil to aid subsequent crop production and to add to percolation. At Webster Reservoir, the amount of basetlow into the reservoir appears to be higher than in 1951. Some of the water that did not leave as runoff is slowly seeping from the watershed and reaching the reservoir. Much more of the seepage water may be being used to satisfy ground-water withdrawals in the alluvial aquifers that are above the reservoir.
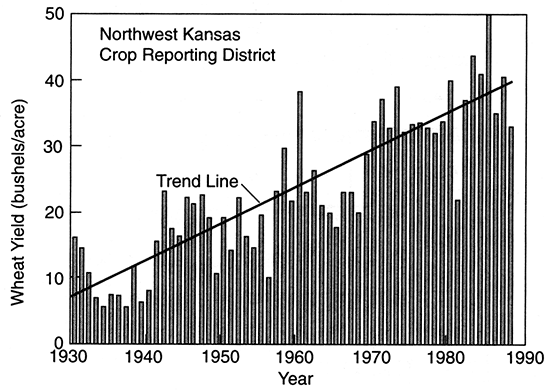
The impact of agriculture on available water resources for other uses above Webster Reservoir has been substantial. At the same time, however, the water that was lost previously has been converted into more production on the land where it fell. This fact is based upon yield of wheat on dryland in the Northwest Crop Reporting District, which includes the watershed above Webster Reservoir (fig. 7.6) (State Board of Agriculture, 1989, and previous). Wheat yields have increased steadily since the 1930's. This is the result of better agricultural technology, which includes better varieties, fertilizer and herbicides, and management practices. All of these factors, however, are benefitted by more available water. In this area, the USDA ARS estimates that about 40% of the total increase in agricultural production can be attributed to better water conservation.
Figure 7.6--Dryland wheat yields in the northwest Kansas crop reporting district (data from Kansas State Board of Agriculture).
There is a tradeoff here between more agricultural production on dry land and water resources available for users downstream. This work points out that the availability of water resources may not be constant over time. It will be necessary to make adjustments in water use so that the demand is more in line with the supply. As Robert Ingersoll, a 19th century orator from Kansas, stated, "In nature there are no rewards or punishments--there are consequences."
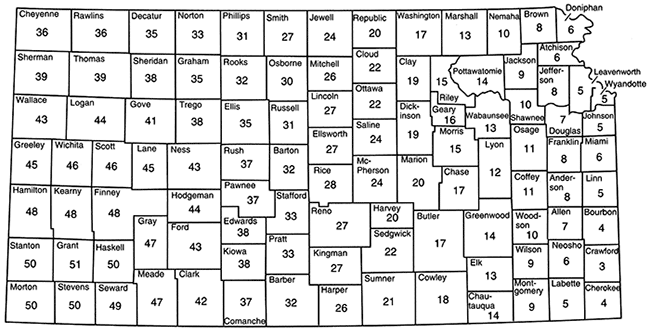
Agriculture and agricultural land-use changes are affected by location in the state. The POTYLDR model has been used for several studies in Kansas, and from those general results, inferences can be drawn about the effects of agriculture on water resources in the state. One of the most important aspects that influences the magnitude of land-use changes is that the climate at a particular location can be described by the moisture deficit (MD). The MD is defined as the difference between the average annual lake evaporation and the average annual precipitation at a location. Figure 7.7 shows a map of the average in each county (DWR, 1994). There is a substantial difference in MD across the state (see also fig. 1.12 of Chapter 1). MD is greatest in the southwest corner of the state where lake evaporation is greatest and precipitation is near the lowest in the state. The MD is smallest along the eastern border of the state where lake evaporation is lowest and precipitation is more abundant. This variable is one that correlates well with many of the important effects that climate plays on agriculture. The greater the MD the more arid the climate while the lower the MD the more humid is the climate.
Figure 7.7--Potential net evaporation for Kansas counties (Division of Water Resources, 1994).
The greater the MD the greater the potential to reduce total runoff if the soil can hold the extra water that infiltrates it so that it will be lost later by evapotranspiration. As MD decreases, the potential of percolation increases because the soil cannot hold all of the water that infiltrates during extended wet periods. Soil type is important, particularly the soil's ability to store water that is available for later use by plants. Deep, silt-loam-type soils are best, whereas shallow, sandy-type soils are poorest for storing water. Crops, too, have an effect. Perennial crops and grass use the most water because they are actively growing during a longer portion of the year. Annual or summer crops use less because they are growing for a shorter period of the year. Fallowed soils do not use water, although water is lost from fallowed soil by evaporation. The least water loss is from fallow land with good crop-residue cover, provided no plants are allowed to grow. Protecting the soil surface on fallowed land with residue decreases runoff, decreases evaporation, and may increase the potential for percolation during wetter years.
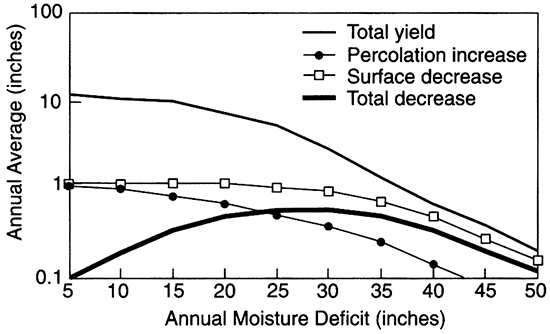
Further, experience with the results from the POTYLD model for many locations in Kansas shows that its results are in general agreement with what is observed. The depth of the amount of reduction in surface runoff increases with decreasing MD where conservation practices are added. The effect, however, as a percentage of total yield decreases as the MD decreases. With decreasing MD, more percolation results from conservation practices. Finally, the effect of conservation practices on total water yield is greatest in areas where the MD is moderate. To illustrate the effect of MD on water yield across Kansas, results of simulating a change in continuous wheat production caused by changing from a condition of little conservation practices to good conservation practices are discussed in Appendix 7.A. The change is expressed primarily in a decrease in the RCN by five and a slight increase in the residue factor that reduces the rate of surface evaporation. Figure 7.8 shows how the general amount of total water yield (surface runoff + percolation), decrease in surface-runoff, increase in percolation, and the total decrease in water yield are affected by the MD. The reader is cautioned to notice that the "average annual" is a log scale in fig. 7.8. In areas where the MD is high, most of the surface runoff prevented by better conservation practices because of more infiltration is stored as soil moisture which is subsequently lost as evapotranspiration because the climatic demand for water is large. With moderate amounts of MD, a larger amount of water yield occurs because there is more potential surface runoff to affect. Some increase in percolation results because not all of the extra water can be stored in the soil during wetter periods. In areas where the MD is low, runoff is still reduced, but nearly all of the extra water that enters the soil becomes percolation. Here, the ability of the atmosphere to increase evapotranspiration during wet periods is insufficient to cause much of the additional water that does not become surface runoff to become evaporation. Also, practices that are effective at reducing runoff require residue cover on the surface. The residue cover also decreases evaporation from the soil. Thus, the total amount of water yield is affected very little in areas where the MD is low. In some cases, water yield may actually be increased in eastern Kansas, particularly during wet periods because evaporation is decreased. In eastern Kansas, if water is not lost by evapotranspiration, it will eventually become streamflow. There is just not enough storage in the soil to hold all of it for later use.
Figure 7.8--Simulated effects on aspects of the water budget when the RCN value for continuous wheat is reduced from 75 to 70 on a silt loam soil, as related to the MD across Kansas.
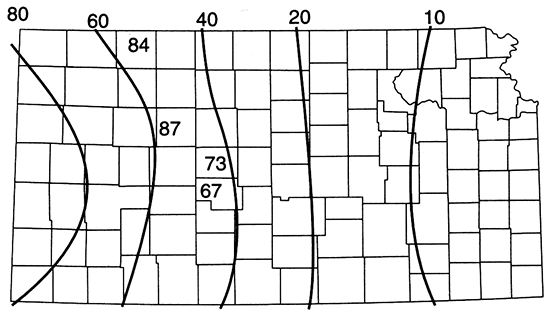
When the maximum potential for agricultural soil- and water-conservation practices to reduce surface runoff are added together they can have a substantial effect. Figure 7.9 shows a generalized map of these aggregate effects to reduce runoff from the amounts of streamflow that were reported for conditions around 1930. By the late 1990's, a substantial amount of these effects of agriculture are occurring. The numbers on fig. 7.9 show the percent reductions that were experienced during the 1980's for various locations in western Kansas.
Figure 7.9--Generalized potential of soil and water conservation practices and agricultural technology to reduce streamflow below the amount measured in the 1930-1950 period, by percent.
The above information is for one set of conditions described previously. Results for a wide variety of land uses and conservation practices found across Kansas have been produced with POTYLDR by making simulations at five locations (Koelliker, 1994a). Predicted average annual depth of runoff and percolation are included in table 7.1 from the representative RCN value for a Soil Conservation Service Group B/C soil (silt loam soil). For all locations, the same planting and harvest date for row crops (grain sorghum, May 10 and October 15) and small grain (winter wheat, October 10 and June 25) were used. The fallow shown is for a combination of wheat-fallow rotation with the wheat having an RCN equivalent to the small grain practice shown earlier in the table. Pasture/range growing season was March 15 through October 31. These results can be generalized to other locations by relating the values to the MD at a particular location. The MD for three of the locations (Horton, Great Bend, and Garden City) were adjusted somewhat because the stations have more or less annual precipitation than is typical for the MD each one was most representative of across the state. Figure 7.10 shows there is a general relationship between runoff and percolation and the adjusted MD across the range of conditions simulated. The transmission loss factor (TLF) is the ratio of runoff estimated upstream to the amount of runoff actually measured at a gaging station downstream. If the value of the TLF at each location as shown for each station in table 7.1 is used along with the amount of runoff shown in table 7.1, then the estimated effect of an agricultural practice change on surface streamflow can be calculated by dividing the runoff by the TLF.
Figure 7.10--Simulated average annual depth of runoff and percolation from row crops and small-grain production with straight-row conservation practice compared with pasture/range as affected by moisture deficit (Koelliker, 1994b).
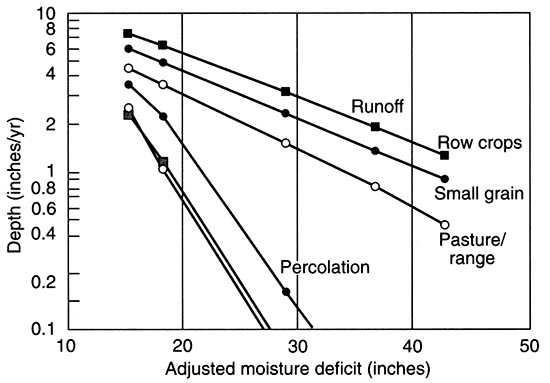
Table 7.1--Simulated results from potyldr for average annual runoff and percolation, in inches, for various land uses and conservation practices (Koelliker, 1994b ).
| Location | Horton | Manhattan | Great Bend | Colby | Garden City |
|---|---|---|---|---|---|
| Period of record simulated | 1935-1975 | 1958-1986 | 1948-1988 | 1940-1980 | 1948-1988 |
| Lake evaporation inches | 48.90 | 51.13 | 61.47 | 55.65 | 64.03 |
| Precipitation, inches | 35.60 | 32.89 | 25.54 | 19.31 | 17.97 |
| Moisture deficit, inches | 13.30 | 18.24 | 35.93 | 36.34 | 46.06 |
| Adjusted moisture deficit, inches | 15.30 | 18.24 | 28.93 | 36.84 | 42.86 |
| Transmission-loss factor | 1.02 | 1.03 | 1.15 | 1.25 | 1.43 |
| No. | Land use | Conservation practice |
RCN AMC II |
Runoff | Perc. | Runoff | Perc. | Runoff | Perc. | Runoff | Perc. | Runoff | Perc. |
|---|---|---|---|---|---|---|---|---|---|---|---|---|---|
| 1. | row crops | straight row | 81 | 7.61 | 2.39 | 6.37 | 1.17 | 3.19 | 0.07 | 1.92 | 0.02 | 1.27 | 0.00 |
| 2. | row crops | contoured | 78 | 6.24 | 3.73 | 5.19 | 2.20 | 2.54 | 0.28 | 1.55 | 0.07 | 0.99 | 0.03 |
| 3. | row crops | level terrace | 74 | n/a | n/a | n/a | n/a | 1.97 | 0.55 | 1.20 | 0.14 | 0.74 | 0.05 |
| 4. | row crops | lev. terr., cl.-cnd | 64 | n/a | n/a | n/a | n/a | n/a | n/a | 0.57 | 0.42 | 0.30 | 0.14 |
| 5. | row crops | conserv. tillage | 77 | 5.81 | 4.63 | 4.86 | 2.90 | 2.39 | 0.52 | 1.45 | 0.11 | 0.95 | 0.04 |
| 6. | 2 | graded terrace | 75 | 5.19 | 4.97 | 4.30 | 3.19 | 2.04 | 0.58 | 1.27 | 0.14 | 0.79 | 0.05 |
| 7. | 2 + 3 | 72 | n/a | n/a | n/a | 3.88 | 1.61 | 0.82 | 1.01 | 0.23 | 0.60 | 0.07 | |
| 8. | 2 + 4 | 62 | n/a | n/a | n/a | n/a | n/a | n/a | 0.46 | 0.50 | 0.23 | 0.18 | |
| 9. | 2 + 5 | 75 | 5.24 | 5.19 | 4.38 | 3.36 | 2.11 | 0.67 | 1.28 | 0.15 | 0.82 | 0.05 | |
| 10. | 2 + 3 + 5 | 70 | n/a | n/a | n/a | n/a | 1.46 | 1.05 | 0.90 | 0.29 | 0.54 | 0.09 | |
| 11. | 2 + 4 + 5 | 61 | n/a | n/a | n/a | n/a | n/a | n/a | 0.43 | 0.55 | 0.21 | 0.22 | |
| 12. | 6 + 5 | 74 | 5.16 | 5.28 | 4.29 | 3.43 | 2.04 | 0.71 | 1.24 | 0.16 | 0.80 | 0.05 | |
| 13. | 1 + | irrigated | 81 | 9.05 | 4.58 | 8.09 | 3.26 | 4.78 | 0.86 | 3.15 | 0.41 | 2.50 | 0.09 |
| 14. | 1 + 5 + | irrigated | 77 | 6.78 | 6.93 | 6.14 | 5.23 | 3.56 | 1.65 | 2.31 | 0.80 | 1.81 | 0.35 |
| 15. | small grain | straight row | 78 | 6.08 | 3.80 | 4.87 | 2.34 | 2.33 | 0.18 | 1.36 | 0.03 | 0.90 | 0.02 |
| 16. | small grain | contoured | 75 | 5.03 | 5.01 | 4.00 | 3.31 | 1.88 | 0.44 | 1.10 | 0.14 | 0.71 | 0.04 |
| 17. | small grain | level terrace | 71 | n/a | n/a | n/a | n/a | 1.44 | 0.74 | 0.85 | 0.29 | 0.51 | 0.06 |
| 18. | small grain | lev. terr., cl. end | 63 | n/a | n/a | n/a | n/a | n/a | n/a | 0.45 | 0.56 | 0.23 | 0.17 |
| 19. | small grain | conserv. tillage | 74 | 5.03 | 5.55 | 3.99 | 3.74 | 1.90 | 0.60 | 1.15 | 0.24 | 0.72 | 0.04 |
| 20. | 16 | graded terrace | 74 | 4.98 | 5.39 | 3.92 | 361 | 1.84 | 0.56 | 1.09 | 0.22 | 0.68 | 0.04 |
| 21. | 16 + 17 | 70 | n/a | n/a | n/a | n/a | 1.32 | 0.90 | 0.78 | 0.39 | 0.46 | 0.08 | |
| 22. | 16 + 18 | 60 | n/a | n/a | n/a | n/a | n/a | n/a | 0.39 | 0.65 | 0.19 | 0.18 | |
| 23. | 16 + 19 | 74 | 5.04 | 5.60 | 4.08 | 3.78 | 1.91 | 0.62 | 1.15 | 0.25 | 0.72 | 0.04 | |
| 24. | 16 + 17+ 19 | 68 | n/a | n/a | n/a | n/a | 1.19 | 1.08 | 0.73 | 0.50 | 0.42 | 0.12 | |
| 25. | 16 + 18 + 19 | 59 | n/a | n/a | n/a | n/a | n/a | n/a | 0.36 | 0.78 | 0.17 | 0.23 | |
| 26. | 20 + 19 | 71 | 4.16 | 6A6 | 3.26 | 4.47 | 1.52 | 0.86 | 0.92 | 0.39 | 0.55 | 0.08 | |
| 27. | 15 + | irrigated | 78 | 6.84 | 6.02 | 5.77 | 4.49 | 3.25 | 1.79 | 2.06 | 1.17 | 1.57 | 0.54 |
| 28. | 15 + 19 + | irrigated | 74 | 5.54 | 7.43 | 4.69 | 5.70 | 2.56 | 2.33 | 1.65 | 1.54 | 1.21 | 0.83 |
| 29. | pasture/range | 75 | 4.53 | 2.57 | 3.51 | 1.07 | 1.52 | 0.06 | 0.81 | 0.00 | 0.46 | 0.00 | |
| 30. | 29 | improved | 70 | 3.38 | 3.78 | 2.54 | 1.93 | 1.07 | 0.18 | 0.56 | 0.01 | 0.30 | 0.00 |
| 31. | hay (alfalfa) | 76 | 4.61 | 1.74 | 3.54 | 0.56 | 1.53 | 0.02 | 0.80 | 0.00 | 0.48 | 0.00 | |
| 32. | 31 + irrigated | 76 | 6.58 | 4.76 | 5.52 | 3.31 | 3.42 | 0.98 | 1.94 | 0.73 | 1.76 | 0.21 | |
| 33. | fallow-wheat | straight row | 86 | n/a | n/a | n/a | n/a | 3.69 | 0.72 | 2.37 | 0.25 | 1.70 | 0.04 |
| 34. | fallow-wheat | contoured | 83 | n/a | n/a | n/a | n/a | 3.01 | 1.26 | 1.92 | 0.52 | 1.35 | 0.13 |
| 35. | fallow-wheat | level terrace | 79 | n/a | n/a | n/a | n/a | 2.28 | 1.92 | 1.46 | 0.90 | 0.96 | 0.29 |
| 36. | fall.-wheat | lev. terr., cl. end | 68 | n/a | n/a | n/a | n/a | n/a | n/a | D.71 | 1.54 | 0.38 | 0.72 |
| 37. | fall.-wheat | conserv. tillage | 81 | n/a | n/a | n/a | n/a | 2.94 | 1.74 | 1.87 | 0.81 | 1.29 | 0.24 |
| 38. | 34 | graded terrace | 80 | n/a | n/a | n/a | n/a | 2.59 | 1.71 | 1.65 | 0.79 | 1.10 | 0.22 |
| 39. | 34 + 35 | 77 | n/a | n/a | n/a | n/a | 1.94 | 2.25 | 1.27 | 1.10 | 0.81 | 0.43 | |
| 40. | 3 - 1 + 36 | 67 | n/a | n/a | n/a | n/a | n/a | n/a | 0.63 | 1.64 | 0.33 | 0.78 | |
| 41. | 34 + 37 | 79 | n/a | n/a | n/a | n/a | 2.72 | 1.94 | 1.73 | 0.93 | 1.18 | 0.31 | |
| 42. | 34 + 35 + 37 | 75 | n/a | n/a | n/a | n/a | 1.85 | 2.76 | 1.19 | 1.37 | 0.75 | 0.61 | |
| 43. | 34 + 36 + 37 | 66 | n/a | n/a | n/a | n/a | n/a | n/a | 0.61 | 1.89 | 0.31 | 0.96 | |
| 44. | 38 + 37 | 79 | n/a | n/a | n/a | n/u | 2.47 | 2.17 | 1.59 | 1.06 | 1.06 | 0.40 | |
| Notes: Soil is silt loam which fits SCS hydrologic group B/C and SCS irrigation Class 3; unless noted otherwise, good hydrologic condition assumed. |
|||||||||||||
With the values in table 7.1, it is possible to compare the effect of a change in land use and/or conservation practice from one condition to another condition and to estimate the effect on long-term average amount of runoff and percolation. Consider the effects of changing from an initial land use of annual cropping with row crops with straight row conservation practice (line 1 in table 7.1) to a second condition of pasture/range (line 29) that might result if highly erodible cropland were placed into the Conservation Reserve Program at Great Bend. Predicted average annual runoff for initial conditions, I, is 3.19 inches (81 mm) and for final conditions, F, is 1.52 inches (39 mm). Essentially no change in percolation is expected. The TLF is 1.15 for Great Bend. Further, consider if 4.0% (P) of the watershed were to be changed. To estimate the decrease in average annual water yield (Y) use,
Y = (I - F) · P / (TLF · 100) (eq. 7.1)
The result is, Y = 0.06 inches (1.5 mm). At Great Bend, water yield averages about 1.5 inches/year (38 mm/year). So, total water yield would be reduced by about 4%.
As agriculture developed, much pasture/range was converted to cropland and later conservation practices were added to cropland to reduce erosion and/or to improve moisture conservation. The impact of these changes depends upon the amount of the watershed affected and the magnitude of the change in runoff. Figure 7.11 shows a comparison of surface-water yield from small grain production with various conservation practices to the surface-water yield from pasture/range across the amounts of MD found in Kansas. Straight row was the earliest agricultural practice. Later, contouring and conservation tillage or residue management were added along with terraces as conservation practices. The line "Best Management Practice" includes the applicable type of terrace, conservation tillage, and contouring at each of the five locations simulated. The graph shows that the amount of surface runoff from small grain production can be reduced to that expected from pasture/range across Kansas with good management.
Figure 7.11--Comparison of simulated average annual runoff from small-grain production with various conservation practices to pasture/range as affected by moisture deficit (Koelliker, 1 994b ).
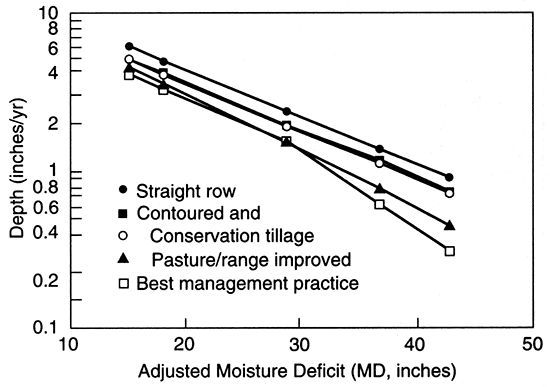
The effect of conservation practices on reducing runoff as a percent of the total water yield increases with increasing MD. When MD = 15 inches (38 cm) as found in eastern Kansas, the reduction from straight row to best management practice is about 30%. With MD = 40 inches (100 cm) as is the case in most of the western half of Kansas, the reduction in water yield is about 60%, similar to the results shown in fig. 7.9.
In summary, this section shows that effects of conservation practices and land-use changes in Kansas on water yield can be substantial, particularly in areas where the MD is large. Conservation practices have the ability to hold much of the potential runoff, which is then lost as evapotranspiration. These practices are most effective during drier years when streamflow is limited, which further aggravates the problem of allocating limited water resources to other users. The simulation method described in this chapter provides a way to determine the magnitude of these effects on a continuous basis so that effects with time on water yield and water availability can be evaluated. Other measures such as watershed projects and irrigation withdrawals from alluvial aquifers along streams add further to potential depletions of streamflow. The impact on ground-water recharge is positive in the central portion of the state where several good aquifers store and transmit the additional water to potential ground-water users. In eastern Kansas where the potential to increase percolation is even better, there is limited opportunity to make the additional percolation become usable ground water. It may seep out gradually to enhance the dry weather flow for a few weeks following wet periods.
The procedure described to estimate change in the surface runoff portion of water yield has been studied more intensely than that for percolation and the potential for ground-water recharge from such percolation. The operation of POTYLD, however, also estimates the amount of percolation as shown in fig. 7.7. An aspect of recharge that is important to understand when considering sustainable yield is that for many locations, particularly in drier areas, recharge occurs infrequently. The section following in the inset Boxed section 7.1 illustrates this phenomenon.
Agriculture has made substantial changes to the land use in Kansas for more than 150 years. Sustainable crop production by agriculture without irrigation, in large part, has been a matter of developing management practices that increase the effectiveness of use of the limited water supply and that protect the soil resource from excessive erosion. Adoption of conservation practices that decrease runoff and reduce evaporation losses have been important. In much of the state, the effectiveness of these practices has resulted in more efficient use of water for grain and forage production. Since water use by agriculture is a consumptive use that results in evaporation of water from the land surface, more effective use means that less water is left to become runoff or potential ground-water recharge. In the western half of the state, in particular, streamflow has been reduced from the amounts measured before about 1950 by a combination of agricultural practices including withdrawal of ground water for irrigation along streams. Reductions of streamflow by as much as 50% or more have been experienced. In the eastern half of the state, the effect has been limited because of the difference in climatic conditions. As ways to use water more efficiently are developed and adopted for Kansas conditions, this means less for nonagricultural uses, particularly in the drier regions of the state. In the future these effects will probably result in a further decrease in the amount of water available for appropriation by other users.
Under average conditions, evapotranspiration demand for water exceeds that supplied by precipitation. So, on average the soil should not become so saturated with water that percolation occurs. Average conditions, however, seldom occur in the continental climate that prevails in Kansas (see also Chapter 1). There are periodic episodes when drought and wet periods occur. Much of the percolation that results in ground-water recharge occurs in extended wet periods.
To illustrate this point, a 44-year simulation for Great Bend was made with POTYLDR. Great Bend (MD = 35 inches [89 cm]) is representative of that part of the state where agricultural practices have important effects on water yield, and aquifers benefit from increase in percolation. Representative RCN values for a Soil Conservation Service Group B/C soil (silt loam soil) for Great Bend are shown in table B7.1.1. The planting and harvest date for grain sorghum were May 10 and October 15, respectively, and for winter wheat they were October 10 and June 25, respectively. The results of the conditions simulated for Great Bend produced average amounts of runoff and percolation as shown in table B7.1.1. Percolation or recharge is least from pasture/range which has a long growing season and is greatest from irrigated crops. Here, the average amount of net irrigation water applied to the soil in 2.0-inch (5-cm) increments when the available soil moisture decreased to 50% was 9.0 inches (23 cm) and 13.0 inches (33 cm) for wheat and grain sorghum, respectively.
Table B7.1.1--Simulated results from POTYLDR for average annual runoff and percolation, in inches, for various land uses at Great Bend on a silt loam soil.
| Land use | Predicted annual average, inches | |
|---|---|---|
| Runoff | Percolation | |
| pasture/range, good condition | 1.1 | 0.2 |
| pasture/range, fair condition | 1.5 | 0.1 |
| continuous wheat | 1.8 | 1.2 |
| wheat-fallow | 2.5 | 2.6 |
| irrigated wheat | 2.5 | 3.6 |
| grain sorghum, conventional | 2.3 | 0.4 |
| grain sorghum, conservation tillage | 2.1 | 0.7 |
| irrigated grain sorghum | 3.2 | 2.2 |
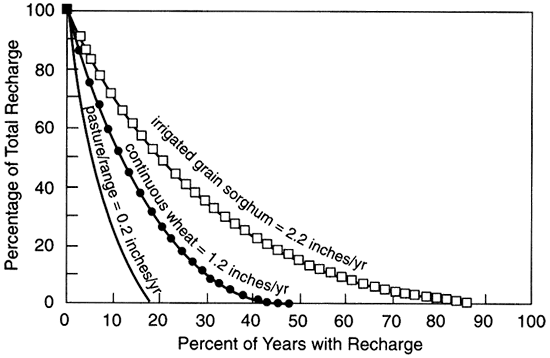
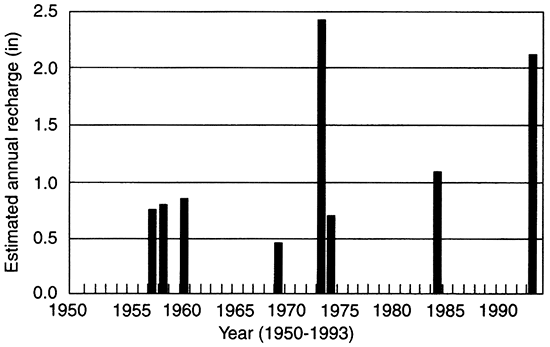
Figure B7.1.1 was prepared from the annual results from three of the simulations to show the distribution of percent of years with percolation within the simulation period for three of the land uses. For pasture/range in good condition, recharge was estimated to occur in less than 20% of the years and half of the recharge occurred in less than 5% of the years. For continuous wheat, recharge was predicted to occur in less than half of the years and half of the total occurred in about one year in eight on average. Irrigated grain sorghum showed some recharge in about seven out of eight years; however, half of the total recharge occurred in about one year out of five. The example above is for one location only. Where recharge is most needed in western Kansas, the climate has a greater moisture deficit, There, recharge is even less than for the example above, and more of the recharge occurs in a lower percentage of the years. While runoff events are rather widely spaced in time, recharge events are even more widely spaced in time. Providing a sustainable yield from an aquifer that must be periodically replenished, the event nature of recharge must be taken into account. The time between years with recharge for the Great Bend example for pasture/range is illustrated in fig. B7.1.2. Here, three periods with lengths of eight years or longer between recharge events were predicted in the 44-year simulation for the range/pasture land use.
Figure B7.1.1--Summary of simulated percent of accumulated percolation from three land uses at Great Bend on a silt loam soil versus the percent of years with percolation.
Sustainable yield from ground water must include estimates of total recharge as an upper limit as well as the distribution of recharge in time and space over the aquifer. Using average annual values is risky, especially if the storage capacity of the aquifer is limited.
Figure B7.1.2--Summary of predicted annual amount of recharge (percolation) from range/pasture at Great Bend on a silt loam soil.
Blaney, H. F, and Criddle, W D., 1962, Determining consumptive use and irrigation water requirements: U.S. Department of Agriculture, Technical Bulletin 1275
Brunt, D., 1944, Physical and dynamical meteorology: Cambridge, Cambridge University Press
Bureau of Reclamation, 1984, Solomon River Basin Study: U.S. Department of Agriculture, Lower Missouri Basin Division, Denver, CO
Division of Water Resources (DWR), 1994, Potential net evaporation map for Kansas counties: Prepared by the Division of Water Resources, Kansas Department of Agriculture
Fenster, C. R., Owens, H. I., and Follett, R. H., 1977, Conservation tillage for wheat in the Great Plains: U.S. Department of Agriculture, Extension Pamphlet 1190
Gray, D. M., ed., 1973, Principles of hydrology: Huntington, New York, Water Information Center, Inc.
Kansas State Board of Agriculture, 1989 and previous, 71st Annual Report and Farm Facts: Topeka, Kansas, Kansas Crop and Livestock Reporting Service
Koelliker, J. K., Zovne, J. J., Steichen, J. M., and Berry, M. W., 1981, Study to assess water yield changes in the Solomon basin, Kansas; Part I--Final report: Manhattan, Kansas, Kansas Water Resources Research Institute, 123 p.
Koelliker, J. K., Zovne, J. J., Steichen, J. M., and Berry, M. W., 1982, Study to assess water yield changes in the Solomon basin, Kansas; Part II--User's manual: Manhattan, Kansas, Kansas Water Resources Research Institute
Koelliker, J.K., Brown, M. J., and Zovne, J. J., 1983, Assessment of changes in the precipitation regime of the Republican River basin: Working paper for the Bureau of Reclamation, Denver, Colorado; Civil Engineering Department, Kansas State University, Manhattan
Koelliker, J. K., 1984, An historical perspective on soil and water conservation--Its effect on surface-water supplies: Soil and Water Conservation Society of America, Oklahoma City, Oklahoma, August 139th Annual Meeting; Civil Engineering Department, Kansas State University, Manhattan
Koelliker, J. K., 1991, Future water supply for Cheyenne Bottoms Wildlife Refuge, Kansas; Final report to Howard Needles, Tammen and Bergendoff: Kansas State University, Manhattan, Civil Engineering Department
Koelliker, J. K., 1994a, User's manual for POTential YieLD Model Revised: Kansas State University, Manhattan, Civil Engineering Department
Koelliker, J. K., 1994b, Effects of agricultural development on surface water yield in the Central Great Plains; in, Effects of Human-induced Changes on Hydrologic Systems: American Water Resources Association, Bethesda, Maryland, p. 745-754
Koelliker, J. K., Govindaraju, R. S., and Lewis, S. L., 1995, Evaluation of Marion and Council Grove Lakes water supply capabilities-Final report to Kansas Water Office: Kansas State University, Manhattan, Civil Engineering Department, 110 p.
Kutz, R., 1990, Bureau of Reclamation reservoirs in Kansas: Presented to the Kansas Academy of Science, March 1990; Bureau of Reclamation, McCook, Nebraska
Rawls, W J., Onstad, C. A., and Richardson, H. H., 1980, Residue and tillage effects on SCS runoff curve numbers: Transactions of the ASAE, v. 23, p. 357-361
Ritchie, J. T., 1972, Model for predicting evaporation from a row crop with incomplete cover: U.S. Department of Agriculture, Soil & Water Conservation Research Division, Blackland Conservation Research Center, Temple, Texas, p. 1,204-1,213
Sauer, S. P., and Masch, F D., 1969, Effects of small structures on water yield in Texas; in, Effects of Watershed Changes on Streamflow, W. L. Moore and C. W. Morgan, eds.: University of Texas Press, Austin, p. 118-135
Sharp, A. L., Gibbs, A. E., and Owens, W. J., 1966, Development of a procedure for estimating the effects of land and watershed treatment on streamflow: U.S. Department of Agriculture, Technical Bulletin 1352
Steichen, J. M., 1983, Field verification of runoff curve numbers for fallow rotations: Journal of Soil and Water Conservation, v. 38, p. 496-499
U.S. Department of Agriculture, Soil Conservation Service, 1972, Hydrology: National Engineering Handbook, section 4. Washington, D.C.
U.S. Department of Agriculture, Soil Conservation Service, 1975, Kansas Irrigation Guide: U.S. Department of Agriculture, Soil Conservation Service, Salina, Kansas Water Information Center, Inc., 1974, Climates of the states, volume 2: Port Washington, New York
Zovne, J. J., Bean, T. A., Koelliker, J. K., and Anschutz, J. A., 1977, Model to evaluate feedlot runoff control systems: Journal of the Irrigation and Drainage Division, ASCE, v. 103,p.79-92
Zovne, J. J., and Koelliker, J. K., 1979, Application of continuous watershed modeling to feedlot runoff management and control: National Technical Information Service, Springfield, Virginia, Report No. EPA-600/2-79-065
Continuous watershed-simulation modeling was common by the mid-1970's. Zovne et al. (1977) developed a continuous water-budget simulation model that worked on daily time steps for use in assessing the performance of open feedlots to control runoff from feedlots. The model predicted runoff from the feedlot drainage area, operation of a storage pond, and water budgets for various land areas where the runoff was applied according to some management scheme. The model utilized runoff curve numbers (RCN) values to predict the split between runoff and infiltration for the feedlot and areas where runoff was applied to daily amounts of rainfall and snowmelt (See Chapter 1 for more information on RCN values). The model named FROMKSU was designed to be physically based, to use readily available information to describe conditions in an area of interest, and to be capable of being applied anywhere in the continental U.S. Its detailed description is contained in Zovne and Koelliker (1979).
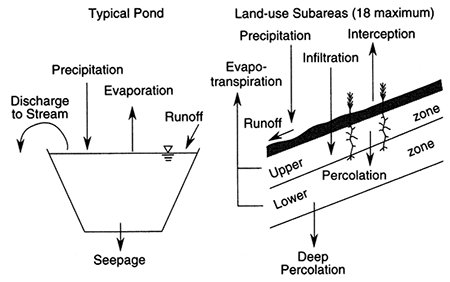
The Potential Yield (POTYLD) model simulates a continuous water budget for land uses with different conditions in a watershed on a daily basis (see fig. 7.A I). Up to 18 different land-use combinations can be simulated in one run of the model. Estimates of the upstream runoff and percolation that would result from various land uses and conservation practices are provided. A RCN value for antecedent moisture condition (AMC) II is needed for each land use and conservation practice based upon soil characteristics, land cover, conservation practice, and management practice. Soil characteristics are assumed to fall into one of 12 irrigation group classifications for Kansas (USDA-SCS, 1975), which define the waterholding characteristics of the soil layers and soil-water evaporation characteristics. A continuous water-budget simulation produces estimates of water content in the soil. AMC values are adjusted based upon available soil moisture (ASM) in the upper 1.0 ft (30 cm), AMC I holds below 50% ASM, AMC III holds above 90% ASM, and AMC II holds in the intermediate range of ASM.
Figure 7.A1--Schematic of POTYLD water-budget model (adapted from Zovne and Koelliker, 1979).
The water budget is driven by daily precipitation and minimum and maximum temperature for a single station representative of the area under study. Large areas are divided into sub-areas which are modeled separately, then combined for better representation of the entire watershed. Long-term monthly average values of percent sunshine, relative humidity, solar radiation, windrun, and average temperature are used to estimate potential evapotranspiration (PET) by the Penman combination equation after Gray (1973). Long-term monthly values are obtained by triangulation from published values for first-order weather stations (Water Information Center, 1974). Geographical coefficients, Brunt a and b (Brunt, 1944) are used to calibrate Penman's PET such that predicted average annual lake evaporation at a location agrees with published values (Zovne and Koelliker, 1979). Actual water use by crops is simulated by multiplying daily PET by a monthly B1aneyCriddle crop coefficient (Blaney and Criddle, 1962) and a coefficient based upon ASM.
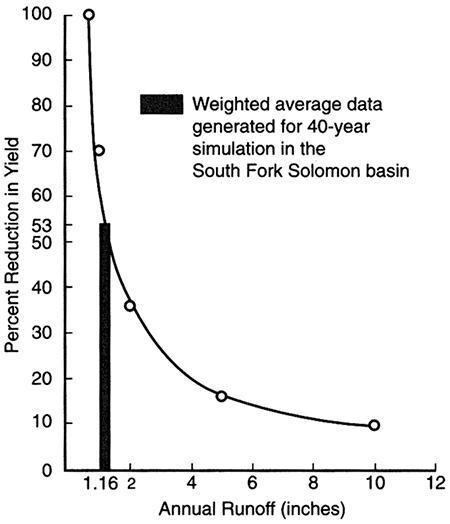
The crop coefficients are calculated by pre-programmed equations in the program which require the user to provide planting and harvest dates. The soil-moisture coefficient is 1.0 for ASM greater than 30%; below 30% it decreases linearly to zero when ASM is zero. When crops are not growing, bare soil and fallow water loss is simulated by a decay-rate equation (Ritchie, 1972) and adjusted for assumed amount of surface residue. Water loss by percolation from the rooting zone is assumed to cascade from the lower layer whenever the ASM in the lower zone exceeds 90%. POTYLD simulates the complete daily water budget for a "typical" pond. The pond is defined by assigning a stage-storage and stage-surface area relationship along with a seepage loss rate. The model treats the pond as an inverted frustum of a pyramid which can match most actual relationships fairly well. Runoff into the typical pond is determined by routing runoff from specified areas of the various land-use subareas which would be typical of the drainage area for a pond in the particular study area. Modeled results of predicted depletions of surface water caused by ponds have compared closely with depletion effects described by Sauer and Masch (1969) for watershed flood-control dams in Texas. Figure 7.A2 shows the general relationship from Sauer and Masch and the average results found for typical ponds above Webster Reservoir (Koelliker et al., 1981).
Figure 7.A2--Function of percent reduction in watershed yield due to ponds as a function of annual runoff in the watershed.
Substantial revisions have been made to the model and the name changed to POTYLD (Revised) (Koelliker, 1994a, 1994b). Enhancements to the PET routine to reflect greater daily and annual variation based upon daily minimum and maximum temperature and a function to simulate annual variation in heat storage and dissipation at the surface have been made. Also, RCN between AMC I and AMC III is varied linearly with ASM between 50 and 90%. AMC II holds when ASM is 70%.
Results from POTYLD must be adjusted by estimates of transmission losses and the effects of depletion from or additions to streamflow in order to compare with actual streamflow records. In addition, because agricultural effects on upstream yield are changing with time, changes must be accounted for in output from POTYLD by making successive runs with the inputs that represent conditions applicable over the period of the streamflow record. Once all of these changes are accounted for, then modeled results can be compared directly with reported streamflow records.
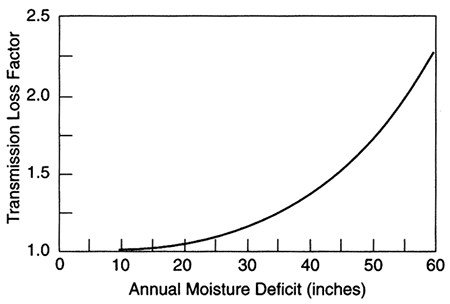
Transmission loss refers to the ratio of annual volume of upstream runoff to downstream streamflow. It accounts for natural losses caused by infiltration, evaporation, and detention storage. The value of the transmission loss factor (TLF) was originally predicted by a technique developed by Sharp et al. (1966). This loss is related to the ratio of PET (Thornthwaite's values) to annual amount of precipitation. Our work shows that annual moisture deficit (MD), defined as lake evaporation minus precipitation, is an effective characteristic of the climate that can be used estimate the TLF (Koelliker et al., 1995). In dry years when runoff is low and MD is higher, the TLF is larger and in wet years when MD is lower TLF approaches 1.0 as shown in Figure 7.A3.
Figure 7.A3--Transmission loss factor for reducing upstream runoff to compare with measured runoff at a downstream streamflow gaging station [adapted by Koelliker et al. (1995) from Sharp et al. (1966)].
Finally, estimates of depletions or additions to streamflow from ground-water use, importation, exportation, return flows, etc. must be accounted for to compare POTYLD modified results with reported streamflow records.
Average MD for each county (DWR, 1994) is shown in fig. 7.7. There is a substantial difference in MD across the state. MD is greatest in the southwest corner of the state where lake evaporation is greatest and precipitation is near the lowest in the state. MD is lowest in the far eastern part of the state where lake evaporation is lowest and precipitation is more abundant. This variable is one that correlates well with many of the important effects that climate plays on agriculture. The greater the MD the more arid the climate while the lower the MD the more humid is the climate. In Kansas this helps explain why northeast Kansas is in the western end of the Corn Belt even though it receives less precipitation than southeastern Kansas which has a larger MD than the northeast. Predicted effects of land use and conservation practices on water yield based upon MD are shown in table 7.1.
Results from POTYLD for an entire watershed provide evidence that various practices and land use effects when aggregated together are useful to assess or estimate combined effects of individual practices. When the model, FROMKSU, was used to study feedlots in different parts of the United States, it was noted that the water yield from the runoff disposal areas using published RCN values (USDA, SCS, 1972) generally agreed reasonably well with values reported for streamflow. In more arid areas, however, water yield was overestimated as expected because transmission losses and effects of ground-water withdrawals have important effects on streamflow. This provided reasonable confidence it the applicability of RCN values to larger watersheds. When POTYLD was developed, however, RCN values were not available to account for levels of residue management, particularly on wheat-fallow. Work reported by Rawls et al. (1980) on effects of residue and tillage on RCN values was influential for predicting how much RCN values for important practices in the area could be reduced when residue management was used. Field simulations in the area were run by Steichen (1983) and those results substantially agreed with predicted amounts that RCN values could be reduced as predicted by Rawls et al. (1980). Finally, field data for runoff from bare fallow and stubble mulch were available for Alliance, Nebraska (Fenster et al., 1977). Those results were simulated with POTYLD and showed the RCN value for stubble mulch with good residue management was six less (73 vs. 79) than for bare fallow on the same soil (Koelliker et al. 1981 ).
The reference list at the end of Chapter 7 contains several references to work where POTYLD has been used. Also, a copy of the user's manual, computer code, and diskettes are available from the author.
Previous--Yield Estimates for Surface-water Sources || Next--Climate Change and Sustainable Water Yield
Kansas Geological Survey
Comments to webadmin@kgs.ku.edu
Web version placed online May 6, 2013. Original publication date 1998.
URL=http://www.kgs.ku.edu/Publications/Bulletins/239/Koelliker/index.html