![]()
Prev Page--Water Use || Next Page--Conclusions
Chemical Quality of Ground Waters in Northeastern Kansas
Observations Regarding the Aquifer Systems
Within the confines of the glaciated area of northeastern Kansas, wells have been developed in Pennsylvanian and Permian bedrock units, deposits of glacial origin, and alluvial deposits of modern drainageways. The nature of these ground-water sources and the quality of water they contain have been described previously in various county reports (Bayne, 1973; Bayne and Schoewe, 1967; O'Connor, 1960, 1971; Walters, 1953; Ward, 1973, 1974; Winslow, 1972).
In general, the alluvial deposits are the major source of ground water in northeastern Kansas. These deposits, especially those in valleys of major drainageways, are known to produce hard calcium bicarbonate (Ca2+-HCO3-) waters that may contain several milligrams per liter of iron (Fe). The sand and gravel layers associated with deposits of glacial origin yield varying quantities and quality of water; we used a calcium bicarbonate classification and the possibility of elevated iron levels to characterize waters from these glacial buried-valley aquifers. The bedrock aquifers seem to be more limited in yield, and they often produce water of lower quality that might contain appreciable amounts of iron sulfate (SO42-), and chloride (Cl-).
Federal regulations concerning primary drinkingwater standards establish a maximum level of 44.3 mg/L for nitrate as NO3, or 10 mg/L nitrate as N (U.S. Environmental Protection Agency, 1975). Secondary drinking-water standards set maximum levels of 250 mg/L for chloride and sulfate, 500 mg/L for total dissolved solids, 0.3 mg/L for iron, and 0.05 mg/L for manganese (Mn) (U.S. Environmental Protection Agency, 1979b).
Nitrate (NO3) concentrations in excess of 45 mg/L have been noted in waters from a number of wells of varying depth and aquifer source in the area of study. Denne (1980), in reviewing the historical water quality data for northeastern Kansas, observed that 312 of 1,223 wells sampled in a 15-county area have nitrate concentrations in excess of 45 mg/L. Nearly two-thirds of these wells obtain water from deposits of Pleistocene age, and 41-50 ft (12-15 m) is the median-depth range for the wells containing high nitrate concentrations. A number of the wells also produce waters that exceed the limits of the secondary water-quality standards.
Factors Influencing Water Quality
A number of factors contribute to the quality of ground waters from the different aquifer sources: land use, nature of the geologic deposits, subsurface geologic structure, well location, and well-construction features. The study area is predominantly rural in character, with sorghum, wheat, com, and soybeans being the major crops and cattle and hogs dominating livestock production (Kansas State Board of Agriculture, 1981). The impact of these agricultural factors on the quality of ground water is expected to be the greatest for shallow water sources, especially recent alluvial deposits, or for wells without an adequate surface seal. The influence of home septic systems and discharge from community sewage treatment facilities and the effects of oil and gas exploration and production also contribute to the deterioration of water quality locally, notably in shallow aquifers or in poorly constructed wells. The contribution of one or more of these elements probably is significant at many of the well sites in the study area where high ground-water nitrate levels have been observed.
Cores taken from the glacial buried-valley aquifer system in Nemaha County typically exhibit buff to brown sediments in the upper zone and gray to black sediments deeper in the sediment column, presumably reflecting oxidizing and reducing conditions, respectively (Denne et al., 1984). Humic debris, including wood fragments, is evident in the gray to black zone. The clay minerals exhibit great uniformity throughout the unconsolidated sediment column, with montmorillonitic clay (smectite) dominating in all samples analyzed (G. W. James, personal communication, 1984). Thick zones of clayey materials commonly serve as effective aquitards in the isolation of aquifer units in the buriedvalley systems. The presence of reducing hydrogeochemical conditions in portions of the buried-valley system can be expected to influence water quality. The stability of various chemical species found in natural waters can be affected by hydrogeochemical conditions. For example, nitrate and sulfate, which are the dominant stable forms of nitrogen and sulfur in an aerobic environment, give way to ammonia (NH3) and hydrogen sulfide (H2S) in the presence of anaerobic conditions. Also, iron and manganese can be mobilized from the sediment materials under reducing conditions.
Gypsiferous limestone units of Permian age yield calcium sulfate (Ca2+-SO42-) waters. Where the glacial buried-valley systems incise these bedrock units, there may be an influx of calcium sulfate waters into the lower aquifers of the buried-valley system. The sandstone aquifers of Pennsylvanian age often exhibit an increase in salinity with depth or downdip in the formation. O'Connor (1960) suggested that base exchange reactions are responsible for the sodium bicarbonate (Na+-HCO3-) waters found in southwestern Douglas County. Waters from the sandstone bedrock aquifers are frequently high in iron.
The Humboldt fault system enters Kansas from the north in Nemaha County and extends southwestward through Wabaunsee County in the study area. DuBois (1978) suggested that faulting associated with this system has influenced modern surface drainage in Nemaha County. Comparison of DuBois's fault map (plate 1) and Ward's (1974) buried-valley map suggests that this influence in Nemaha County extends back to Pleistocene time. Oil exploration and production in Nemaha County are related to structural traps associated with the fault system. Oil-related activities may produce saline water from great depths. In addition, different fault planes can serve as conduits or paths for the vertical movement and mixing of ground waters of different quality.
The placement and construction of a well are factors that often are driven by considerations of well yield or nearness to the point of water utilization rather than by a concern for the quality of water produced. The location of wells in animal pens, downslope from pens or septic systems, or near drainageways collecting water from agricultural areas can lead to the production of water with elevated concentrations of chloride and nitrate. This possibility is greatest for shallow wells but may also extend to deeper wells because of the standard well-construction methods used in northeastern Kansas. Common practice includes placing 10 ft (3 m) of screen near the bottom of the well, packing gravel along the entire length of the screen, casing to within 10 ft (3 m) of the land surface, and grouting to seal at least the upper 10 ft (3 m). This construction allows interconnection of aquifers and permits only the determination of composite water levels and chemistries. Shallow handdug wells are also prone to chemical and bacterial contamination, as are wells located downgradient in the aquifer from septic systems.
1981 Sampling Procedures
Water-well records filed with the Kansas Geological Survey between 1975 and 1981 provided the primary pool from which the sites were selected. A few wells from outside this group have been included to provide better areal coverage. The sites represent the general quality of ground water in the counties and in major aquifers, especially glacial units, in the study area. Some "nests" of wells (several individual wells at one site completed and screened at different depths) have also been included to determine vertical differences in water quality in a given aquifer. Most of the wells are private wells, but some are public supply and industrial wells and a few are irrigation wells.
During the spring of 1981, staff members of the Kansas Geological Survey and the U.S. Geological Survey collected 148 water samples from wells with logs and known construction characteristics. Controlled conditions were observed during sampling, handling, and analysis of these samples. These procedures included field filtration, acid preservation of samples for nutrient and trace metal analyses, and refrigeration of samples during transport to the laboratory and during storage at the laboratory.
Field measurement of temperature, specific conductance, and pH were made at all sample sites. The inorganic composition of the ground-water samples was analyzed at the laboratories of the Kansas Department of Health and Environment. Results from these field and laboratory determinations for the well waters from the 12-county study area constitute the primary data base used for the following discussion of ground-water quality in northeastern Kansas (Denne et al., 1990b).
Discussion of the 1981 and Related Ground-water Quality Data for Northeastern Kansas
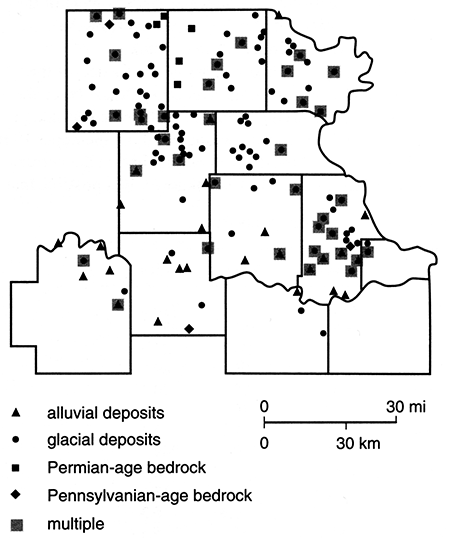
Of the water samples analyzed from the spring 1981 collection period, 147 of the wells fall within the 12-county area of this study. The remaining site is in the Missouri River alluvium of Buchanan, Missouri, at a location across the state line from Atchison, Kansas. Four of these 147 wells were found to have been subjected to chlorination or water-softening treatment and were dropped from consideration. Water-quality data for all wells sampled are presented by Denne et al. (1990b). The location of the remaining 143 wells and the type of aquifer units they tap are presented in fig. 82. The distribution of aquifer types is nine bedrock aquifer wells, 26 alluvial aquifer wells, and 108 glacial aquifer wells. Depths of these wells range from 20 ft to 300 ft (6-91 m).
Figure 82--Locations and designations of water-producing wells sampled in spring 1981. Wells with more than one type of aquifer are indicated by the multiple symbol (shaded box) but are given the overall designation of the major contributing aquifer.
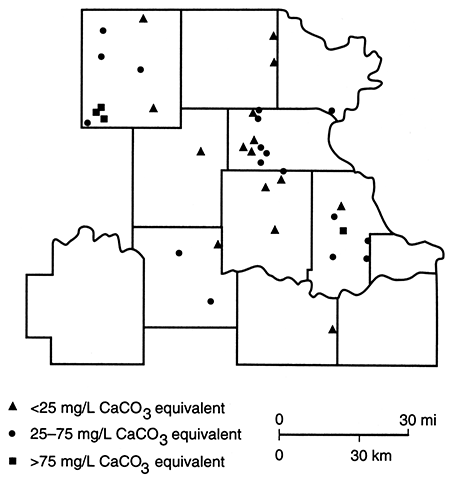
Shown in fig. 83 are water-type classifications for the well waters, which are based on percent milliequivalent contributions of the various chemical species to the total number of milliequivalents per liter of ions. The mixed category implies that no single cation and/or anion was dominant in the water's chemistry. From this figure it can be seen that calcium bicarbonate waters are the principal water type in the study area. This basic pattern can be modified through such factors as bedrock units containing sodium chloride (Na+-Cl-) or calcium sulfate waters, the introduction of surface water containing various dissolved solids, and base exchange reactions. Figure 84 shows the locations of wells with waters that exhibit some sodium bicarbonate alkalinity. These sites probably reflect locations at which the ground water experiences natural softening through ion-exchange processes.
Figure 83--Water-type classifications for samples collected in spring 1981.
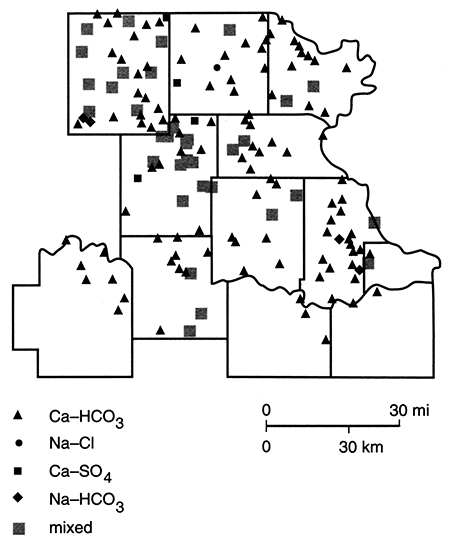
Figure 84--Concentrations for samples exhibiting NaHCO3 alkalinity. Samples collected in spring 1981.
Water-type classifications convey general information about the chemical composition of solids dissolved in the ground waters, but they do not impart any data about the amount of solids dissolved. Table 12 provides a summary of the data for the spring 1981 collection period.
Table 12--Summary of ranges, means, and medians for 1981 chemical quality data.
| Variablea | Minimum | Maximum | Mean | Median |
|---|---|---|---|---|
| Specific conductance (µmhos at 25°C) | 244 | 8100 | 957 | 710 |
| Total dissolved solids (TDS), calculated | 169 | 3050 | 564 | 436 |
| Silica (SiO2) | 11 | 47 | 24 | 25 |
| Calcium (Ca) | 28 | 593 | 108 | 89 |
| Magnesium (Mg) | 3.5 | 155 | 25 | 20 |
| Sodium (Na) | 5.4 | 632 | 49 | 27 |
| Potassium (K) | 0.4 | 19 | 2.5 | 1.4 |
| Bicarbonate (HCO3) | 81 | 540 | 339 | 344 |
| Sulfate (SO4) | 5.0 | 1550 | 119 | 42 |
| Chloride (Cl) | 1.0 | 840 | 41 | 13 |
| Fluoride (F) | 0.1 | 1.1 | 0.4 | 0.3 |
| Nitrate (NO3) | BQLb | 399 | 27 | 5.3 |
| Phosphate (PO4) | BQLb | 1.1 | 0.08 | 0.03 |
| Iron (Fe) | BQLb | 19 | 1.2 | 0.04 |
| Manganese (Mn) | BQLb | 3.9 | 0.28 | 0.03 |
| a. All chemical components measured in milligrams per liter. b. Below quantifiable limits. |
||||
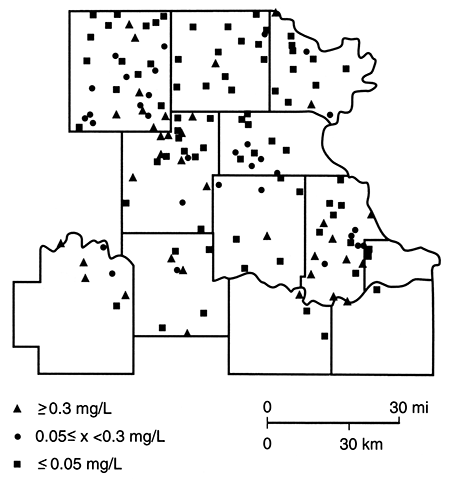
Figures 85-89 are maps of the nitrate, sulfate, chloride, iron, and manganese water-quality data. Nitrate concentrations in excess of 45 mg/L are more common in the northern half of the study area. However, it should be noted that there are a number of sites at which nitrate levels are below 5 mg/L and iron and/or manganese are above 0.3 mg/L. This latter observation is consistent with the presence of reducing conditions, a situation that has been found in the glacial buried-valley system at several locations in Nemaha County (Denne et al., 1984). Sulfate and chloride concentrations in excess of the Secondary Drinking Water Standards (EPA, 1979b) seem to be confined to a zone trending southward from the Nemaha-Brown county area into Jackson County. This trend roughly parallels the subcrop boundary of Permian units and may arise from an upward movement of saline waters in parts of the Humboldt fault system or in parts of the deep incision made by the Pleistocene drainage system.
Figure 85--Nitrate (NO3) concentration for samples colleered in spring 1981.
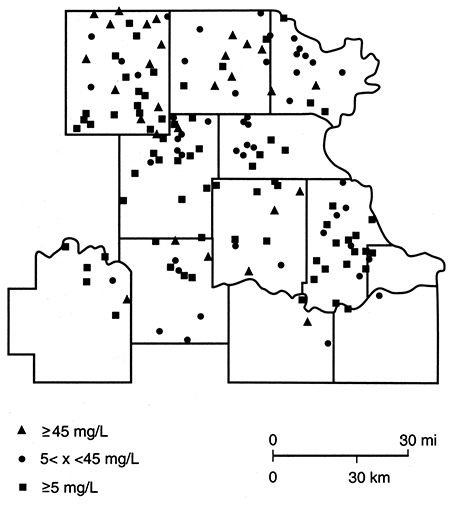
Figure 86--Sulfate (SO4) concentration for samples collected in spring 1981.
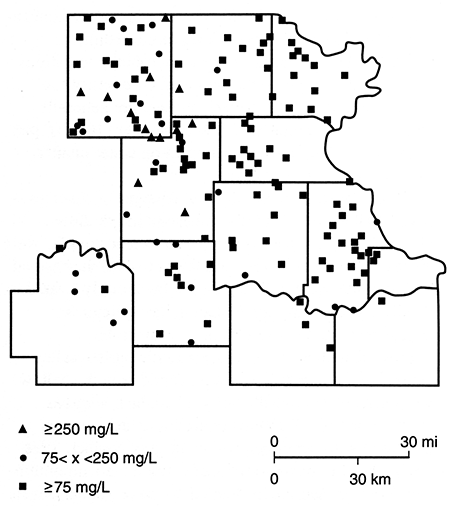
Figure 87--Chloride (CL) concentration for samples collected in spring 1981.
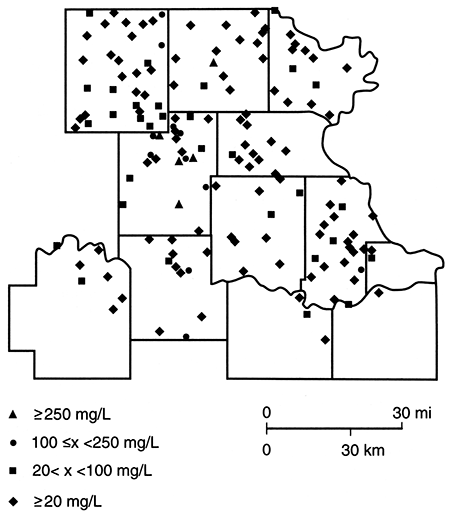
Figure 88--Iron (Fe) concentration for samples collected in spring 1981.
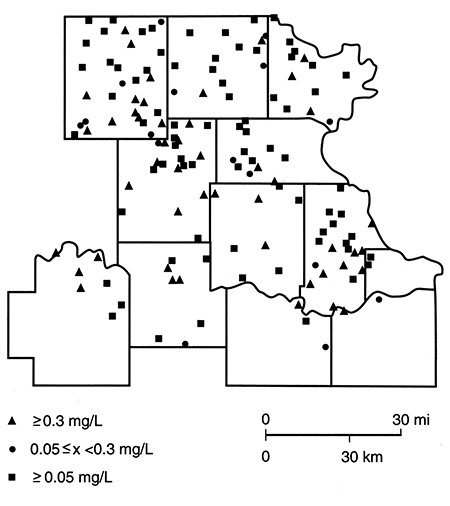
Figure 89--Manganese (Mn) concentration for samples collected in spring 1981.
Water-quality data from the 1981 sampling program were processed using SAS (SAS Institute Inc., 1985), a computerized data-analysis program. A univariate statistical analysis of the data by aquifer type indicated that the concentration of most constituents approaches a normal distribution in samples from bedrock aquifers, but only silica (SiO2) and bicarbonate had normal distributions in samples from alluvial and glacial aquifers. Because bedrock aquifers in the study area yield limited amounts of good-quality water and because the number of water samples from these units was small, further statistical testing focused on water samples from alluvial and glacial deposits.
We used the Spearman rank-sum correlation coefficient for non normal distributions [method of Snedecor and Cochran (1982)] to correlate well depths, specific conductance, and chemical constituents of waters derived from wells located in unconsolidated aquifers. Because the waters from the alluvial and glacial deposits are sufficiently different, we determined the correlations for them separately (tables 13 and 14). The unequal number of wells in the two data sets makes comparison of correlation coefficients (r) difficult; the 95% confidence level (|r| 0.33) in table 13 is given for comparison with the 99.9% confidence level (|r| 0.30) of table 14. Little interpretive weight should be given to any single isolated correlation, especially those of table 13. Inspection of the two tables implies that the waters from the alluvial deposits are much simpler, with correlations being primarily related to major chemical components of the ground waters. Significant positive correlations between specific conductance or total dissolved solids and chemical constituents (calcium, magnesium, sodium, bicarbonate, sulfate, and chloride) simply reflect the dominance of these ions in the ground waters of the alluvial and glacial deposits. Direct correlations suggest that bicarbonate in waters from alluvial deposits is associated with calcium and magnesium, whereas sources of calcium sulfate and sodium chloride seem responsible for influxes of sulfate and chloride ions, respectively. Table 14 may reflect a more extensive interaction between ground water and sediment of the glacial deposits and blending of waters from the unconsolidated sediments and bedrock.
Table 13--Correlation matrix for 26 samples from alluvial deposits.
| Depth | Specific conductance |
TDS | pH | SiO2 | Ca | Mg | Na | K | HCO3 | SO4 | Cl | F | NO3 | PO4 | Fe | Mn | |
|---|---|---|---|---|---|---|---|---|---|---|---|---|---|---|---|---|---|
| Depth | ++ | ||||||||||||||||
| Specific conductance |
0 | ++ | |||||||||||||||
| TDS | 0 | ++ | ++ | ||||||||||||||
| pH | 0 | 0 | 0 | ++ | |||||||||||||
| SiO2 | 0 | 0 | 0 | 0 | ++ | ||||||||||||
| Ca | 0 | ++ | ++ | 0 | 0 | ++ | |||||||||||
| Mg | 0 | ++ | ++ | 0 | 0 | + | ++ | ||||||||||
| Na | 0 | + | ++ | 0 | 0 | 0 | 0 | ++ | |||||||||
| K | 0 | 0 | 0 | 0 | 0 | 0 | 0 | + | ++ | ||||||||
| HCO3 | 0 | ++ | ++ | 0 | 0 | ++ | ++ | 0 | 0 | ++ | |||||||
| SO4 | 0 | ++ | ++ | 0 | 0 | ++ | + | 0 | 0 | 0 | ++ | ||||||
| Cl | 0 | ++ | ++ | 0 | 0 | 0 | 0 | ++ | 0 | 0 | + | ++ | |||||
| F | 0 | 0 | 0 | 0 | 0 | 0 | 0 | 0 | 0 | 0 | 0 | 0 | ++ | ||||
| NO3 | 0 | 0 | 0 | 0 | 0 | 0 | 0 | = | 0 | 0 | 0 | 0 | ++ | ||||
| PO4 | 0 | 0 | 0 | 0 | ++ | 0 | 0 | 0 | 0 | 0 | 0 | 0 | = | 0 | ++ | ||
| Fe | 0 | 0 | 0 | 0 | 0 | 0 | 0 | + | 0 | 0 | 0 | 0 | 0 | = | 0 | ++ | |
| Mn | + | 0 | 0 | 0 | 0 | 0 | 0 | ++ | 0 | 0 | 0 | 0 | 0 | - | 0 | ++ | ++ |
| 0, Correlation not significant at the 95% confidence level. +, Positive correlation significant at the 95% confidence level (|r| = 0.33). -, Negative correlation significant at the 95% confidence level (|r| = 0.33). ++, Positive correlation significant at the 99% confidence level (|r| = 0.46). =, Negative correlation significant at the 99% confidence level (|r| = 0.46). |
|||||||||||||||||
Table 14--Correlation matrix for 108 samples from glacial deposits.
| Depth | Specific conductance |
TDS | pH | SiO2 | Ca | Mg | Na | K | HCO3 | SO4 | Cl | F | NO3 | PO4 | Fe | Mn | |
|---|---|---|---|---|---|---|---|---|---|---|---|---|---|---|---|---|---|
| Depth | ++ | ||||||||||||||||
| Specific conductance |
0 | ++ | |||||||||||||||
| TDS | 0 | ++ | ++ | ||||||||||||||
| pH | 0 | 0 | 0 | ++ | |||||||||||||
| SiO2 | 0 | 0 | 0 | 0 | ++ | ||||||||||||
| Ca | 0 | ++ | ++ | = | 0 | ++ | |||||||||||
| Mg | 0 | ++ | ++ | 0 | 0 | ++ | ++ | ||||||||||
| Na | 0 | ++ | ++ | 0 | 0 | + | ++ | ++ | |||||||||
| K | 0 | ++ | ++ | 0 | 0 | 0 | ++ | ++ | ++ | ||||||||
| HCO3 | 0 | ++ | ++ | 0 | 0 | ++ | ++ | ++ | ++ | ++ | |||||||
| SO4 | 0 | ++ | ++ | 0 | 0 | ++ | ++ | ++ | ++ | ++ | ++ | ||||||
| Cl | 0 | ++ | ++ | 0 | 0 | ++ | ++ | ++ | 0 | ++ | ++ | ++ | |||||
| F | 0 | 0 | 0 | 0 | 0 | 0 | + | 0 | 0 | 0 | 0 | 0 | ++ | ||||
| NO3 | = | 0 | 0 | 0 | 0 | 0 | 0 | 0 | = | - | 0 | 0 | 0 | ++ | |||
| PO4 | = | - | - | 0 | 0 | - | - | - | 0 | - | 0 | 0 | 0 | 0 | ++ | ||
| Fe | 0 | ++ | ++ | 0 | 0 | + | ++ | ++ | ++ | ++ | ++ | 0 | 0 | = | 0 | ++ | |
| Mn | 0 | ++ | ++ | 0 | 0 | ++ | ++ | ++ | ++ | ++ | ++ | ++ | 0 | = | - | ++ | ++ |
| 0, Correlation not significant at the 95% confidence level. +, Positive correlation significant at the 95% confidence level (|r| = 0.22). -, Negative correlation significant at the 95% confidence level (|r| = 0.22). ++, Positive correlation significant at the 99% confidence level (|r| = 0.30). =, Negative correlation significant at the 99% confidence level (|r| = 0.30). |
|||||||||||||||||
Wells in glacial deposits are generally deeper than those in alluvial materials, averaging almost twice the depth. The modifying influence that well construction, in particular the gravel packing of all but the upper 10 ft (3 m) of the unexposed well casing, has on the correlations of tables 13 and 14 is unknown. It is possible that the significance of relationships, such as those related to depth, has been obscured by averaging the water chemistries of the different aquifer zones that contribute to the overall yield of the wells. Also, other factors that are not included directly in the statistical analysis (such as differences in sediment type of the aquifer units, heterogeneity of the sediment column, presence of humic materials, and presence of microbiologic activity) may have important but unrecognized influences on the correlations. The presence of aerobic or anaerobic conditions in the aquifer at a well site can have a marked influence on water quality as a result of oxidation-reduction and complexation reactions and mineral solubility equilibria that serve to control the stability and mobility of a number of chemical species of hydrogeochemical interest. Thus general differences in environmental conditions within the alluvial and glacial deposits contribute to the dissimilarity of tables 13 and 14.
Additional information is needed to help clarify interpretations that use the correlation relationships. As an example, significant inverse relationships noted for ground waters are depth-nitrate, depth-phosphate (PO4), iron-nitrate, and manganese-nitrate in glacial deposits and sodium-nitrate and iron-nitrate in alluvial deposits. These may represent near-surface sources for nitrate and phosphate, the influence of a reducing environment within water-producing zones (especially in glacial deposits), or combinations of such factors.
Preliminary surveys made after the 1981 sampling program of less commonly determined dissolved organic carbon (DOC) and ammonium ion (NH4+) contents of the ground waters yielded concentrations of 0.9-2.4 mg/L for DOC and <0.1 mg/L to 4.8 mg/L for ammonium. These data suggest that the chemistry of waters from the buried-valley aquifer systems poses two different potential problems if the waters are subjected to a chlorine disinfection treatment, as required for all public water-supply drinking water in Kansas. First, organic carbon and reduced species such as Fe2+, Mn2+, H2S and NH4+ present in the waters undergo side-reactions that consume chlorine, giving rise to difficulties in maintaining required residual levels of free or combined chlorine (Denne et al., 1984). Second, the reaction of chlorine with organic carbon in water can lead to the production of chlorinated organic compounds, including trihalomethanes. Initial measurements of total trihalomethaneformation potential for ground waters from Nemaha and eastern Marshall counties are 9-98 µg/L (Hathaway et al., 1984). The higher measured concentrations approach the maximum contaminant level of 100 µg/L THM for drinking water established by the U.S. Environmental Protection Agency (1979b). Clearly, a more detailed knowledge of water chemistry for wells that feed publicsupply systems within the study area could prove beneficial in achieving a satisfactory finished product.
Denne et al. (1987), in a subsequent investigation, examined in more detail the geologic and geochemical factors that influence water quality in the major glacial buried valley of southeastern Marshall County and southern Nemaha County. They took core sections from holes drilled from the ground surface to bedrock and drilled "nests" of two to four observation wells screened in different water-bearing sediments at six sites. The core materials were subjected to physical, chemical, and microbial examination. The nests of observation wells were used to obtain seasonal ground-water samples and to evaluate variations in water quality with depth or location along the channel.
The tan upper sediments were found to be low in extractable ammonium and had total organic carbon (TOC) and extractable nitrate contents that decreased with depth below the surface soil zone. At depth the sediment color abruptly changed to gray. Below the color-transition zone, the concentrations of TOC and extractable ammonium increased, whereas the concentration of extractable nitrate remained negligible. Higher extractable ammonium concentrations generally were found at sites having higher TOC levels, but the concentration profiles of the two species in the sediment columns were dissimilar. Active microbial populations were found throughout the sediment columns of the investigated sites. The bacteria present are generally small in size and relatively few in number (105-106 per gram of dry sediment); their impact on water quality requires further assessment.
There appeared to be seasonal changes in concentrations of DOC, iron, and manganese in the shallow ground water, but the deeper ground-water samples were more consistent in quality and failed to exhibit seasonal trends. Water quality was found to be strongly related to depth, with the tan-gray contact in the sediments appearing to divide the aerobic and anaerobic hydrogeochemical environments in the buried-valley aquifer. High nitrate levels were found only in shallow wells screened above the tan-gray contact, whereas ammonium concentrations in ground-water samples increased with depth below the tan-gray contact. Sites having higher concentrations of extractable ammonium and TOC in sediments tended to have higher levels of ammonium, DOC, and trihalomethane formation potential in the ground water. Average concentrations of DOC and trihalomethane for the six sites were 2.65 µg/L and 123 µg/L, respectively, with the latter value being slightly above the maximum trihalomethane level of 100 µg/L permitted by state and national drinking-water standards. Calcium and sulfate concentrations also were observed to increase with depth at certain sites, presumably in response to Permian gypsiferous bedrock units at these sites. Unlike observed trends with respect to depth, no clear pattern was noted for water quality relative to channel position (upgradient versus downgradient or proximity to the channel axis).
The water-quality data derived from the 1981 regional sampling program and other studies indicate complex hydrogeochemical relationships in the glacial buried-valley aquifers. The presence of DOC, ammonium, iron, and manganese complicate water treatment of public supplies. The impact of microbial activity in the aquifer on water quality and relationships between TOC or DOC and trace-element mobility in the ground water are subjects needing further investigation. A search for a supply of ground water in this region must carefully couple considerations of aquifer properties that control yield and quality of water produced.
Prev Page--Water Use || Next Page--Conclusions
Kansas Geological Survey, Geohydrology
Placed on web March 1, 2015; originally published 1998.
Comments to webadmin@kgs.ku.edu
The URL for this page is http://www.kgs.ku.edu/Publications/Bulletins/229/07_qual.html