Kansas Geological Survey, Open File Report 96-49
Line D1, which is parallel to the outcrop, shows good to fair reflectivity in the top 1-2 m of data, but predominantly poor reflectivity below that (Fig. 5a). In general, reflections have the same basic geometries as the outcrop. However, correlations between reflections and the outcrop are complicated by instrument generated noise which created events that are parallel to the top of the GPR data (elevation corrected surface) and extend downward throughout the data. Because of the AGC operator applied during processing, this noise is particularly apparent where the reflective signal is weak or nonexistent. It is generally easy to ignore the noise when it cuts across the true reflections, but it complicates interpretation where it is parallel or subparallel to the reflective fabric. Multiple reflections and a signal pulse that contains several cycles also tend to obscure interpretation of primary reflections. Another complicating factor for interpretation is the waviness of the reflectivity with lateral spatial wavelengths on the order of less than a meter to a few meters in some areas (Figs. 5 and 6). This characteristic is probably due to minor elevation changes between the surveyed station locations, minor changes in velocity, and wavy bedding of the limestone. Minor changes in elevation are due to an irregular surface on the rock outcrop created by uneven weathering of dipping limestone beds. Lack of dielectric constant variations within and between many of the limestone beds may also reduce reflection strength and make correlation difficult.
Figure 5a--Uninterpreted version of GPR Line D1. This line is primarily a dip line with respect to cross-bedding, and is approximately parallel to the highwall outcrop (Figs 2 and 4). Station locatiopns (ft) are indicated along the bottom of the section as well as by vertical lines on the GPR every five stations. CDP locations which indicate the trace number are indicated along the top of the section. The profile is an unmigrated time section with the vertical scale in nanoseconds. An approximate depth scale is indicated which assumes a velocity of 0.12 m/ns. An approximate horizontal scale is also indicated which assumes a constant trace spacing of 3 cm/trace. A large version is also available. The large version is 600k and will take some time to download!.
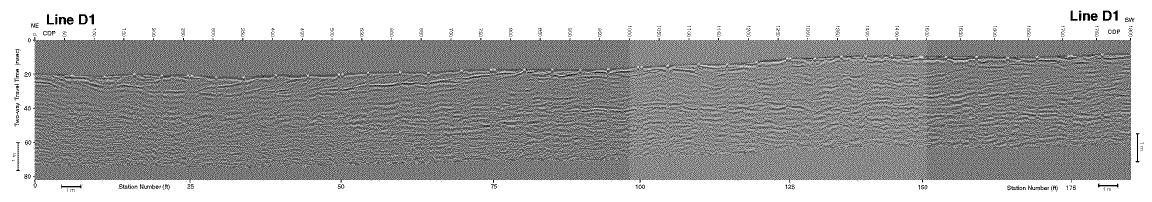
Figure 5b--Interpreted version of line D1. Major reflections which are correlated with the major horizons or bounding surfaces on the photomosaic are indicated by thicker lines and labels. Other prominent reflections are indicated by thinner lines and do not necessarily correlate with the bed boundaries interpreted on the photomosaic. A large version is also available. The large version is 600k and will take some time to download!.
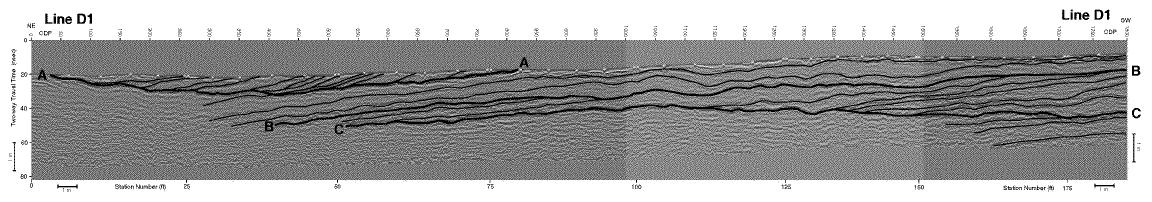
Although an exact correlation between a given reflection and a given bedding surface may not be possible in many cases due to the above complications and a lack of precise depth control on the GPR sections, the overall stratal geometries indicated by the GPR interpretation (Fig. 5) correlate fairly well with the upper part of the outcrop (Fig. 4). Two horizons, B and C, are interpreted on both the outcrop and the GPR data. Unfortunately, horizon A, which is imaged very well on the GPR data, is covered in the outcrop. Also, horizon D and the clinoforms between it and horizon C are only visible in the outcrop because they are too deep to be clearly imaged on line D1.
On line D1, horizon A is a highly reflective boundary with a channel-like form and northeast dipping cross-bedded strata above (Fig. 5). This horizon is characterized by its high reflection strength and downlap of cross-beds onto it. Together, horizon A and the cross-beds above represent the best imaged stratigraphic features on either line D1 or D2. The direction and relative magnitude of dip of strata above horizon A is similar to the cross-bedded oolitic limestone visible on the photomosaic between horizons C and D from station 50 to 100 (Fig. 4). The strength of the reflectivity along horizon A (Fig. 5) and the cross-beds above is probably due to relatively large changes in dielectric constant caused by shale drapes, insoluble residues along bedding planes, increased moisture, or possibly air filled bedding planes along horizon A and the foresets above. Below horizon A, reflections seem to be less pronounced, possibly due to increased signal attenuation from more conductive layers along and above the horizon or less of a dielectric constant contrast within the units below the horizon.
Horizon B is not as reflective as A or C so its interpretation on line D1 is more speculative (Fig. 5). However, it appears that reflections above horizon B are mostly conformable with the horizon and dip gently to the northeast. Reflections above horizon B also appear to be truncated by horizon A indicating a possible erosional surface along horizon A. Beds possibly associated with the reflections above horizon B are primarily covered up in the photomosaic (Fig. 4), but where visible seem to conform with the GPR interpretation. The low reflection strength of beds between horizons A and B may be due to a small dielectric constant change along the surface between beds. This may suggest that shale drapes or insoluble residues are not as prominent between these beds or the surface that separates the beds is relatively dry or of similar material to that of the limestone beds.
Horizon C appears to vary in reflectivity along line D1 (Fig. 5). It is more reflective from stations 90-130, and 160-180 than elsewhere, possibly due to a higher shale content along the horizon in these areas, or greater signal attenuation in other areas. The geometry of reflections and associated beds between horizons B and C is different than those between A and B. Cross-bedding between horizons Band C is evident in both the photomosaics (Fig. 4) and the GPR data (Fig. 5), particularly southwest of station 125. Both the beds and reflections have apparent dips to the northeast, downlap onto horizon C, and are truncated by or become subparallel to horizon B. Dips also appear to be greater in magnitude southwest of station 125 and in some cases the clinoforms have a sigmoidal geometry.
Unfortunately data quality on line D1 below horizon C is quite poor (Fig. 5), particularly along the northeastern half of the line where cross-beds are quite apparent on the photomosaic (Fig. 4). Some reflections are visible southwest of station 150 (Fig. 5), but they are of moderate amplitude. The lack of reflectivity beneath horizon C as well as beneath horizon A between stations 0 and 30 is probably due to a combination of signal attenuation and an increase in equipment generated noise. The loss of signal quality beneath horizon A is particularly apparent (Fig. 5), and may be accentuated by relatively high conductivity layers above and along the horizon.