Kansas Geological Survey, Open-file Report 91-52, p. 142-172
University of Kansas
Sequence-stratigraphic methodology reveals the depositional history and stratal architecture of the onlapping succession of lower Middle Pennsylvanian strata from Seward County onto the Central Kansas uplift. Sequences boundaries, identified in core by evidence of subaerial exposure upon subtidal rocks, are correlated to wireline logs and traced throughout the eastern Hugoton embayment. Thirteen sequences are recognized from the "V" shale (Desmoinesian) to the top of the Kearny Formation (possible Morrowan-age strata) or the sub-Pennsylvanian unconformity surface. Neutron-density wireline-log cross sections reveal that sequences are sigmoidal in shape, downlap into the basin and toplap onto the shell
A continuous core from the Pendleton Land & Exploration #1 Schauf (sec. 16, T. 27 S., R. 29 W., Gray County) extends from the lower Cherokee Group into Mississippian rocks. The core includes a section of strata correlative with the "Thirteen Finger lime" of Oklahoma (probable Atokan-age strata) that is informally referred to as the "Gray group." The "Gray group" lies disconformably upon the Kearny and ranges from conformable to slightly disconformable (by depositional hiatus) with the overlying Cherokee Group in the eastern Hugoton embayment.
Lower Hugoton shelf sequences range from 10 to 30 ft thick. Each sequence contains a basal black radioactive shale (4-10 ft thick) that grades upwards into a clean dense limestone (6-15 ft thick). Lower-shelf black shales thin and grade into limestones and non-radioactive gray shales in the mid-shelf. Thin lower-shelf limestones thicken (up to 75 ft thick) and grade into bioclastic and phylloidal wackestones and packstones in the mid-shelf. Mid-shelf limestones thin further shelfward and grade into thin clastic-dominated units (up to 10 ft thick) or amalgamated soil profiles.
Sequences were deposited during fourth- to fifth-order relative sea-level cycles. Changes in the thicknesses, lithologies, and shapes of "Gray" and lower Cherokee Group sequences indicate the presence of a third-order relative sea-level cycle. The thin black-shale-limestone couplets of lower "Gray group" sequences (m-j) comprise a transgressive sequence set. Upper "Gray group" sequences (f-i) are composed of multiple, thick progradational to aggradational parasequence sets that are suggestive of deposition during an early highstand sequence set. Half of the lower Cherokee Group sequences are restricted to distal portions of the Hugoton shelf and onlap subadjacent sequences; consequently they are considered to be "lowstand wedges" deposited during a late highstand sequence set.
This investigation was undertaken to gain an understanding of the geologic relationships between undifferentiated rocks of possible Atokan age and those of the underlying Kearny (rocks of possible Morrowan-age) and the overlying Cherokee Group. This paper presents the first description of rocks hereby informally named the "Gray group" in Kansas. The "Gray group" is a lithostratigraphic unit that incorporates formerly undifferentiated "Atokan" rocks (rocks of possible Atokan age) in Kansas.
Eighty-five feet of the Pendleton Land & Exploration #1 Schauf core was slabbed, polished, and described in detail. Eleven thin sections were prepared including one or more from most of the exposure surfaces. Sequence boundaries are identified by an abrupt basinward shift in facies marked by a well-developed exposure surface upon subtidal or lower shoreface rocks, and a change in parasequence stacking patterns. Sequence-bounding surfaces and six recurring lithofacies were identified in core and correlated to the gamma-ray and neutron-density wireline log. Regional cross sections were constructed and sequence boundaries were traced over an area of about 14,000 km2 including portions of eight counties from Scott and Finney counties on the north and west, to Clark and Ford counties in the south and east (fig. 1).
Figure 1--A. Pennsylvanian features of the midcontinent from Moore, 1979. B. Post-Mississippian features of western Kansas and Lansing to Mississippian isopach, 500-ft. contour interval (modified from Merriam, 1963). C. Location plat showing type and reference section for "Gray group" strata and location of cross sections used in this paper.
Sequence stratigraphic methodology is employed to discern the geometries, facies relationships, and depositional histories of "Gray" and lower Cherokee groups from Seward County to positions proximal to the Central Kansas uplift.
The Hugoton embayment is a spoon-shaped basin located in western Kansas and eastern Colorado that plunges southward into the Anadarko basin of Oklahoma. The depression began to develop in the Cambro-Ordovician (Rader, 1987) but received its thickest accumulation of sediments during the Late Mississippian, Pennsylvanian, and Early Permian. The depression became inactive by Mesozoic time (Merriam, 1963). During deposition of Lower and lower Middle Pennsylvanian strata, the Hugoton embayment was bounded on the east by the Pratt anticline and Central Kansas uplift, on the northeast by the Cambridge arch, on the west by the Apishapa-Sierra Grande uplift and Ancestral Rockies, on the southwest by the Keyes dome, and to the south by the Anadarko basin (fig. 1).
Uplift of the Siouxia axis, Ancestral Rockies, and the Sierra Grande began during Meramecian time (DeVoto, 1980). These tectonic events, coupled with a lowering of eustatic sea-level (Mitchum and others, 1977), resulted in the punctuated regression of Late Mississippian seas. The first evidence of Mississippian regression in the Hugoton embayment is the presence of evaporites, eolianites, and intraformational conglomerates in the upper Middle Mississippian SL Louis Limestone (Abegg, this volume). The first prominent quartzose sandstones and coarse-grained conglomerates were introduced into the shallow marine platform of western Kansas during the Chesterian Age (Late Mississippian), and indicate erosion of the positive features ringing the Hugoton embayment (Abegg, this volume). The end of the Mississippian and beginning of the Pennsylvanian Period is characterized throughout the midcontinent by regional uplift, folding, faulting, and erosion (Rascoe and Adler, 1983). The Central Kansas uplift, Cambridge arch, and Ancestral Rockies became prominent positive features. In the eastern Hugoton embayment, extensive erosion was responsible for the entrenchment of many south- to southwest- to westward-trending valleys.
Lower and lower Middle Pennsylvanian rocks are characterized by cyclic marine transgression. Limestones, shales, and marine sandstones of the lower Kearny were the first sediments to onlap the sub-Pennsylvanian unconformity surface (McManus, 1956). Lower Morrow (Kearny) strata are overstepped by upper Morrow (Kearny) limestones, shales, coals, and fluvial-estuarine sandstones (Swanson, 1979). Weeler and others (1990) identified seven valley-fill systems within upper Morrow (Kearny) strata in southeastern Colorado and southwestern Kansas. Regionally extensive limestones and black shales of the "Gray group" disconformably overlie and overstep the Kearny in the eastern Hugoton embayment.
Lower and lower Middle Pennsylvanian stratigraphy in the eastern Hugoton embayment is poorly defined and confusing due to a lack of biostratigraphic control and detailed regional studies. This paper adheres to Kansas lithostratigraphic terminology used by Zeller (1968), except that undifferentiated rocks of probable Atokan age are informally referred to as the "Gray group" (fig. 2).
Figure 2--Stratigraphic sections of Lower and lower Middle Pennsylvanian rocks in western Kansas.
The name "Gray group" is used in place of "Atoka" in this paper for two reasons: 1) the carbonates and thin shales of the "Gray group" bear little physical resemblance to the Atoka Formation of Oklahoma and, 2) to avoid confusion between lithostratigraphic and chronostratigraphic units. Additional reference sections, located southwest of the area of this investigation, and biostratigraphic control are needed prior to formally recognizing the "Gray group" as a new lithostratigraphic unit in Kansas.
The key to understanding the relationship between "Gray group" rocks to units above and below, is to establish whether the "Gray group" offlapped the Kearny or overstepped iL This investigation concludes that the Kearny-"Gray group" boundary is disconformable in the eastern Hugoton embayment, and that "Gray" and Cherokee Group strata form one relatively continuous onlapping succession of strata onto all pre-"Gray group" rocks in the eastern Hugoton embayment. Contrary to the implications from the stratigraphic sections of some recent workers (e.g., Emery, 1983; Robinson, 1983; Emery and Sutterlin; 1986; Clark, 1987), Cherokee Group rocks do not he unconformably upon Kearny rocks in the eastern Hugoton embayment.
The proposed type section of the "Gray group" is from core depths 4,877 ft to 4,958 ft in the Pendleton #1 Schauf, located in the SW SW NE sec. 16, T. 27 S., R. 29 W., Gray County, Kansas (corresponding log depths are from 4,871 ft to 4,952 ft on the Pendleton #1 Pendleton; fig. 3). Subsequent to coring, but prior to final printing of wireline logs, Pendleton Land & Exploration purchased the mineral rights on the Schauf lease and renamed the well the #1 Pendleton. The entire section of "Gray group" rocks, in the eastern Hugoton embayment, is not present in the #1 Schauf; consequently, the wireline-log interval from 5,416 ft to 5,554 ft in the Anadarko Production #1-A Milhon, located in the SW NE sec. 9, T. 33 S., R. 32 W., Seward County, is presented as an additional reference section (figs. 4, 5, and 6).
Figure 3--Core description and wireline log of "Gray group" rocks from type section, Pendleton Land & Exploration Inc., #1 Schauf, sec. 16, T. 27 S., R. 29 W., Gray County, Kansas. A larger Acrobat PDF version of this figure is available.
The "Gray group" comprises rocks from the top of the "f' sequence down to the top of the Kearny or the sub-Pennsylvanian unconformity surface (figs. 4, 5, and 6), and includes rocks correlative with the "Thirteen Finger lime" of Oklahoma. In the the eastern Hugoton embayment, the "f" sequence can be readily recognized on wireline logs at the top of two thin limestone-black-shale couplets located about 150 ft above the Kearny (figs. 4, 5, and 6). The top of the "Gray group" also lies immediately below a prominent black-shale bed. The thin black-shale-limestone couplets of the "f" sequence change shelfward into a thick carbonate bed (up to about 40 ft thick) that is readily recognizable on wireline logs despite the pinch out of the overlying black shale (figs. 4, 5, and 6). In shelfward locations, the base of the Cherokee Group can be easily identified as occurring at the base of a succession of thinly bedded, shaly limestones lying immediately above the more massive, dense limestones of the "Gray group" (figs. 4, 5, and 6).
Figure 4--Cross section H-H' from "Gray group" reference section located in the Anadarko Production Co. #1-A Milhon through "Gray group" type section located in the PL&E #1 Schauf. A larger Acrobat PDF version of this figure is available.
Figure 5--Cross section A-A' from east-central Seward County east through Meade and Clark counties. A larger Acrobat PDF version of this figure is available.
Figure 6--Cross section E-E' from east-central Seward County north through Finney County. A larger Acrobat PDF version of this figure is available.
The Schauf core was described in detail from 4,873 ft (top of "Gray group') down to 4,962 ft (4 ft into the Mississippian; fig. 7). The "Gray group" is divided into six lithofacies, and depositional environments are interpreted.
Figure 7--Core description of type section of "Gray group" rocks in Pendleton Land & Exploration #1 Schauf, sec. 16, T. 27 S., R. 29 W., Gray County, Kansas. A larger Acrobat PDF version of this figure is available.
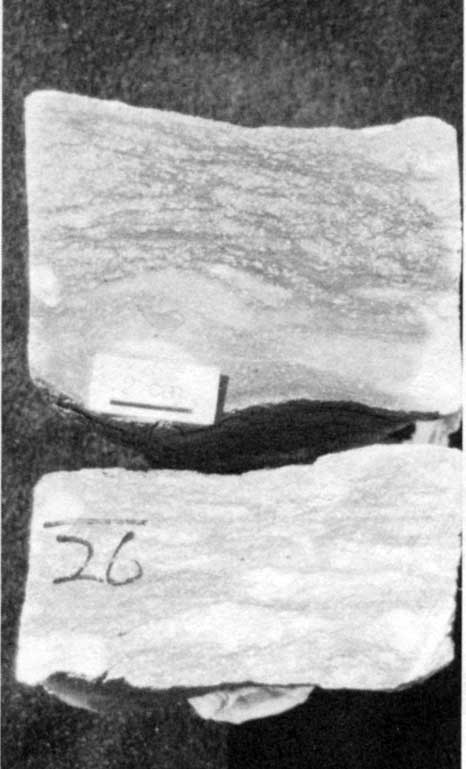
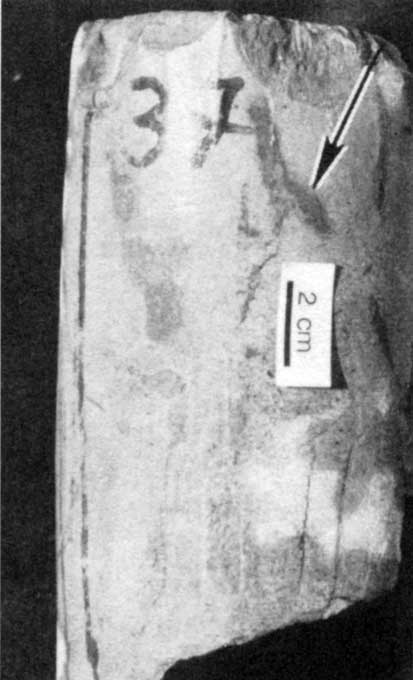
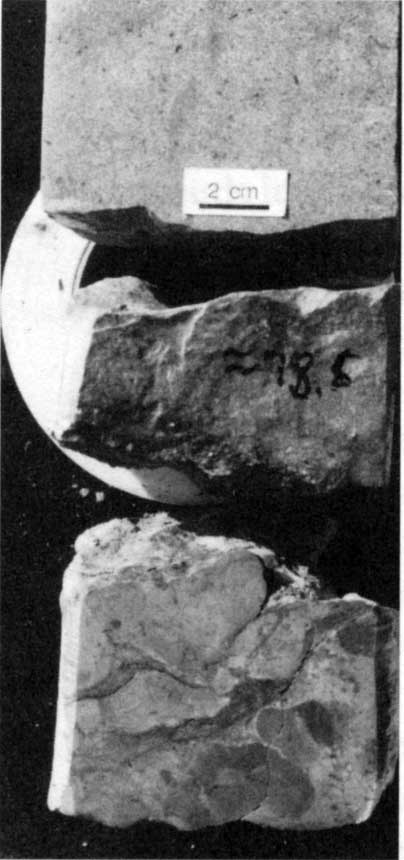
The top 4 ft of Mississippian strata consists of a moderately well-developed soil profile. Root molds and caliche nodules are present within a green silty peloidal packstone (fig. 8). The contact between Mississippian and Pennsylvanian strata is sharp (fig. 9).
The base of facies LP-SH contains lithoclasts, including reworked caliche nodules, and abundant abraded bioclastic material in a dark-gray to black micritic matrix. Fusilinids and echinoderm fragments are common allochems in many of the packstones. Facies LP-SH grades upward into a black to dark-gray shale with localized concentrations of phosphate nodules (fig. 10). In most occurrences the dark-colored lithoclastic packstones, wackestones, and shales of facies LP-SH sharply overlie the light-colored intraclastic packstones and wackestones of facies EP (fig. 11). However, facies LP-SH also sharply overlies the light-colored bioclastic packstones and wackestones of facies BPW at the top of sequence j and within sequence f (fig. 7). Facies LP-SH contains abundant silt within the matrix where it overlies Mississippian strata (fig. 9). Burrowing is generally low to moderate. Facies LP-SH ranges from about 0.5 inches (1.25 cm) to 2 ft (60 cm) in thickness.
Abraded allochems and lithoclasts at the base of facies LP-SH indicate deposition under high-energy conditions. Poor sorting and angularity of grains suggest they were not transported far. Dark-gray to black matrix appears to contain abundant unoxidized organic material, which may have filtered into the framework under low-energy conditions. The paucity of burrows and unoxidized matrix indicate the unit was subjected to dysoxic conditions after initial deposition of allochems. The presence of phosphate nodules in the shalier upper parts of the facies suggests slow depositional rates. Wireline-log cross sections indicate that facies LP-SH correlates to radioactive black shales (up to 10 ft thick) developed at the base of sequences in western Seward County.
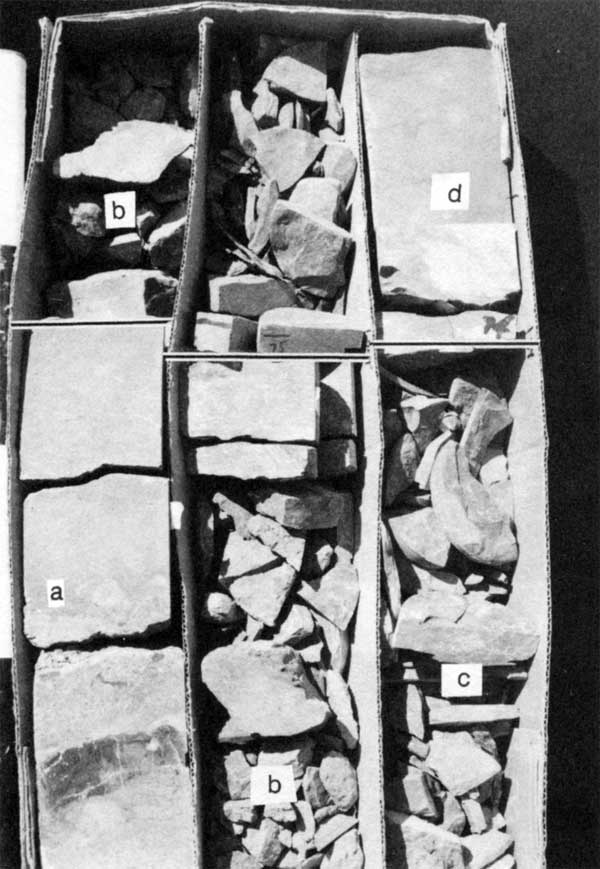
Figure 8--Top of Mississippian (core depth 4,960-4,961 ft) in Pendleton #1 Schauf showing a) large root mold and b) caliche nodules.
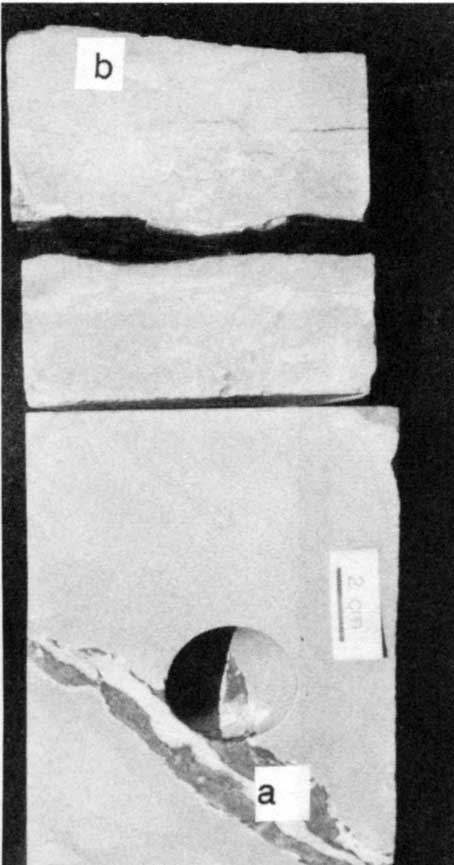
Figure 9--Mississippian-Pennsylvanian contact in #1 Schauf core at core depth 4,959 ft.
Facies SH commonly consists of gray to dark-green limy shale that interfingers with brown to dark-gray argillaceous carbonate mudstone and wackestone (fig. 12). The facies is moderately to completely bioturbated. Whole, unabraded brachiopods and echinoderm fragments are the dominant allochems in this facies. Facies SH varies in thickness from 3 ft (92 cm) to less than 1 ft (30 cm) in thickness and interfingers with the dark-colored peloidal wackestones of facies PW or the medium- to light-colored bioclastic packstones and wackestones of facies BPW and commonly lies gradationally above facies LP-SH.
Fossiliferous noncarbonate portions of facies SH are interpreted to have been deposited slightly below the photic zone under normal-marine to slightly dysoxic conditions (Boardman and others, 1984). Argillaceous mudstones and wackestones probably accumulated slightly above the base of the photic zone under normal-marine conditions. At the base of sequences e and f, and within sequence j, facies SH correlates to black shales (up to 10 ft thick) in Seward County. Lower-shelf black shales commonly grade shelfward into gray to dark-gray slightly burrowed shales (Watney and others, 1989).
Facies PW ranges from dark gray to brown to gray, is commonly burrow mottled, and locally contains abundant solution-seam stylolites (fig. 12). Dominant allochems in facies PW include peloids, echinoderm fragments, brachiopods, and, locally, fusilinids. Forams, phylloid algae, and intraclasts are less common. Allochems are generally whole and unabraded. Burrowing is moderate to extensive. Facies PW is less than 2 ft thick (61 cm) and generally lies gradationally above facies SH or LP-SH and is gradationally overlain by facies SH or BPW.
Facies PW is interpreted to have been deposited below wavebase under normal aerobic to slightly dysoxic conditions and is considered to be transitional between facies LP-SH or SH and BPW.
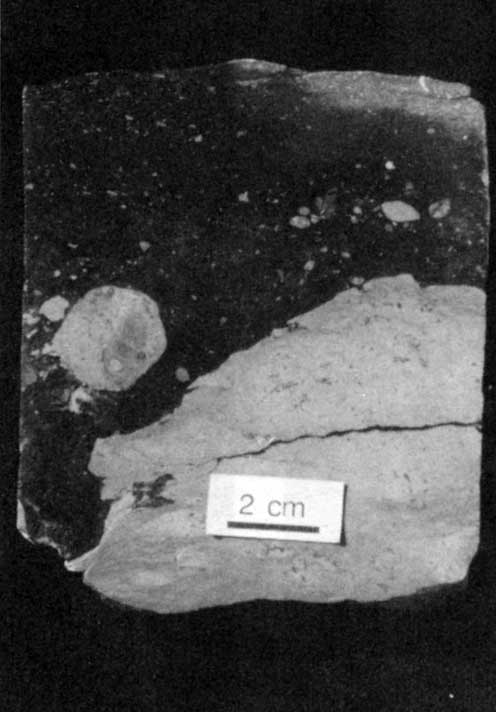
Figure 10--Facies LP-SH showing gradational nature of transgressive lag deposit into overlying dark-gray shale and carbonate mudstone to wackestone. Photo taken above sequence h at core depths 4,901-4,902 ft; a) phosphate nodules, and b) lithoclasts
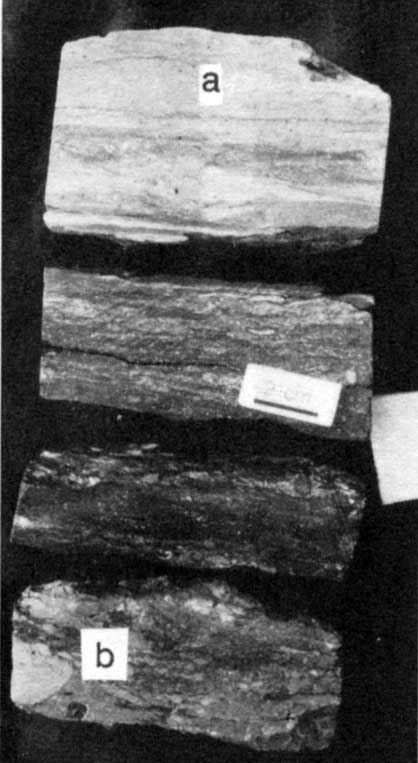
Figure 11--Facies LP-SH sharply overlying facies IP above sequence i (core depth 4,916.5 ft).
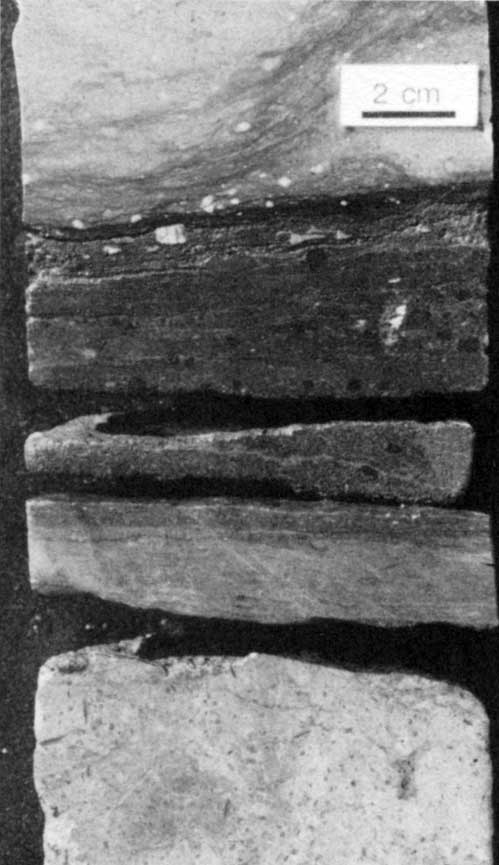
Figure 12--Core depth 4,878-4,873 ft showing a) top of sequence f overlain by b) facies LP-SH that grades up into c) facies SH. Facies SH grades up into d) facies PW. Jacob staff stripes equal 5 cm.
Tubular and encrusting forms, fusilinids, peloids, and phylloid algae are locally abundant and are the dominant allochems in the tan to light-gray packstones. Brachiopods, crinoids, fusilinids, and corals are locally common but are more common in the medium-gray to tan wackestones. Chaetetids, bryozoans, and ostracodes are present locally. Bioturbation is pervasive throughout the facies.
Fragments of phylloid algae and mollusks, coated grains, and intraclasts become most common towards the top of facies BPW. Root traces are common near the tops of sequences and below the light-colored intraclastic packstones and wackestones of facies IP. In general, facies BPW grades vertically from medium-gray or light-colored wackestones into light-gray to tan packstones; however, this trend is commonly interrupted by the development of facies LP-SH, PW, or SH. Facies BPW varies from 15 ft (13.7 m) to about 2 ft (1.8 m) in thickness.
Solution-seam and suture-seam stylolites are common and locally abundant. Their effects are particularly pronounced in some fusilinid packstones (fig. 13). Very dark gray clay is a common residue in the stylolites and may account for the high gamma-ray readings within portions of this facies.
Facies BPW is interpreted to have been deposited from below to slightly above normal wavebase under normal marine conditions. The commonly broken but relatively unabraded allochems in the medium- to dark-gray wackestones indicate occasional reworking of sediment by storm waves and bioturbation. The appearance of coated grains, intraclasts, and more heavily abraded bioclastic material near the top of some of the sequences suggests periodic deposition above wavebase for these intervals. The relative decrease in corals, brachiopods, crinoids, and fusilinids and commensurate increase in phylloids and mollusks up through the section also indicate a vertical decrease in water depth (Boardman and others, 1984). The development of facies LP-SH, SH, or PW, which interrupts the general shoaling-upward pattern of facies BPW, represents minor deepening events.
Figure 13--Heavily styolitized portion of facies BPW resulting in fusilinid packstone from core depth 4,926 ft.
Facies SP locally displays crossbedding and contains heavily abraded allochems and lithoclasts (fig. 14). Facies SP is present only at the top of sequence 1 (fig. 7), where it is about 2.5 ft (2.25 m) thick. It is gradationally overlain by facies IP and interfingers with facies BPW.
Facies SP is interpreted to have been deposited under high-energy conditions above normal wavebase and may represent lower shoreface deposition.
Figure 14--L-k sequence boundary at core depth 4,954 ft showing sharp contact between facies SP and overlying facies BPW. a) caliche nodule in thin cap of lithoclastic packstone.
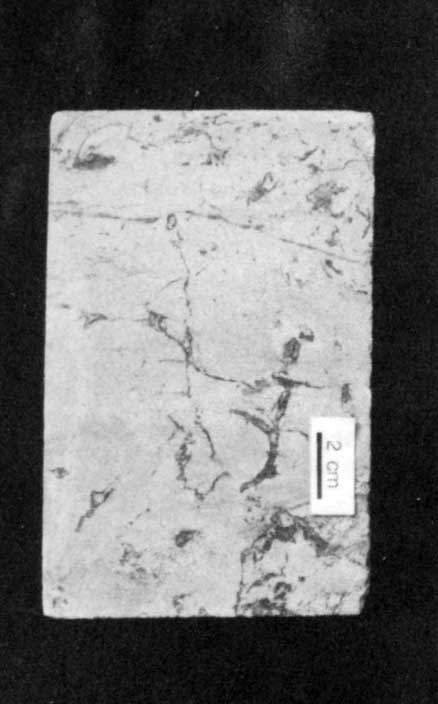
Facies IP is generally light green to light gray in color. Autoclastic brecciation, root molds, rhizocretions, and cream to dark-brown caliche crusts are common (figs. 15, 16, 17, 18, and 19). Alveolar textures, rhizocretions, and circum-granular cracking are common features in thin section (figs. 20, 21, 22, 23, and 24). Intraclasts range from several centimeters to less than 1 mm in diameter and average about 3 mm. The matrix is a green to light-gray micrite that locally displays a clotted peloidal texture in thin section. Facies IP ranges from less than a foot (30 cm) to about 2.5 ft (77 cm) in thickness, is gradational with underlying facies (generally facies BPW), and is sharply overlain by the succeeding facies (generally facies LP-SH; fig. 15). Less commonly, facies EP is overlain by either facies PW or BPW.
The common rhizocretions, autoclastic brecciation, root traces, caliche nodules, circumgranular cracking, and alveolar textures indicate this facies is a product of subaerial exposure. The commonly green to light-gray coloration is probably a function of post-exposure transgression and gleying of the tops of soil profiles (Joeckel, 1991). The exposure surface on top of sequence f displays color gradation from green and cream at the top into red and tan near the base (fig. 23), a common attribute in soils that have experienced significant gleying (Joeckel, 1991).
Figure 15--H-f sequence boundary showing autoclastic nature of facies IP, gradational contact with underlying facies BPW and sharp contact with overlying facies LP-SH.
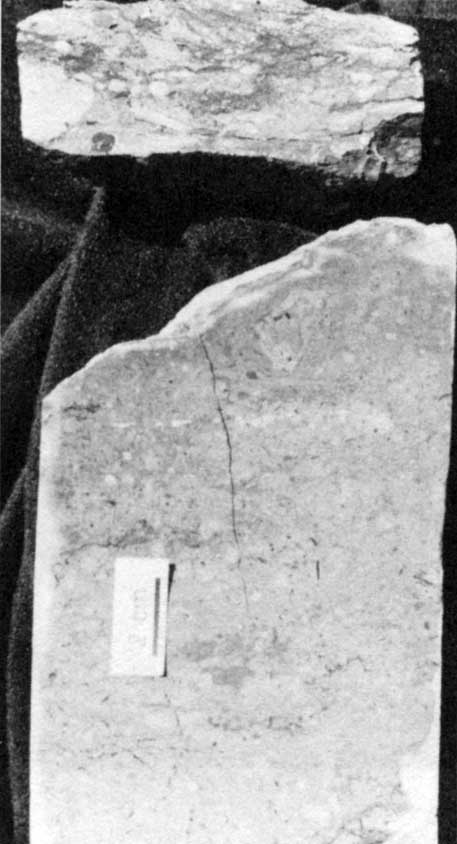
Figure 16-Facies IP at top of sequence i. a) caliche crust, b) glaebuls.
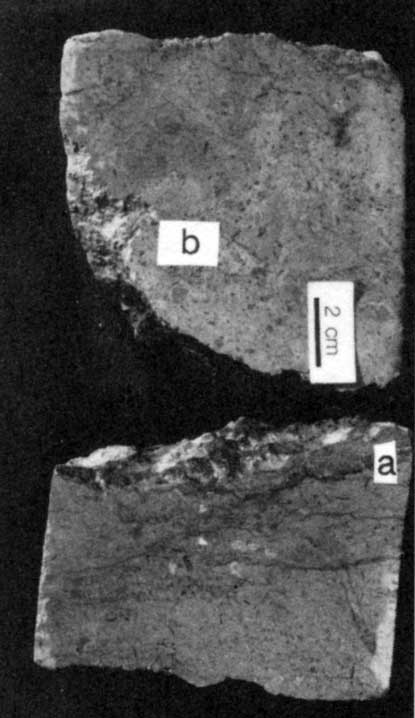
Figure 17--Facies EP at top of sequence f, core depth 4,977-4,978. a) intragranular cracking, b) caliche nodules, c) caliche crusts, d) root molds.
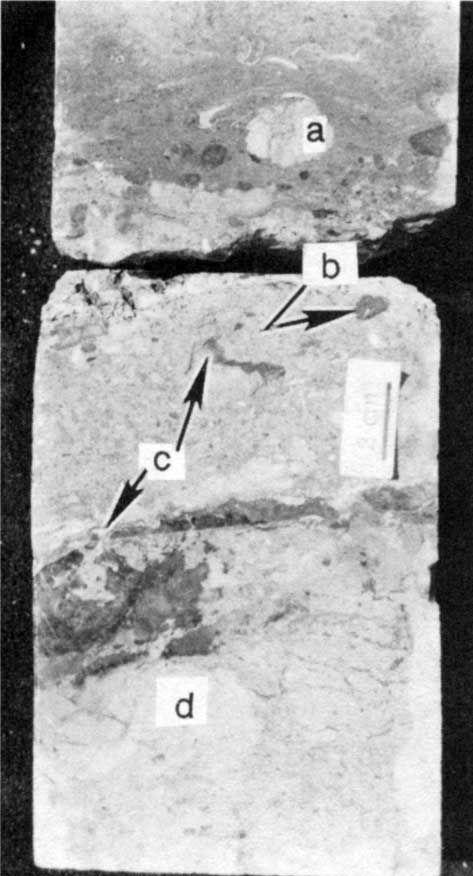
Figure 18--Top of sequence k showing autoclastic nature of facies IP gradationally overlying facies BPW (core depth 4,947 ft). a) caliche nodules.
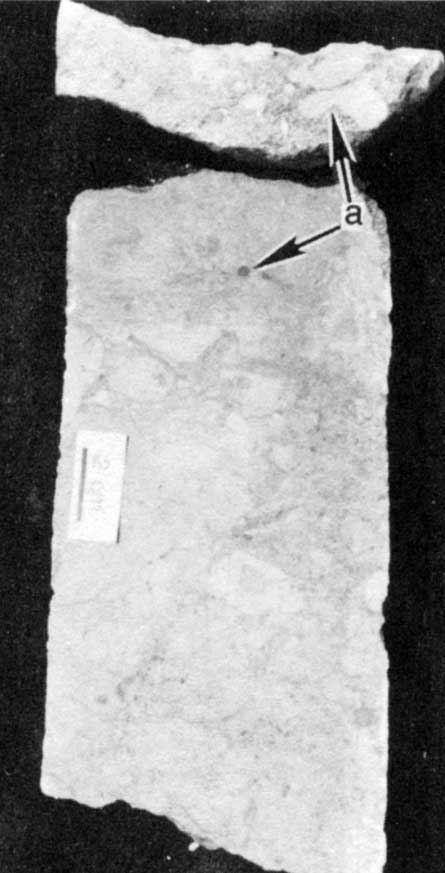
Figure 19--Green to gray slightly silty micrite filling root molds at top of sequence j.
Sequences are genetically related successions of strata bounded by unconformity surfaces or their correlative conformities (Mitchum, 1977). Sequence boundaries are identified by an abrupt basinward shift in facies or a change in parasequence stacking patterns (Van Wagoner et al., 1990). Van Wagoner (1985) defines a parasequence as ". . . a relatively conformable succession of genetically related beds... bounded by marine-flooding surfaces and their correlative surfaces." Sequence sets are groupings of sequences displaying similar progradational, aggradational, or retrogradational stacking patterns and are analogous to systems tracts within a single sequence (Mitchum and Van Wagoner, 1991). Lowstand, transgressive, and highstand sequence sets comprise a composite sequence (Mitchum and Van Wagoner, 1991).
Changes in the thicknesses and facies relationships within and between sequences may be a function of changes in tectonically controlled subsidence, eustatic sea-level changes, sedimentation rates, climate, or some combination of all four. While these various factors are tantalizing, it is beyond the scope of this investigation to develop these concepts further. The remainder of this paper focuses on the description and interpretation of the gross stratal relationships of lower Middle Pennsylvanian strata in the eastern Hugoton embayment.
The lithoclastic packstone at the base of facies LP-SH is interpreted to be a transgressive lag deposited on a ravinement surface (fig. 26). The transgressive lag grades vertically into a dark-gray to black shale interpreted to be a condensed section (fig. 26). Siliciclastic sedimentation lags behind transgression due to ponding of source areas (Heckel, 1989). Carbonate production may have been reduced during flooding because of nutrient excess and reduced clarity of the water column (Hallock and Schlager, 1986; Neumann and Macintyre, 1985). Drowning of the eastern Hugoton shelf occurred when the rate of sea-level rise exceeded the rate of carbonate accumulation and resulted in the formation of a condensed section. Watney et al. (1989) point out that flooding units commonly underlie and are gradational with overlying condensed sections.
Facies BPW shoals up in response to either a decrease in the rate of rise of relative sea level, a stillstand, or a drop in relative sea level. The minor deepening events that punctuate this facies probably represent parasequence surfaces associated with minor perturbations in relative sea level. Sequences j, i, h, and f appear to be composed of multiple stacked parasequences (shoaling-upward successions of strata capped by flooding surfaces). Although parasequences can be identified in the #1 Schauf, they are generally not distinctive enough on wireline logs to be traced regionally, and therefore are not emphasized in this report.
Facies IP represents an abrupt basinward shift in facies from subtidal carbonates below, directly into subaeriary exposed carbonates of the same facies above (figs. 14, 15, 16, 17, 18, 19, and 26). Technically, the base of this facies is the sequence boundary; however, because this facies is generally too thin to be resolved on wireline logs, I have picked its top as the sequence boundary.
Fig. 26 displays an ideal sequence (one without internal parasequences) to illustrate the succession and interpretation of facies recognized in the #1 Schauf core. In an ideal sequence the base of each sequence is marked by a thin transgressive lag that grades vertically into a condensed section. The condensed section grades vertically into a suite of facies that are interpreted to develop under increasingly shallower water conditions (facies SH-PW-BPW). The exposure surfaces at the tops of sequences delineate the sequence boundaries.
The vertical succession of strata in the "Gray group" displays an overall increase in accommodation space upwards through the section. Only the lowermost sequence (l) was deposited in a proximal, shoreface environ- ment. Exposure surfaces are common and closely spaced at the base of the "Gray group" but become less common upsection. Facies LP-SH and SH, interpreted as having accumulated under the deepest water of any of the facies, are absent in sequences k and l; however, these facies become progressively thicker and better developed vertically upwards through the stratigraphic section. In general, sequences thicken upward. These traits suggest an overall increase in accommodation space vertically up through the "Gray group."
Figure 20--Alveolar texture preserved between intraclasts in facies IP at core depth 4,878 ft (top of sequence f). Scale bar equals 0.5 mm.
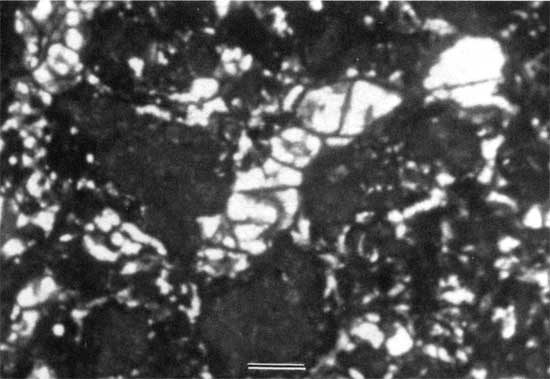
Figure 21--Spar-filled root molds surrounded by vaguely laminated caliche in facies IP at core depth 4,878 ft (top of sequence f). a) clotted peloidal caliche crust. Scale bar equals 0.5 mm.
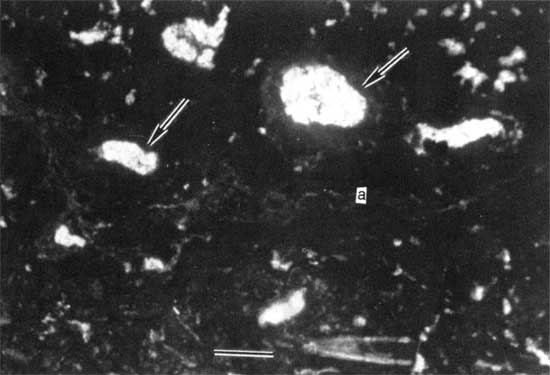
Figure 22--Rhizocretion with a) vague alveolar texture at core depth 4,902 ft (top of sequence h). Scale bar equals 0.5 mm.
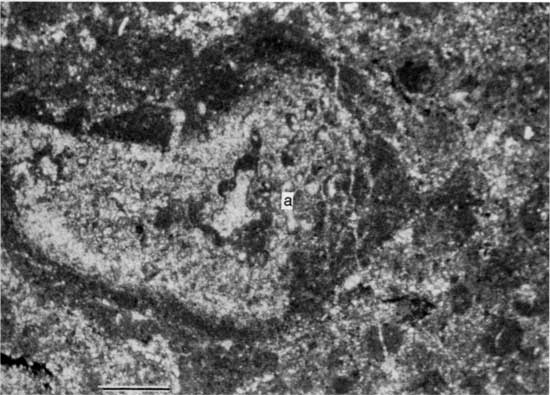
Figure 23--Circum and intragrganular cracking at core depth 4,916 ft (top of sequence i). a) rhizocretion within intraclast, b) glaebuls, c) echinoderm fragment. Scale bar equals 0.5 mm.
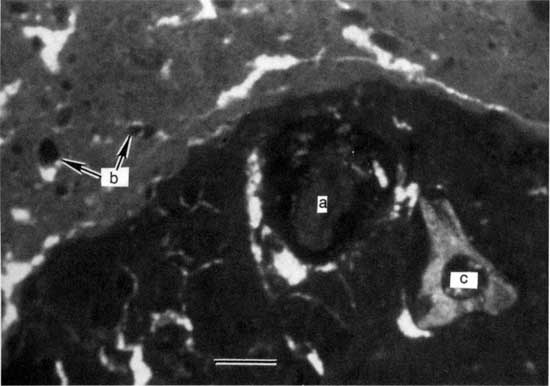
Figure 24--Spar-filled root trace penetrating intraclast at core depth 4,916 ft (top of sequence i). Scale bar equals 0.5 mm.
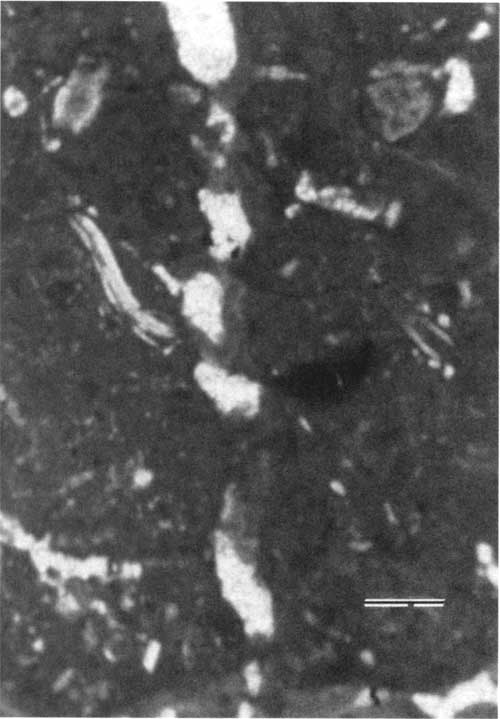
Figure 25--Photo taken immediately below fig. 17, at core depth 4,878 ft, displays original red coloration associated with subaerial exposure prior to gleying upon subsequent transgression.
Exposure surfaces that form sequence boundaries within the overall upward-deepening "Gray group" indicate that frequent relative sea-level fluctuations occurred during an overall rise of relative sea level. This pattern depicts the "Gray group" as a cyclic backstepping or retrogradational transgressive unit.
"Gray" and lower Cherokee Group sequences (from the "V" shale to the Kearny or Mississippian) are discussed according to their respective geomorphic position during deposition; however, at any single geographic location, the geomorphic environment constantly changed in response to changes in base level. At least 155 ft of topographic relief existed on the shelf from the Anadarko Production #1-A Milhon to the Rine #1 Salem (fig. 4) at the beginning of sequence i deposition. Gross stratal patterns between lower-shelf, mid-shelf, and proximal sequences are described in relative terms.
Figure 26--Ideal mid-shelf sequence displaying sequence stratigraphic interpretation of lithofacies recognized in #1 Schauf core. See fig. 7 for key.
Sequences f through m in the Anadarko Production #1-A Milhon are considered typical of lower-shelf sequences. Lower-shelf "Gray group" sequences range from 10 to 30 ft in thickness. The base of each sequence is marked by a "hot" black shale or "hot" limestone from 4 to 10 ft in thickness. Black shales are interpreted to have been deposited during periods of ocean-water stratification that probably occurred under rising (Calvert et al., 1987) or maximum water depths (Heckel, 1977, 1989). The shales are interpreted to be condensed sections and represent drowning of the lower Hugoton shelf.
Most black shales grade upward into clean limestones 4-20 ft thick. In sequences g and h, black shale grades into non-radioactive, shaly limestone up to 10 ft thick, before passing upward into clean limestones, up to 10 ft thick. Carbonate production probably began when water circulation improved and better oxygenated water was available at the sediment-water interface. Lower-shelf limestones probably began to accumulate in response to a fall in relative sea level that culminated in subaerial exposure of correlative mid-shelf limestones.
Sub-regional wireline correlations suggest that lower-shelf sequence boundaries are conformable and deposition is believed to have been continuous across them.
Sequences described in the #1 Schauf core are considered typical of mid-shelf sequences. Lower-shelf black "hot" shales are rare in mid-shelf sequences. "Hot" limestones may be locally developed immediately below sequence boundaries and may indicate localized concentrations of uranium in meteroic phreatic cements (Chung and Swart, 1990). However, because "hot" mid-shelf limestones are localized and thin, I have picked the sequence boundaries at the top of these radioactive events. The base of sequences are marked by a sharp ravinement surface overlain by a thin dark-gray to black lithoclastic packstone to lithoclastic and bioclastic shale that grades upwards into a thicker (up to 4 ft thick) non-radioactive shale or shaly limestone. Overlying limestones display a general shoaling-upward pattern. Subtidal carbonates are capped by subaerial exposure surfaces. Vuggy porosity is common near the top of sequences.
Lower-shelf black shales thin and grade into dark-gray to dark-green shales (up to 4 ft thick) in the mid-shelf, however, they are often too thin to be recognized on wireline logs. Dense lower-shelf limestones (up to 20 ft thick) may thicken rapidly into phylloidal to bioclastic wackestones and packstones (up to about 75 ft thick) in mid-shelf environments. Wireline-log cross sections reveal that shaly zones with low radioactivity (up to 10 ft thick), locally present in some lower-shelf sequences between underlying black shales and overlying clean carbonates, thin and grade into the overlying limestone facies toward the mid-shelf.
Mid-shelf sequences differ from lower-shelf sequences in that they are thicker, contain a greater percentage of carbonate rocks, and are separated from one another by small disconformities (sequence boundaries) delineated by subaerial exposure surfaces. Sequences a, c, e, and g were either not deposited or were removed by erosion in mid-shelf locations (figs. 4, 5, and 6). The presence of small disconformities, absence of some sequences that occur in equivalent lower-shelf locations, and lack of black shales reflect the decrease in accommodation space available on the mid-shelf compared to the lower shell
The proximal featheredges of "Gray group" sequences are present in incised valleys where post-depositional erosion has not removed them, although subaerial exposure and pedogenic processes may have significantly altered diem. Cores from a sub-Pennsylvanian incised valley, near the Minneola field in Clark County, give some insight into the proximal lithofacies of sequence i and possibly sequences j, k, and l as well (fig. 27).
Figure 27--Core description and wireline log of lower "Gray group" sequences in the Ladd #1 Harris, Ford County. Core depths were adjusted down 5 ft to match log depths. A larger Acrobat PDF version of this figure is available.
Sequence i has thinned from 20 ft, in the #1 Schauf, to about 10 ft in the Ladd Petroleum #1 Harris, sec. 9, T. 30 S., R. 25 W. (fig. 28). The manner in which sequence i thinned will be discussed later in this paper. Above and below sequence i, various forms of pedogenesis including karsting and caliche formation are well developed (figs. 29 and 30). The carbonates within sequence i are composed primarily of facies BPW and are generally similar to the facies that compose the bulk of sequence i in the #1 Schauf. However, in the #1 Harris, facies LP-SH and SH are not present and sequence i carbonates contain fenestral fabrics that are not well developed in the #1 Schauf (fig. 28).
Individual soil profiles below sequence i are difficult to distinguish from one another; consequently, correlation of the j and k sequence surfaces to the #1 Schauf are tentative. Two relatively well preserved limestone beds (2 and 4 ft thick respectively) are present about 3 and 8 ft below the base of sequence i. Despite the karsting within these carbonates (fig. 29), fossils of stenohaline openmarine organisms (e.g., crinoid and brachiopods) can be discerned. The limestones are separated by about 3.5 ft of green blocky shale with slickensides, caliche nodules, intraclasts, lithoclasts, and disoriented chaetetids. The two limestones may be proximal equivalents to the j or k limestones identified in the Schauf core (fig. 28).
Figure 28--Comparison of mid-shelf sequences i, j, and k in Gray County to possible proximal equivalents preserved within incised valley in Clark County. Well locations in fig. 2 and key in fig. 27. A larger Acrobat PDF version of this figure is available.
Figure 29--Core depth 5,289 ft in the #1 Harris, Clark County, displaying karst fill within limestone that may be proximal equivalent of carbonate beds within sequence j.
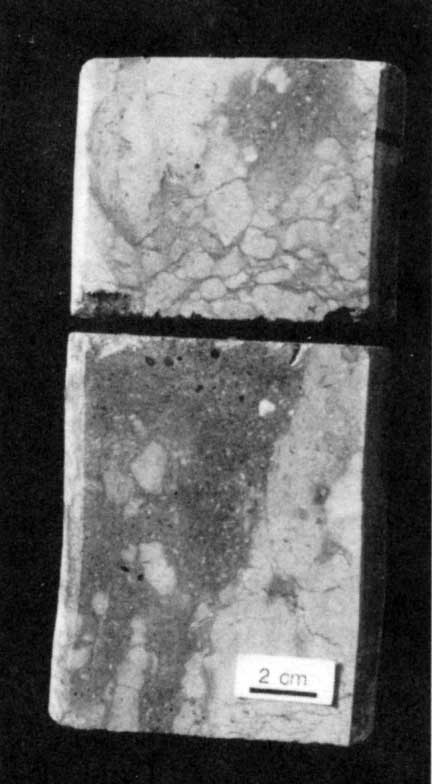
Figure 30--Contact between soil horizon and overlying sequence i carbonates in the Harris #1, Ford County.
Near the base of the #1 Harris core are two thin calcareous siltstones to very fine grain sandstones 1 and 1.5 ft thick, respectively. These clastic units display root traces at their tops and contain minor amounts of lithoclasts and heavily abraded shell fragments. These siltstones are separated by about 2 ft of blocky shale with slickensides and caliche nodules. The siltstones may represent the low-energy estuarine or strand-line equivalents to "Gray group" sequences k, 1, or m.
The lowermost siltstone grades down into about 7 ft of medium-gray to green, locally mottled, slightly silty, blocky shale (figs. 27 and 28). The shale contains slickensides, small calcareous nodules, gypsum rosettes, rare shell fragments, and possible plant material. Evidence for subaerial exposure of these shales prior to the deposition of the overlying siltstone is equivocal.
Proximal sequences differ from mid-shelf sequences in that they are thinner, contain a suite of shallower water facies, and are more extensively affected by subaerial processes. These differences reflect the decrease in accommodation space available to sequences proximal to the Central Kansas uplift.
The vertical succession of strata, from the base of the #1 Harris core through sequence i, may be characteristic of the lateral intrasequence changes in facies from proximal to mid-shelf positions. Mid-shelf carbonate beds appear to grade shoreward into thin subtidal to upper intertidal carbonates before passing further shoreward into terrigeneous strand or estuarine units, or merging into undifferentiated soil profiles.
Mitchum et al. (1977) identified six types of straw terminations based upon reflection seismic records. Similar terminations can be discerned using wireline-log cross sections. Figs. 31 and 32 display correlations of limestones and shales within sequence i from Seward County to a position more proximal to the Central Kansas uplift in Clark County. In general, lower Middle Pennsylvanian sequences of the mid-shelf thin by downlap into the basin and thin by toplap into proximal areas. The resulting sequences are best described as sigmoidal.
Figure 31--Cross section I1-I1' displaying intrasequence correlations and the thickening of sequence i from the lower shelf to the mid-shelf. A larger Acrobat PDF version of this figure is available.
Figure 32--Cross section I2-I2' displaying intrasequence correlations and the thickening of sequence i from the mid-shelf to proximal areas. A larger Acrobat PDF version of this figure is available.
A vertical succession of sequences, within each paleogeomorphic position, displays a repetitious and predictable suite of facies; consequently, sequences can be translated into lower-shelf, mid-shelf, and proximal cycles.
"Gray group" cycles differ from Missourian-age cyclothems as described by Heckel (1977, 1989; fig. 33) depending on their geomorphic position during deposition (fig. 34). Lower-shelf cycles contain no obvious middle (transgressive) limestone; instead, the base of each cycle is marked by a condensed section of radioactive black shale (up to 10 ft thick) that is equivalent to Heckel's core shale. The black shales grade vertically into an upper (regressive) limestone before being capped by the black shale of the succeeding cycle. Lower-shelf cycles are not capped by an outside shale equivalent.
Figure 33--Typical Missourian-age Kansas cyclothem (Heckel, 1977, 1989).
Figure 34--Generalized "Gray group" cycles and compison of components to Heckel's cyclothem terminology (1977, 1989).
The bases of mid-shelf cycles are marked by a very thin transgressive lag (generally less than a foot thick) that is equivalent to Heckel's middle limestone. The transgressive lag grades vertically into a very thin condensed section (generally less than 2 ft thick) that is equivalent to the core shale. The shoaling-upward carbonates that overlie the condensed sections are similar to Heckel's upper limestones; however, like lower-shelf cycles, midshelf cycles contain no obvious outside shales.
Middle limestones and core shales are not identifiable as such in proximal cycles. Condensed sections are not present in proximal cycles (fig. 34); however, the thin subtidal carbonates or clastic-dominated units are probably their shoreward equivalents. Proximal sequences contain ,thick well-developed soil profiles that developed during a fall in relative sea level that are partially equivalent to the shoaling-upward mid-shelf carbonates. These thick soil profiles are similar to Heckel's outside shales.
Lower-shelf cycles represent continuous deposition but are thin due to ocean-water stratification and retardation of carbonate production. Mid-shelf cycles are thickest because environmental conditions were conducive to carbonate-producing organisms, and carbonate deposition ceased under subaerial conditions for a relatively brief period of time. Proximal cycles are thin because they lacked accommodation space and were subaerially exposed for extended periods of time.
Glacioeustatic sea-level changes have been widely cited as the driving force behind development of Pennsylvanian cycles (or sequences) in the midcontinent (Heckel, 1986; Watney et al., 1990). Recent investigations of Quaternary siliciclastic continental sediments deposited on the Atlantic shelf suggest Pleistocene glacioeustatic cycles are markedly asymmetric (Evans, 1979) and contain a similar suite of facies to mid-shelf "Gray group" cycles in the eastern Hugoton embayment.
As described in the #1 Schauf core, each sequence displays a shoaling-upward pattern, locally punctuated with smaller-scale deepening events. Heckel (1986) estimated that the duration of "minor" Pennsylvanian cycles range from about 40,000 to 120,000 years and up to about 400,000 years for "major" cycles. These cycle durations are approximately equivalent to fourth- or fifth-order relative sea-level cycles, respectively (table 1). Quaternary cycles presented by Evans (1979) average about 100,000 yrs and would be equivalent to fourth-order cycles (fig. 35). The duration of higher frequency "Gray group" cycles is uncertain at this point.
Table 1--Hierarchy of rock cycles relating to relative change in sea level.
| Order | Time Span | Described by |
|---|---|---|
| 1st | 100 million+ | Pittman, 1978; Kominz, 1984 |
| 2nd | 5-100 million | Vail and others, 1977; Haq and others, 1987 |
| 3rd | 1-5 million | Vail and others, 1977; Haq and others, 1987 |
| 4th | 0.1-1 million | Goldhammer and others, 1990 |
| 5th | 0.01-0.1 million | Goldhammer and others, 1990 |
Figure 35--Conceptural cross section from distal Hugoton shelf to proximal Hugoton shelf. The figure is a composite rendering of over 20 cross sections and displays interpreted relative sea-level curves and simplistic gross facies relationships within lower Middle Pennsylvanian sequences.
Regional cross sections reveal that sequences a, c, e, and g are restricted to distal portions of the eastern Hugoton shelf (figs. 4, 5, 6, and 35) and indicate a decrease in accommodation space on the shelf from "Gray" through lower Cherokee Group deposition.
The wireline log of the Anadarko Production Co. Milhon #1-A illustrates the southwestward progradation of mid-shelf sequences over lower-shelf sequences (fig. 4). Lower Cherokee Group sequences a through e display different wireline-log characteristics than underlying "typical" lower-shelf sequences f-m. Sequences d and e have wireline-log characteristics that are transitional between "typical" lower-shelf sequences f-m and sequences a through c. Wireline-log characteristics of sequences a, b, and c in the Milhon #1-A resemble midshelf sequences f, h, and i in the #1 Schauf (fig. 4). The vertical change in wireline-log characteristics in the #1-A Milhon, from sequences f-m to sequences a-e, emulates the lateral change in wireline characteristics from "typical" lower-shelf sequences to correlative mid-shelf sequences. These vertical relationships indicate that mid-shelf facies prograded basinward from "Gray" through lower Cherokee Group deposition in response to a lowering of base level on the shell The vertical decrease in black shales and concomitant increase in limestone, from "Gray" through Cherokee sequences, indicate a decrease in the elevation of the pycnocline that also may reflect a lowering of base level.
The decreases in accommodation space on the shelf and progradation of mid-shelf facies basinward, from "Gray" through lower Cherokee Group deposition, is interpreted to represent a third-order regression (fig. 35; table 1).
Lower Cherokee and "Gray group" sequences overstep older sequences and onlap the sub-Pennsylvanian unconformity surface, except for lowstand wedges a, c, e, and g, despite the third-order fall in relative sea level. This indicates that a second- or larger-order rise in relative sea level, perhaps associated with the beginning of the Absaroka cratonic sequence, continued throughout "Gray" and Cherokee group deposition.
Lower "Gray group" sequences j through m successively overstep older sequences and onlap the sub-P-ennsylvanian unconformity surface with little change in thickness from southwest to northeast (figs. 4, 5, 6, and 35). Wireline logs and cores do not indicate the presence of parasequences in sequences k-m, and only very thin subtle parasequences are recognized in the youngest sequence Q). The vertical profile of sequences j-m in the #1 Schauf display successively more distal facies vertically up section (fig. 7). These traits suggest that a third-order rate of relative sea-level rise dominated fourth- or fifth-order relative sea-level cycles during deposition of sequences j-m. Sequences j-m are interpreted to have been deposited during maximum rates of a third-order relative sea-level rise and are consistent with deposition during a transgressive sequence set (Mitchum and Van Wagoner, 1991).
Upper "Gray group" sequences i-f also successively overstep older sequences and onlap the sub-Pennsylvanian unconformity surface, with the exception of sequence g which onlaps sequence h. However unlike sequences m-j, sequences i-f increase in thickness over threefold from a lower-shelf to mid-shelf setting. Sequences i-f display internal toplapping and downlapping forms indicative of the presence of thick progradational to aggradational parasequences (figs. 31 and 32). The development of these aggradational to progradational parasequence sets are suggestive of deposition during the early part of a highstand systems tract (Van Wagoner et al., 1990). Because sequences i-f display similar stacking patterns, they probably represent an early highstand sequence set and suggest that the third-order rate of relative sea-level change began to rise more slowly or even fall.
Younger sequences of the lower Cherokee Group thicken basinward of older sequences and display a distinct progradational pattern (fig. 35). Half of the lower Cherokee Group sequences onlap subadjacent sequences and are restricted to distal portions of the eastern Hugoton shell Lower Cherokee Group sequences indicate deposition during a third-order fall in relative sea-level and are suggestive of deposition within a late highstand to lowstand sequence set.
Van Wagoner et al. (1990) describes lowstand wedges as being "... characterized on the shelf by incised-valley fill, which commonly onlaps onto the sequence boundary, and on the slope by progradational fill with wedge geometry overlying and commonly downlapping onto the basin-floor.... Lowstand wedges are composed of progradational to aggradational parasequence sets." Units a, c, e, and g are considered lowstand wedges because they are basinally restricted and onlap subadjacent sequences (figs. 4, 5, 6, and 35). Lowstand wedges develop during slow falls or lowstands of sea level. Present core data are insufficient to determine whether these units are parasequences within the overlying sequences (shoaling-upward units capped by flooding surfaces), or sequences themselves (displaying an abrupt basinward shift in facies at their tops). For simplicity, lowstand wedge units a, c, e, and g are considered sequences until more core data can be obtained.
The "Gray group" is probably at least partially Atokan in age and lies with slight disconformity above the Kearny (probable Morrowan-age rocks) in the eastern Hugoton embayment. "Gray" and Cherokee Groups form one relatively continuous body of carbonate-dominated strata which overstep the Kearny, and successively onlap the sub-Pennsylvanian unconformity surface toward the Central Kansas uplift. "Gray group" rocks are conformable with Cherokee Group strata in Seward County but become slightly disconformable (by depositional hiatus) proximal to the Central Kansas uplift. The base of the "Gray group" is delineated at the first occurrence of black shales and limestones above the shales, sandstones, and coals of the Kearny. In Seward County, the top of the "Gray group" is placed at the top of two thin, limestone-black-shale couplets about 150 ft above the Kearny and immediately below a sub-regionally extensive black shale. Shelfward, the top of the "Gray group" is recognized at the top of a succession of dense, massive limestones lying immediately below the thinly bedded shaly limestones of the Cherokee Group.
I wish to thank Tony Walton, Continental Exploration, Inc., and KTEC, Inc. for supporting this research with encouragement and finances. Special thanks to Lynn Watney, Evan Franseen, and John O. French at the Kansas Geological Survey for many helpful suggestions and insights.
Boardman, D. R., Mapes, R. H., Yancey, T. E., and Malinky, J. M., 1984, A new model for depth-related allogenic community succession within North American Pennsylvanian cyclothems and implications on the black-shale problem: Tulsa Geological Society, Special Publication 2, p. 141-182
Calvert, S. E., Vogel, J. S., and Southon, J. R., 1987, Carbon accumulation rates and the origin of the Holocene sapropel in the Black Sea: Geology, v. 15, p. 918-921
Chung, G. S., and Swart, P. K., 1990, The concentration of uranium in freshwater vadose and phreatic cements in a Holocene ooid cay--a method of identifying ancient water tables: Journal of Sedimentary Petrology, v. 60, p. 735-746
Clark, S. L., 1987, Seismic stratigraphy of Early Pennsylvanian Morrowan sandstones, Minneola Complex, Ford and Clark counties, Kansas: American Assoc. of Petroleum Geologists, Bulletin, v. 71, p. 1,239-1,341
Devoto, R. H., 1980, Mississippian stratigraphy and history; in, Colorado Geology, H. C. Kent and K. W. Porter: Rocky Mountain Assoc. of Geologists, p. 57-70
Emery, M., 1983, A detailed investigation of a Morrowan sandstone reservoir, Lexington field, Clark County, Kansas: M.S. thesis, Wichita State University, 126 p.
Emery, M., and Sutterlin, P.G., 1986, Characterization of a Morrowan sandstone reservoir, Lexington field, Clark County, Kansas: Shale Shaker Digest, v. , p. 18-33
Evans, G., 1979, Quaternary transgressions and regressions: Geological Society of America, Bulletin, Part I, v. 90, p. 59-83
Goldhammer, R. K., Dunn, P. A., and Hardie, L. A., 1990, Depositional cycles, composite sea-level changes, cycle stacking patterns, and the hierarchy of stratigraphic forcing--examples from alpine Triassic platform carbonates: Geologic Society of America, Bulletin, v. 102, p. 525-562
Hallock, P., and Schlager, W., 1986, Nutrient excess and the demise of coral reefs and carbonate platforms: Palaois, v. 1, p. 389-398
Haq, B. U., Hardenbol, J., and Vail, P.R., 1987, Chronology of fluctuating sea levels since the Triassic: Science, v. 235, p. 1,156-1,167
Heckel, P. H., 1977, Origin of phosphatic black-shale facies in Pennsylvanian cyclothems of midcontinent North America: American Assoc. of Petroleum Geologists, Bulletin, v. 61, p. 1,045-1,068
Heckel, P. H., 1986, Sea-level curve for Pennsylvanian eustatic marine transgressive-regressive depositional cycles along midcontinent outcrop belt, North America: Geology, v. 14, p. 330-334
Heckel, P. H., 1989, Current view of midcontinent Pennsylvanian cyclothems; in, Middle and Late Pennsylvanian Chronostratigraphic Boundaries in North-central Texas--Glacial-Eustatic Events, Biostratigraphy, and Paleoecology, D. R. Boardman, U, J. E. Barrick, J. Cocke, and M. K. Nestell: Texas Tech University, Studies in Geology, v. 2, p. 7-34
Joeckel, R. M., 1991, Palosol stratigraphy of the Eskridge Formation; early Permian pedogenesis and climate in southeastern Nebraska: Journal of Sedimentary Petrology, v.6l,p.234-255
Kominz, M. A., 1984, Oceanic ridge volumes and sea-level changes--an error analysis; in, Interregional Unconformities and Hydrocarbon Accumulation, J. S. Schlee, ed.: American Assoc. of Petroleum Geologists, Memoir 36, p. 109-127
McManus. D. A., 1956, Stratigraphy and depositional history of the Kearny formation (Lower Pennsylvanian) in western Kansas: Ph.D. dissertation, University of Kansas, Lawrence, Kansas
Merriam, D. F., 1963, The geologic history of Kansas: Kansas Geological Survey, Bulletin 162, p. 317 [available online]
Mitchum, R. M., 1977, Seismic stratigraphy and global changes of sea level, Part 1--Glossary of terms used in seismic stratigraphy; in, Seismic Stratigraphy Applications to Hydrocarbon Exploration, C. E. Payton, ed.: American Assoc. of Petroleum Geologists, Memoir 26, p. 205-212
Mitchum, R. M., and Van Wagoner, J. C., 1991, High-frequency sequences and their stacking patterns--sequence stratigraphic evidence of high-frequency eustatic cycles: Sedimentary Geology, v. 70, p. 131-160
Mitchum, R. M., Vail, P. R., and Thompson, S., III, 1977, Seismic stratigraphy and global changes of sea level, Part 2--the depositional sequence as a basic unit for stratigraphic analysis; in, Seismic Stratigraphy Applications to Hydrocarbon Exploration, C. E. Payton, ed.: American Assoc. of Petroleum Geologists, Memoir 26, p. 53-62
Neumann, A. C., and Macintyre, I., 1985, Reef response to sea-level rise--keep up, catchup, or give up: Proceedings of the Fifth International Coral Reef Congress, Tahiti, v. 3, p. 105550
Pittman, W. C., 1978, Relationship between eustacy and stratigraphic sequences of passive margins: Geologic Society of America, Bulletin, v. 89, p. 1,389-1,403
Rader, K., 1987, Petrographic and subsurface analysis of Pennsylvanian Morrow sandstones of southwestem Kansas: M.S. thesis, University of Colorado, 106 p.
Rascoe, B., Jr., and Adler, F. J., 1983, Permo-Carboniferous hydrocarbon accumulations, midcontinent, U.S.A.: American Assoc. of Petroleum Geologists, Bulletin, v. 67, p. 979-1,001
Robinson, R. J., 1983, Geochemical investigation of diagenetic history of Pennsylvanian Morrowan sandstone, Lexington field, Clark County, Kansas: M.S. thesis, Kansas State University
Swanson, D. C., 1979, Deltaic deposits in the Pennsylvanian upper Morrow formation of the Anadarko basin; in, Pennsylvanian Sandstones of the Midcontinent, N. J. Hyne, ed.: Tulsa Geological Society, Special Publication 1, p. 115-168
Van Wagoner, J. C., 1985, Reservoir facies distribution as controlled by sea-level change (abs.): Society of Economic Paleontologists and Mineralogists Mid-Year Meeting, Golden, Colorado, August 11-14, p. 91-92
Van Wagoner, J. C., Mitchum, R. M., Campion, K. M., and Rahmanian, V. D., 1990, Siliciclastic sequence stratigraphy in well logs, cores, and outcrops: American Assoc. of Petroleum Geologists, Methods in Exploration Series, no.7, 55 p.
Watney, L. W., French, J. A., and Franseen, E. K., 1989, Sequence stratigraphic interpretations and modeling of cyclothems: Kansas Geological Society, 41st Annual Field Trip Guidebook, 211 p.
Wheeler, D. M., Scott, A. J., Coringrato, V. J., and Devine, P. E., 1990, Stratigraphy and depositional history of the Morrow Formation, southeast Colorado and southwest Kansas; in, Morrow Sandstones of Southeastern Colorado and Adjacent Areas, S. A. Sonnenberg, L. T. Shannon, K. Rader, W. F. Von Drehle, and G. W. Martin, eds.: Rocky Mountain Assoc. of Geologists, Special Paper, p. 3-35
Zeller, D. E. (ed.), 1968, The stratigraphic succession in Kansas: Kansas Geological Survey, Bulletin 189, 81 p. [available online]
Kansas Geological Survey
Comments to webadmin@kgs.ku.edu
Web version created July 6, 2012. Original publication date 1991.
URL=http://www.kgs.ku.edu/PRS/publication/1991/OFR91_52/Youle/index.html