Kansas Geological Survey, Open-file Report 2017-30
KGS Open File Report 2017-30
for the Oil & Gas Conservation Division, Kansas Corporation Commission
April 2017
The complete text of this report is also available as an Adobe Acrobat PDF file (1 MB).
An irrigation well in western Pawnee County in the SW SW SW Sec. 19, T. 21 S., R. 19 W (21S-19W-19CCC) was found to yield saline water of unknown origin. The well is located in the Pawnee River valley near the river channel. The Kansas Corporation Commission (KCC) sent two water samples from the well to the Kansas Geological Survey (KGS) for chemical analysis and identification of salinity source(s). This report contains the results of the analyses of the samples and an interpretation of the results for salinity identification.
Staff of Conservation Division 1, KCC sent the samples in plastic bottles in a cooler to the KGS. Sample information is included in table 1. The KGS kept the samples refrigerated until analysis.
The KGS filtered the water samples through 0.45 µm membrane filter paper before analysis. Specific conductance was measured to estimate the chloride concentration and determine the dilution factor for the optimum concentration range of the analytical method. The concentrations of dissolved anions, including chloride, sulfate, and bromide, were measured using ion chromatography. Chemical data are listed in table 1.
Table 1—Sample collection information and chemical data.
| KGS lab no. | 2015080 | 2015081 |
|---|---|---|
| Collecting agency | KCC | KCC |
| Collector name | Michael Maier | Michael Maier |
| Sample source | Water well used for irrigation | Water well used for irrigation |
| Sample name | #2 | #3 |
| County | Pawnee | Pawnee |
| Legal location* | 21S-19W-19CCC | 21S-19W-19CCC |
| Latitude-longitude NAD83 | 38.20458, -99.45950 | 38.20458, -99.45950 |
| Sample date | 5/12/2016 | 5/12/2016 |
| Sample time | 2:16pm | 2:18pm |
| Date received | 5/19/2016 | 5/19/2016 |
| Bottle type | Plastic cube container | Plastic cube container |
| Field filtered | No | No |
| Transport chilled | Yes | Yes |
| Transport info | USPS Express Mail | USPS Express Mail |
| Specific conductance, µS/cm | 4,197 | 4,196 |
| Cl, mg/L | 1,323 | 1,329 |
| SO4, mg/L | 291.5 | 292.4 |
| Br, mg/L | 0.619 | 0.697 |
| SO4/Cl | 0.2204 | 0.2200 |
| Br/Cl x 10,000 | 4.68 | 5.24 |
| *Section quarters are designated by A = NE/4, B = NW/4, C = SW/4, and D = SE/4 in order from left to right of largest to smallest quarter. |
||
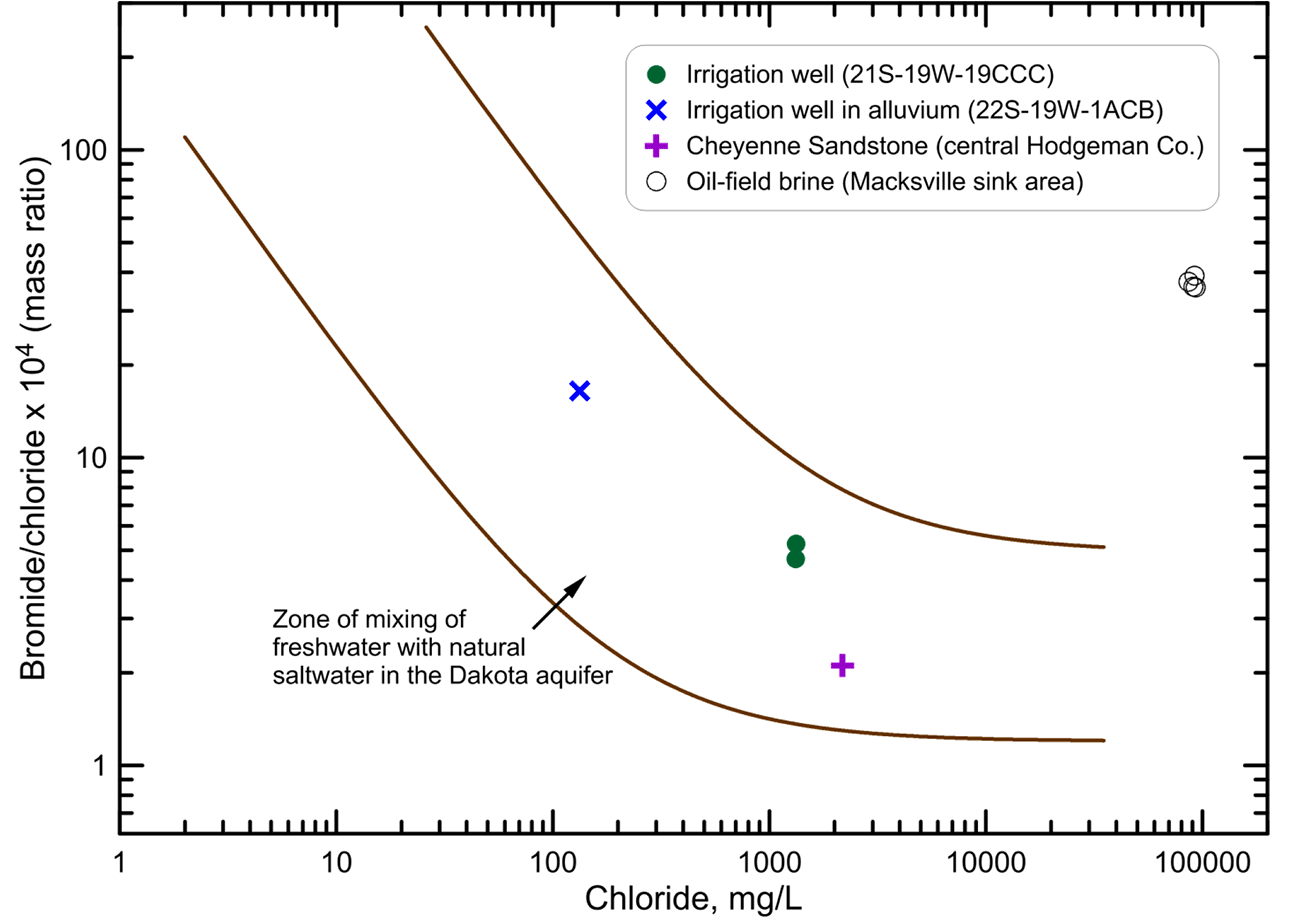
The sources contributing to chloride in the groundwaters were identified using the geochemical methods of Whittemore (1984, 1988, 1995). These methods primarily involve plots of the constituent mass ratios bromide/chloride and sulfate/chloride versus chloride concentration, with points for the water sample data and curves for the mixing of freshwaters with different saltwater source waters. Each mixing curve is generated using an algebraic equation for conservative mixing of two end-member waters. Conservative mixing refers to the simple mixing of waters without chemical reactions (such as mineral precipitation or adsorption, which could alter the concentrations of one or both of the constituents). Bromide and chloride are generally the most conservative constituents in groundwaters and surface waters. The bromide/chloride ratio is multiplied by 10,000 for graphical display to give numbers that range from about one upwards (the lowest mass ratios are near 0.0001 for halite or rock salt dissolution). Logarithmic scales are used in the graphs because they produce a more even distribution (separation) of points for large ranges in concentration and ratios than linear scales. The mixing curves bend in different directions on the log plots depending on the difference in the ratios relative to the difference in the chloride concentrations for the end points; the lines are straight on the log-log plot if horizontal, vertical, or order of magnitude differences in the ratios and chloride concentrations for the two end points are exactly the same.
Figure 1 is a bromide/chloride versus chloride concentration plot containing points for the two irrigation well samples, an irrigation well water from the alluvial aquifer of the Pawnee River valley about 7 miles east-southeast of the well, water from an observation well completed in the Cheyenne Sandstone in central Hodgeman County as part of the KGS Dakota Aquifer Program studies, and oil brines from the Macksville sink area in southeast Pawnee County. The Cheyenne Sandstone and oil brine samples are the closest available to the irrigation well location for which both chloride and bromide concentration data are available. The curves in fig. 1 define the zone of mixing of fresh groundwaters with natural saltwaters in the Dakota aquifer system (Dakota Formation, Kiowa Shale, and Cheyenne Sandstone) as displayed in fig. 29 in the appendix to KGS Bulletin 260 on the Dakota aquifer (Whittemore et al., 2014). The points for the samples from the irrigation well, the other irrigation well in the alluvial aquifer, and Cheyenne Sandstone well all fall within the mixing zone. The location of the point for the irrigation well water within the freshwater and Dakota saltwater mixing zone suggests that the source of salinity for the groundwater could be saline water from the Dakota aquifer system underlying the alluvial aquifer of the Pawnee River valley. The predominant source of naturally saline water where it exists in the Dakota aquifer system is the intrusion of saltwater from underlying Permian strata (Whittemore et al., 2014); the source of the saltwater in the Permian strata is the dissolution of halite (also called rock salt) deposited in Permian sediments (Whittemore, 1984, 1995). The bromide/chloride ratio for the irrigation well samples is too low for oil-field brine to be a significant source of the salinity as indicated by fig. 1.
Figure 1--Bromide/chloride ratio versus chloride concentration for groundwaters from the irrigation well, another irrigation well in the Pawnee River alluvial aquifer, an observation well in the Cheyenne Sandstone, and oil brines near the Macksville sink in southeast Pawnee County. Each curve represents the mixing of an end point for freshwater with an end point for natural saltwater from the Dakota aquifer system (from fig. 29 in Whittemore et al., 2014). The pair of curves encloses a zone of mixing between freshwater and natural saltwater.
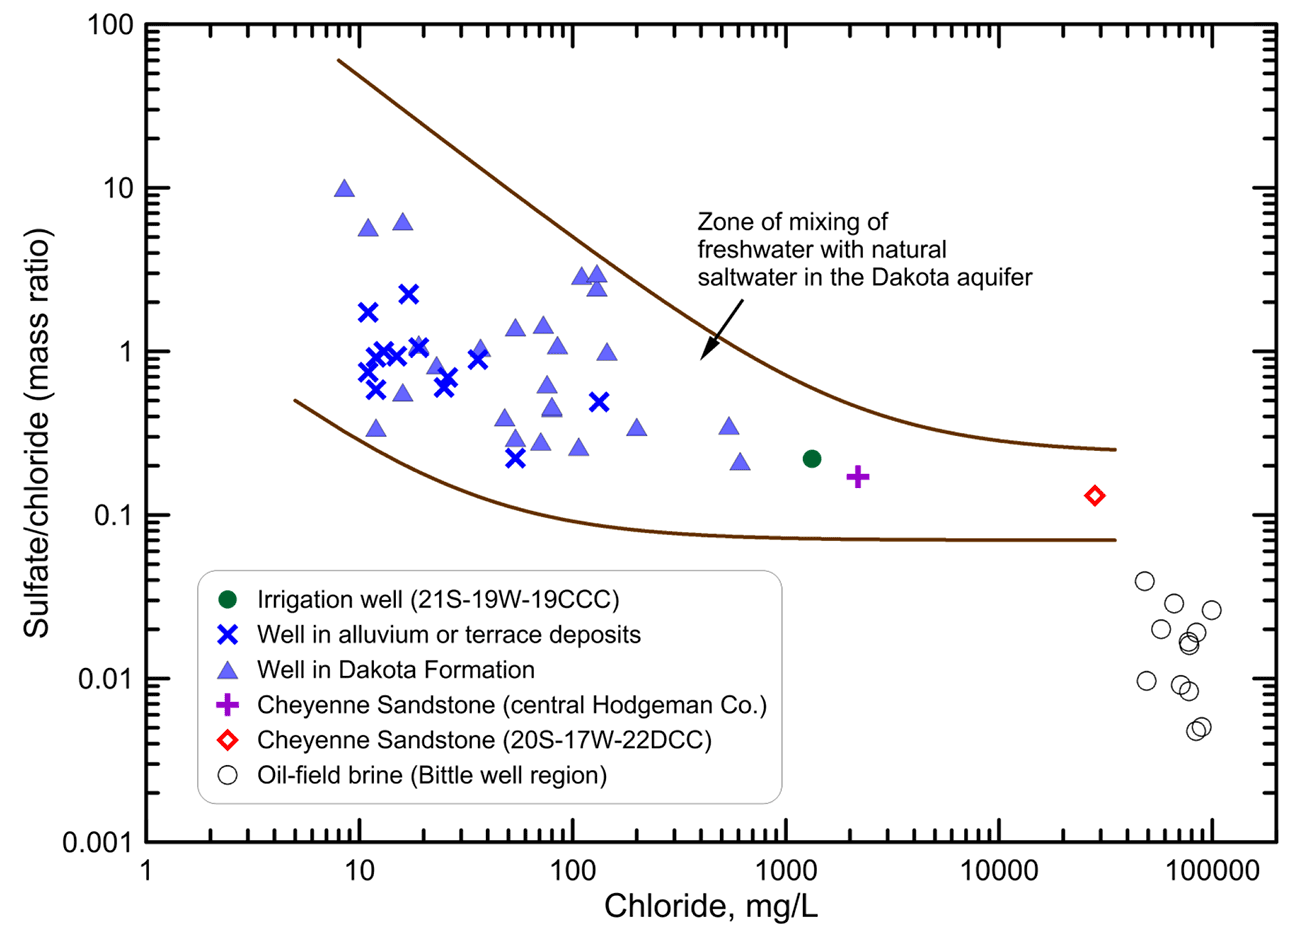
A sulfate/chloride ratio versus chloride concentration plot with mixing curves (fig. 2) is often a useful complementary approach to the bromide/chloride ratio plot for salinity source determination. Figure 2 displays points for the water samples collected from the irrigation well along with those for waters from wells in the alluvial aquifer and terrace deposits of the Pawnee River valley in the irrigation well region (within townships 21 and 22 S., ranges 18 through 20 W. in Pawnee County), in the Dakota aquifer in the irrigation well region (within townships 20, 21, and 22 S., ranges 16 through 21 W. in Pawnee and eastern Hodgeman counties), in the Cheyenne Sandstone in Pawnee County (SW SW SE Sec. 22, T. 20 S., R. 17 W.) and central Hodgeman County (the same sample for fig. 1), and from oil/gas wells in the irrigation well region (within townships 21 and 22 S., ranges 18 and 19 W.). The curves in fig. 2 define the zone of mixing of fresh groundwaters with natural saltwater in the Dakota aquifer system based on the data for the points displayed. The points for the two irrigation well samples (which overlie one another) lie within the center of the mixing zone. If the salinity source were mainly from oil or gas brine contamination, the sulfate/chloride ratio of the irrigation well water would be expected to be lower.
Figure 2—Sulfate/chloride ratio versus chloride concentration for groundwaters from the irrigation well, other water wells in the alluvium aquifer or terrace deposits of the Pawnee River valley in the irrigation well region, water wells in the Dakota aquifer in the irrigation well region, observation wells in the Cheyenne Sandstone in central Hodgeman and central Pawnee counties, and oil brines in the irrigation well region. Each curve represents the mixing of an end point for freshwater with an end point for natural saltwater from the Dakota aquifer system (bracketing the Cheyenne Sandstone sample from central Pawnee County). The pair of curves encloses a zone of mixing between freshwater and natural saltwater.
Salt used for road deicing and conventional water softeners would give a similar bromide/chloride geochemical signature as the natural saline water in the Dakota aquifer system that was derived from intrusion of halite dissolution saltwater in underlying Permian strata. However, the amounts of such potential sources at the irrigation well site are not expected to be significant because of the relatively small size of the road passing the site, the distance from any homes (the nearest is about 500 ft southwest of the well), and the mass of dissolved salt that would be necessary to significantly affect the volume of water produced by the irrigation well.
Based on available chemical data for samples from the alluvial aquifer of the Pawnee River valley in the region of the irrigation well, there is no evidence that substantial enough amounts of saline water from the underlying Dakota aquifer system have been naturally intruding into the base of the alluvial aquifer to produce saline water in the bottom of the aquifer. Wells completed in the Dakota aquifer in the irrigation well region (points shown on fig. 2) generally yield freshwater (in which the chloride concentration is up to 200 mg/L); depths range up to 312 ft for these wells. Wells in the Dakota aquifer system with chloride concentration greater than 200 mg/L (shown in fig. 2) have depths greater than 200 ft; the well depths for the two points with chloride concentrations of 540 mg/L and 610 mg/L had depths of 360 ft and 215 ft, respectively, and the sampling depths for the Cheyenne Sandstone wells were 410 ft (the higher of the chloride concentrations) and 640-720 ft.
No well log record could be found for the location of the irrigation well in the water well completion database (WWC-5) available online from the KGS. The individual using the well indicated that he thought the depth of the well was 165 ft. Information in the Water Information Management and Analysis System (WIMAS), also available online from the KGS, indicates that the water right history for the well location began in 1959. The first year of reported water use was 1981; the well depth included for that year was 129 ft, which is probably near the bottom of the Pawnee River alluvial aquifer. An application was filed for a change in the point of diversion to 10 ft northwest of the original well on August 27, 1987; the change was approved on March 30, 1988. The well depth for the first year of reported water use (1988) for the relocated well is 132 ft, which also is probably to the bottom of the alluvial aquifer. This depth was reported each year up to 2001; no well depth was reported after this year. Based on the fact that a replacement well was constructed well after the 1975 date which required water well drilling records to be filed, a search was made to see whether a log matching the general information for the well exists that might have a mislabeled location (such as an adjacent section, the township or range number off by one); no match was found.
The KCC indicated that the tenant farmer reported that the landowner had work done on the well about 15 years ago. This coincides with the last date that the 132 ft depth of the well was included in the water use reports. The owner of the land where the well is located indicated that the well had been worked on by Rosencrantz-Bemis Well Company. The KGS contacted that company and asked about any records or information that they might have for the well. The company replied that they had pulled the existing turbine pump and replaced it with a new pump and column pipe in October 2012. They measured the well depth at that time as 134 ft and the depth to water as 57 ft. They did not find any records that they had drilled the well. The measured depth of the well corresponds closely to the 132 ft last listed in the water use reports; the depth measured in 2012 might include a foot or two of casing above the ground.
The irrigation well is located in the area of the alluvial aquifer of the Pawnee River within a few hundred feet of the river channel. Many water wells exist within a 2-mile radius of the irrigation well location; the greatest depth to which the alluvium extends in that area is 152 ft, according to well logs in the WWC-5 database. The Dakota Formation underlies the Pawnee River alluvial aquifer. Based on a surface elevation of 2,086 ft as listed for the irrigation well in the WIZARD Water Well Levels database, available online at the KGS, the elevation of the bottom of the irrigation well is approximately 1,953 ft. The elevation of the top of the Kiowa Shale aquitard that separates the Dakota Formation from the lower Dakota aquifer (primarily the Cheyenne Sandstone) is approximately 1,850 ft as estimated from a hydrostratigraphic map (Macfarlane et al., 1993). The estimated elevation for the top of the lower Dakota aquifer is 1,780 ft based on another map in this publication. Thus, about 170 ft of strata separate the Cheyenne Sandstone from the bottom of the irrigation well.
Water levels have been measured since 1983 in the original well and then the current irrigation well by Groundwater Management District No. 5. Figure 3 includes a hydrograph of the depth to water at the well in January along with the 12-month December Standardized Precipitation Index (SPI) for the south-central climatic division of Kansas and the annual reported water use for the water right of the well. The groundwater level fluctuated about 6 ft above and below a depth to water of 44 ft from 1982 to 2004, usually in response to wet or dry conditions as indicated by the SPI, although the overall decline from January 1982 to January 1986 was probably also related to the larger water use than during the period after 1989. After the early 2000s, the water level generally declined; the small water-level rises in January 2008 and 2009 were not as great as expected for the wet conditions during 2007 and 2008 and similar water use as in the previous several years. The water-level drop was substantial during the drought of 2011 and 2012, and the water level did not recover during the somewhat wet to normal precipitation conditions of 2012 through 2015 as it did during the somewhat wet period of 1992 and 1993 (although the relatively lower water use probably contributed to the 1992 and 1993 recoveries). The decline in the water level is important to this investigation because it increases the piezometric head difference between groundwater in the underlying Dakota Formation and the alluvial aquifer.
Figure 3—Hydrograph and annual reported water use for the irrigation well and the 12-month December Standardized Precipitation Index (SPI) for the south-central climatic division of Kansas. The water-level values are for the date of measurement, and the SPI and water use values are plotted for January 1 of the year following the year of the values, such that they represent the climatic conditions and pumping during the year preceding the water-level measurement (for example, the SPI and water use values plotted as 2000 on the figure represent the climatic conditions and pumping during 1999).
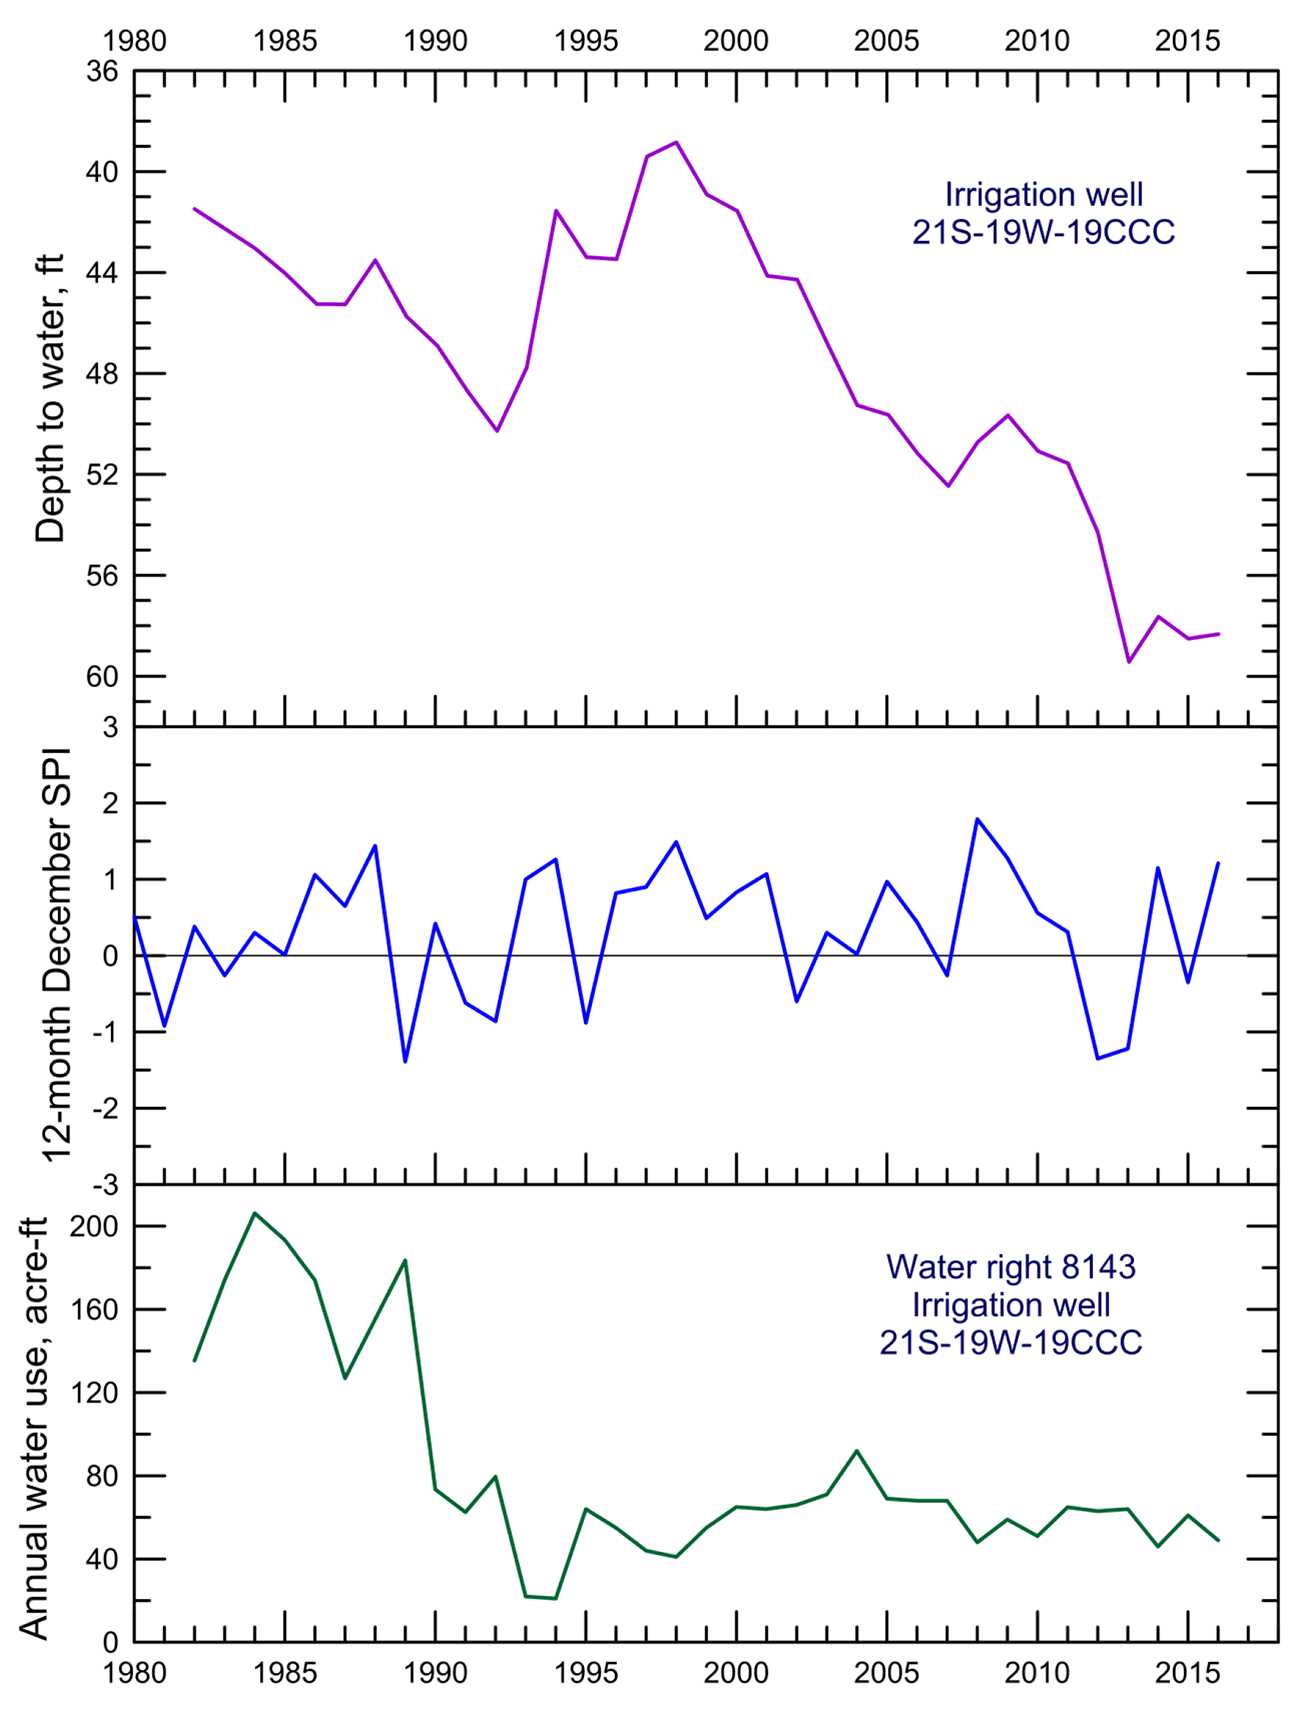
Figure 4 illustrates a generalization of groundwater flow in a cross section that includes an unconfined and multiple confined aquifers. Water typically flows from upland areas of recharge through the unconfined and confined units and discharges to the stream. The important point is that the flow toward the stream from the confined units includes an upward component, causing the piezometric head in the confined unit to be greater than that in the unconfined aquifer next to the stream. Figure 5 is a portion of a plate in McLaughlin (1949) that shows geologic cross sections through western and central Pawnee County. The north-south cross section passing through the middle of fig. 5 passes approximately 2 miles to the east of the irrigation well. Groundwater flow in the strata of the Dakota aquifer system includes a regional component from west to east following the regional topographic elevation gradient; another more local flow component is from the upland areas to the north or south toward the Pawnee River valley into the alluvial aquifer and from the alluvial aquifer into the river (when the groundwater level in the alluvium next to the river is above the river level). Pumping from the alluvial aquifer has lowered groundwater levels below the river level, resulting in no groundwater discharge and a dry streambed during dry periods most of the time in the area. However, the upward component of flow from the underlying Dakota aquifer system to the base of the alluvial aquifer continues.
Figure 4—Cross section illustrating flow from upland areas down through confining beds to finally discharge in stream valleys (from USGS, Groundwater discharge—The water cycle, http://water.usgs.gov/edu/watercyclegwdischarge.html).
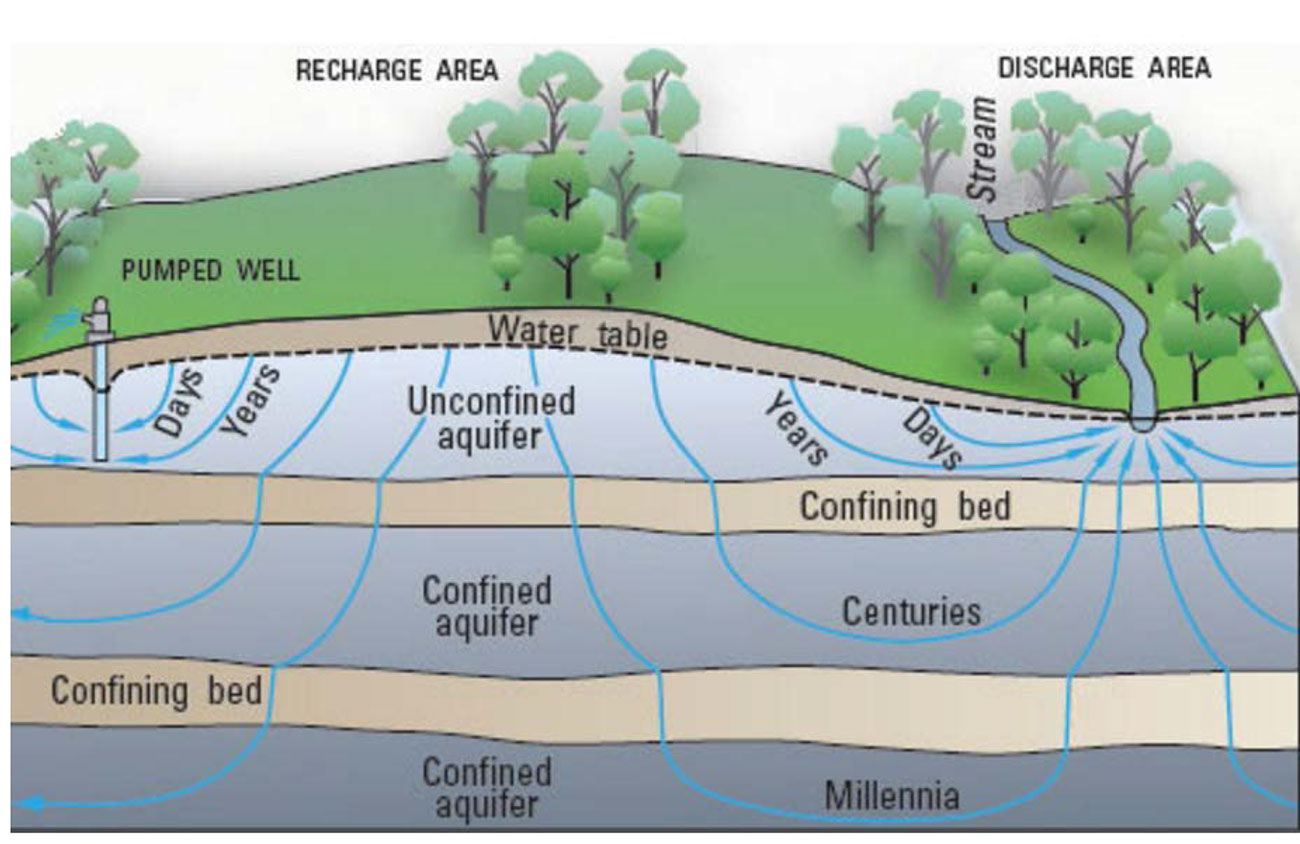
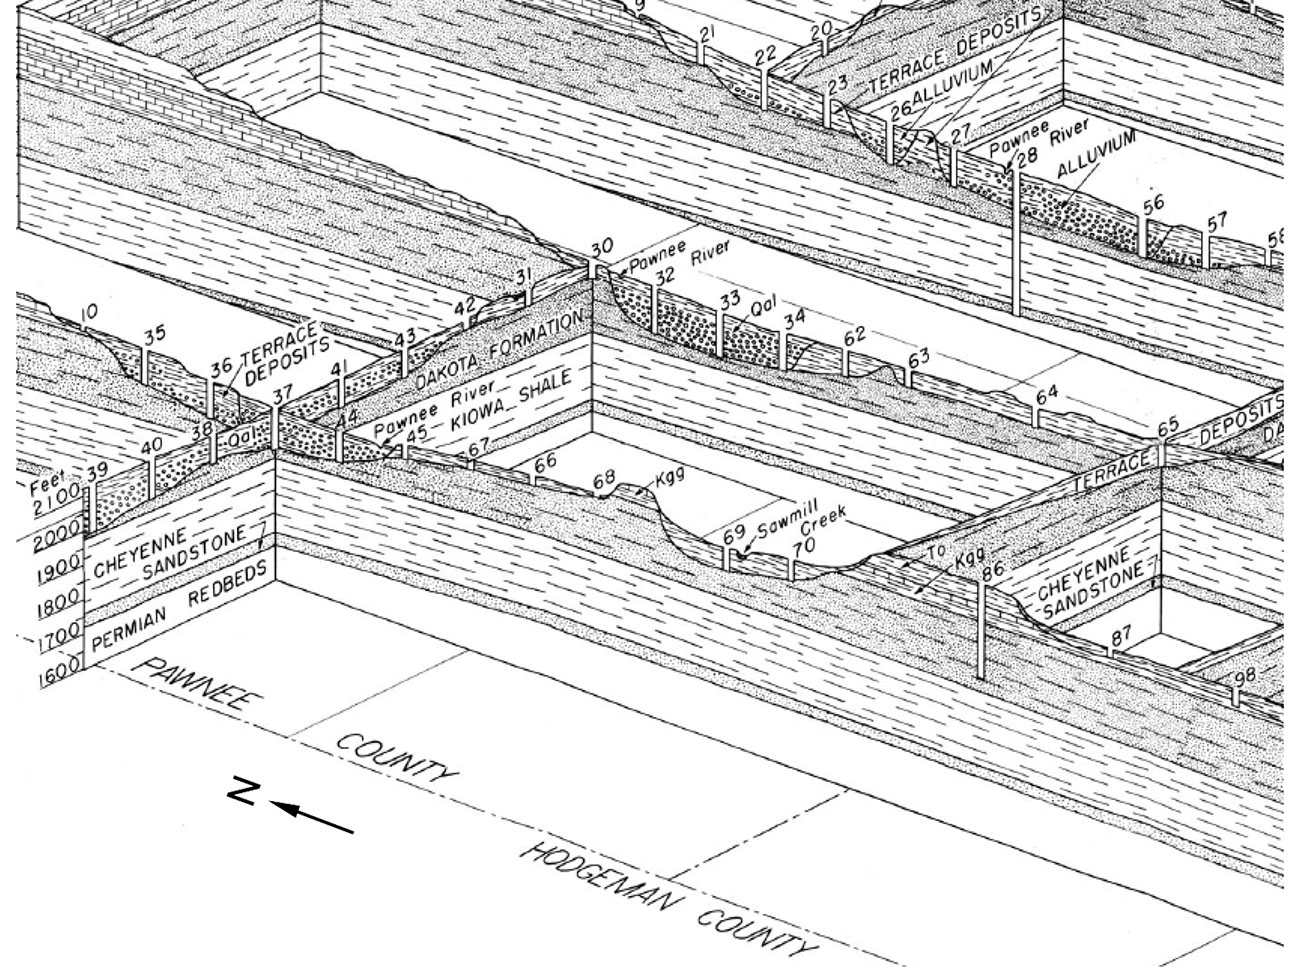
Figure 5—Geologic cross sections in western and central Pawnee County. The figure is part of Plate 3 in McLaughlin (1949). The north-south cross section passing through the middle of the figure (with well logs numbered 32-34 in Pawnee River alluvium) passes approximately 2 miles to the east of the irrigation well. The west-east cross section in the middle of the figure (including well logs 30 and 31) passes approximately 1 mile to the north of the irrigation well.
The upward flow component from the deeper strata in the Dakota aquifer system (Cheyenne Sandstone) brings saline water into the Dakota Formation below the deeper portions of the alluvial aquifer. The Dakota Formation is primarily shale. The shale units act as confining units for the more permeable sandstone units within the formation, thereby slowing the flow of saline water into the overlying alluvial aquifer. The groundwater flow in the alluvial aquifer (both in response to the regional west to east topographic gradient and to the river channel when the water level is high enough) is much faster than that in the underlying Dakota strata. Thus, the small amount of saline water naturally intruding into the bottom of the deeper alluvial aquifer is usually diluted enough that it does not substantially affect the quality of the alluvial groundwater. However, if the vertical potentiometric gradient from Dakota strata to the overlying alluvium is increased by a substantial decline in water level in the alluvial aquifer, the amount of saline water intruding into the base of the alluvial aquifer might increase enough to appreciably affect the salinity of the water pumped by a well screened to the base of the alluvial aquifer. During the pumping of the well, the water levels would be even lower, which would further increase the potential intrusion of saline water into the alluvial aquifer at the well.
A remote possibility for the flow of saltwater from the Dakota aquifer system, or even the underlying Permian strata, into the base of the alluvial aquifer at the irrigation site is an avenue through a poorly plugged or cased oil or gas borehole or a core hole used to determine the underlying geologic structure for oil and gas exploration (core holes have been drilled in the past in south-central Kansas down to the Stone Corral Formation at the top of the Permian Sumner Group). It would be difficult to determine whether either of these avenues existed. The KCC did report that a gas well about 1,000 ft to the north of the irrigation well, which was plugged in March 2016, had about 900 ft of surface casing and no issues with the plug.
Another possibility is related to the tenant farmer's comment that he thought the well was deepened about 15 years ago. This would fit with his indicating to the KCC that he thought that the well was 165 ft deep. If the well had indeed been deepened but not completed to that depth, and the interval in the borehole below the alluvial aquifer had not been completely sealed, then upward movement of saline water from the Dakota aquifer would be expected to be faster than without this possible avenue. However, no verified evidence of well deepening was found at this time.
The source of salinity in the samples from the irrigation well is probably the upward flow of saline water from the Dakota Formation underlying the Pawnee River alluvial aquifer into the base of the aquifer within the ancient bedrock channel. Groundwater-level declines in the alluvial aquifer during the last 15 years, including the additional decline during pumping of the irrigation well in the irrigation season, would increase the piezometric head difference between the underlying confined saline water and the bottom of the bedrock channel, thereby potentially increasing the rate of flow of saline water from the Dakota strata into the base of the alluvial aquifer. If the communication that the well had been deepened in the past into the Dakota Formation to a depth of 165 ft, and the portion of the borehole into the Dakota had not been subsequently adequately sealed, this could substantially increase the flow of saline Dakota water to the base of the alluvial aquifer at the well. Upward flow from a nearby poorly plugged or cased oil or gas borehole or a core hole used to determine the underlying geologic structure for oil and gas exploration should also be considered as a secondary, although more remote, possibility.
The entrance of saline water identified as geochemically similar to that in the underlying Dakota aquifer is an important discovery and portent for future water quality in the alluvial aquifer at the base of the bedrock channel of the Pawnee River. The results warrant additional observations of water quality at the well and others screened to the base of the bedrock channel, as well as a recommendation that drilling into the Dakota aquifer below the deeper parts of the Pawnee River alluvial aquifer for future water supplies should be avoided.
Kenny Sullivan of Conservation District No. 1, Kansas Corporation Commission, investigated the saline water issue, supplied information about the well, and sent the water samples to the KGS. Brock Norwood at the KGS analyzed the water samples.
Macfarlane, P.A., Combes, J., Turbek, S., and Kirshen, D., 1993, Shallow subsurface bedrock geology and hydrostratigraphy of southwestern Kansas: Kansas Geological Survey, Open-file Report no. 93-1a, 13 pages, 18 sheets [available online]
McLaughlin, T.G., 1949, Geology and ground-water resources of Pawnee and Edwards counties, Kansas: Kansas Geological Survey, Bulletin 80, 189 p, 3 plates [available online]
Whittemore, D.O., 1984a, Geochemical identification of salinity sources; in, Salinity in Watercourses and Reservoirs (Proceedings of the International Conference on State-of-the-Art Control of Salinity), R.H. French, ed.: Ann Arbor Science, Butterworth Publishers, Stoneham, MA, p. 505-514.
Whittemore, D.O., 1988, Bromide as a tracer in ground-water studies: Geochemistry and analytical determination: Proceedings Ground Water Geochemistry Conference, National Water Well Association, Dublin, OH, p. 339-360.
Whittemore, D.O., 1995, Geochemical differentiation of oil and gas brine from other saltwater sources contaminating water resources: Case studies from Kansas and Oklahoma: Environmental Geosciences 2, 15-31.
Whittemore, D.O., Macfarlane, P.A., and Wilson, B.B., 2014, Water resources of the Dakota aquifer in Kansas: Kansas Geological Survey, Bulletin 260, 60 p. [available online]
Kansas Geological Survey, Geohydrology
Placed online July 17, 2017
Comments to webadmin@kgs.ku.edu
The URL for this page is http://www.kgs.ku.edu/Hydro/Publications/2017/OFR17_30/index.html