![]()
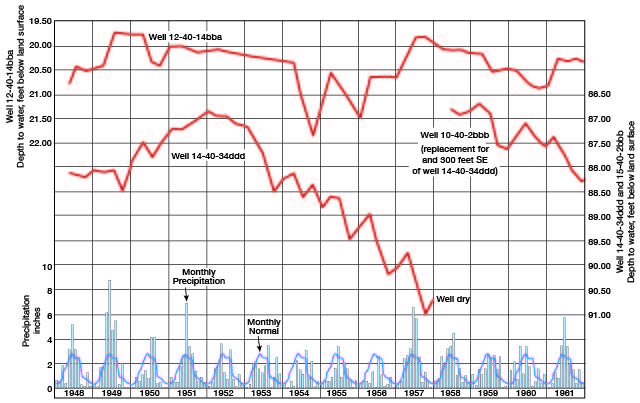
Figure 9
Figure 9--Hydrographs showing fluctuations of water levels in the Ogallala Formation, and graphs showing monthly and normal precipitation at Sharon Springs.
Kansas Geological Survey, Geology
Placed on web July 9, 2007; originally published November 1963.
Comments to webadmin@kgs.ku.edu
The URL for this page is http://www.kgs.ku.edu/General/Geology/Wallace/fig9.html