![]()
Prev Page--Geology || Next Page--Hydrologic Properties
Ground Water
Principles of Occurrence
The fundamental principles governing the occurrence and movement of ground water were described by Meinzer (1923) and were summarized as they apply to Kansas by Moore (Moore and others, 1940). These principles will be discussed here briefly; for a more detailed discussion the reader is referred to the above-mentioned reports.
The rocks and surficial deposits that form the outer crust of the earth are not solid throughout, but contain many open spaces. These spaces range in size from minute openings between particles of silt or clay to larger openings between grains or pebbles in sandstone, sand, or gravel, to open joints and crevices formed by fractures and solution in consolidated rocks. A unit in which the openings are interconnected and large enough to allow water to move to a well is called an aquifer. Figure 6 shows several common types of rock interstices and the relation of texture to porosity.
Figure 6--Diagram showing several types of rock interstices and the relation of rock texture to porosity. (From Meinzer, 1923a.) A, Well-sorted sedimentary deposit having high porosity; B, poorly sorted sedimentary deposit having low porosity; C, well-sorted sedimentary deposit consisting of pebbles that are themselves porous, so that the deposit as a whole has a very high porosity; D, well-sorted sedimentary deposit whose porosity has been diminished by the deposition of mineral matter in the interstices; E, rock rendered porous by solution; F, rock rendered porous by fracturing.
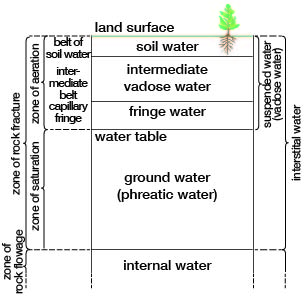
Figure 7 is a diagram of the hydrologic cycle, adapted from A. M. Piper (1953), and shows the part of ground water in the circulation of water near the surface of the earth. In Wallace County ground water is derived almost entirely from precipitation. Part of the water that falls as precipitation becomes surface runoff, part of it evaporates into the atmosphere, and part of it is absorbed by plants and later transpired into the atmosphere. The rest, a very small part, percolates downward through the soil and underlying strata until it reaches the water table, where it becomes ground water. Figure 8 shows the generalized divisions of subsurface water.
Figure 7--Diagram of the hydrologic cycle. Solid flow lines indicate movement of water as a liquid and broken lines movement as vapor. Heavy flow lines indicate man's principal interruption of the natural cycle (after Piper, 1953).
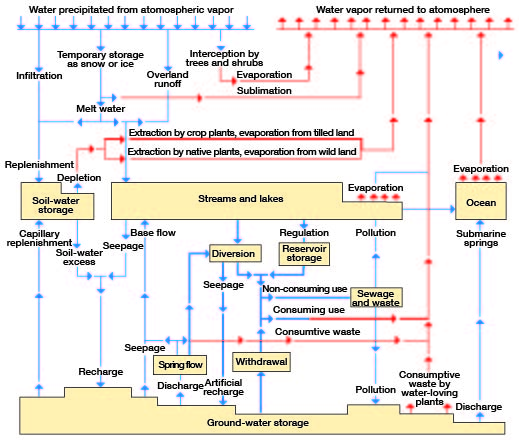
Figure 8--Diagram showing generalized divisions of subsurface water. (After Meinzer, 1923a, fig. 2)
Where a water-bearing unit is confined between relatively impermeable beds and water is supplied to it from an adjacent area of higher altitude, the water table is absent and the water is said to be confined or under artesian pressure. When an aquifer under artesian pressure is penetrated by a well, water will rise in the well until pressure of the column of water is equal to the hydraulic head. The imaginary surface connecting this level in wells is called the piezometric surface, which may or may not be above the land surface.
The Water Table and Movement of Ground Water
The water table may be defined as the upper surface of that part of the zone of saturation where water is free to move by gravity. The water table is not a static, level surface, but is a sloping surface having irregularities in the form of mounds, depressions, and ridges related to the topography, geology, and hydrology of the area. The configuration of the water table in Wallace County is shown on Plate 1 by means of contour lines. The direction of ground-water movement is at right angles to the contours and in a down-slope direction. In most of the county the movement is easterly. Because of frictional resistance of the small interstices through which the water must pass, this movement is very slow. The slope of the water table varies inversely with the permeability of the aquifer, the water-table contours being spaced farther apart in areas where the water-bearing beds are more permeable. The movement of ground water where aquifer tests were made in Wallace County is calculated elsewhere in this report, in the discussion of hydrologic properties of water-bearing materials.
Ground water that accumulates from recharge of the aquifer by precipitation moves eastward at a slope of approximately 11 feet per mile (Pl. 1), or at a hydraulic gradient of 0.002. The amount of ground water moving through that part of the aquifer shown on the southern part of the geologic cross section B-B' (Pl. 2) is estimated by assuming a coefficient of permeability of 1,000 gpd per square foot (determined from aquifer tests in this general area). The total area of saturated material in the cross section is about 7,200,000 square feet. The quantity of ground water moving through a given cross-sectional area of water-bearing material can be calculated from the following formula:
Q = PIA
where Q = the quantity of water,
P = the coefficient of permeability,
I = the hydraulic gradient, and
A = the area.
Thus, the ground-water movement through the cross section is:
(1,000) (0.002) (7,200,000) = 14,400,000 gpd, or 16,000 acre-feet per year.
(One acre-foot equals 325,850 gallons.)
Fluctuations of the Water Table
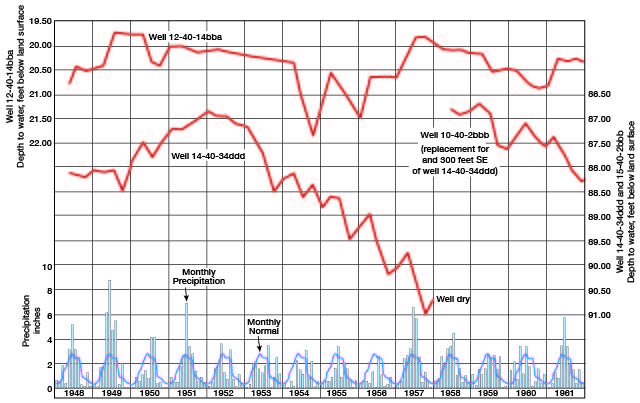
The water table is not a stationary surface but one that fluctuates up and down in response to additions to or withdrawals from the aquifer. Hydrographs showing fluctuations of the water levels in two wells in Wallace County and the monthly precipitation at Sharon Springs are shown in Figure 9. Water levels in a number of irrigation wells in the southeastern part of the county were several feet lower in the fall of 1957, after many of the wells had been pumped during much of the summer and fall, than water levels in the same wells in the summer of 1958, when considerably less water had been pumped for irrigation because of ample rainfall.
Figure 9--Hydrographs showing fluctuations of water levels in the Ogallala Formation, and graphs showing monthly and normal precipitation at Sharon Springs. A larger version of this figure is available.
Ground-water Recharge
Ground water in Wallace County, as in other parts of the Great Plains, is derived almost entirely from local precipitation in the form of rain or snow. One inch of water falling on 1 square mile amounts to more than 17 million gallons. The mean annual precipitation of 17.03 inches amounts to nearly 300 million gallons per square mile and a total of more than 800 thousand acre-feet over the entire county. Only a small part of the annual precipitation, however, reaches the ground-water reservoir. As has been mentioned above, a very small part of the water that falls as precipitation in Wallace County is carried away as surface runoff by streams; part is evaporated into the atmosphere; part is absorbed by vegetation and later transpired into the atmosphere. The small amount of water that is not discharged by these processes percolates downward to the zone of saturation. After the water reaches the water table, it moves down gradient slowly toward points of discharge such as wells, springs, and streams, or to points of evaporation and transpiration.
More than 60 percent of the mean annual precipitation in Wallace County falls during the 4 months of May through August when the climate is characterized by brisk wind movement, high temperatures, and relatively low humidity. Consequently, evaporation is rapid, and much of the annual precipitation returns to the atmosphere. Moreover, because much of the rainfall occurs during the growing season, a large part of the precipitation is returned to the atmosphere through transpiration by plants.
Recharge, the addition of water to the ground-water reservoir, may occur in several ways. The original source of all recharge is precipitation; however, in addition to direct infiltration of precipitation, a ground-water reservoir may be recharged locally by the seepage of water from streams, by subsurface inflow of water from adjacent areas, and by the infiltration of irrigation water applied on the land surface.
Infiltration of Precipitation
The topography, type of soil, and nature of subsoil greatly affect the amount of water that will infiltrate below the land surface. A good vegetative cover will retard runoff and allow water to seep into the soil. Most of the southern part of Wallace County is much more conducive to infiltration of rainfall than is the northern part, and the relative lack of surface streams in the southern part of the county in contrast to the predominance of streams in the northern part attests to this difference between the two areas.
The rate of ground-water recharge in Wallace County is not known, but studies of recharge in other, similar areas in the High Plains indicate a recharge of about one-fourth inch per year. If the figure of one-fourth inch per year is applied to the area in Wallace County underlain by the Ogallala Formation, the annual addition to the ground-water reservoir from precipitation would be about 10,000 acre-feet.
Influent Seepage from Streams
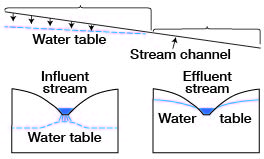
Most streams in Wallace County are influent streams--that is, they have not cut their channels below the water table and thus add water to rather than receive water from the zone of saturation. Figure 10 illustrates influent and effluent streams. North Fork Ladder Creek, in the southern part of the county, probably contributes considerably more water to the groundwater reservoir than other streams in the county because of the sandy nature of the channel, its meandering course, and the permeable beds underlying the stream. Recharge from streams in the northern part of the county would tend to be minor because of the nearness of shale to the land surface in much of the area.
Figure 10--Diagrammatic sections showing influent and effluent streams. Longitudinal section showing (right) how an effluent stream gains water and (left) how and influent stream loses water. Transverse section across influent part of a stream (lower left). Transverse section across effluent part of a stream (lower right). (After Meinzer, 1923a, fig. 26.)
Subsurface Inflow
Subsurface inflow to an area results from the down-gradient movement of ground water from adjacent areas toward areas of discharge. Ground water moves into Wallace County along the western edge of the county. The quantity of subsurface inflow to the county is not known but is estimated to be approximately 100 acre-feet per day.
Infiltration of Irrigation Water
Recharge from the return of water applied to the land for irrigation has been estimated to approach 25 percent of the applied water in certain irrigated areas. In these areas, the irrigated water is distributed in relatively long ditches over soils and subsoils that are very permeable. The upland plain in Wallace County is thickly mantled by loess and has a relatively dense soil, and recharge probably does not average more than 10 percent of the applied water. On the irrigated land in the alluvial valleys, where the soils are more sandy, the percentage of applied water that recharges the aquifer is probably somewhat greater. However, the areal extent of the alluvial valleys is relatively small in Wallace County.
Ground-water Discharge
Ground-water discharge is the release of water from the zone of saturation. In Wallace County ground water is discharged by effluent seepage into streams, by springs, by transpiration and evaporation, by pumping from wells, and by subsurface outflow.
Springs and Seeps
Streamflow is maintained at low stages in Rose Creek, Eagle Tail Creek, and Willow Creek by ground-water discharge from the Ogallala Formation. Ground water is discharged into these streams mainly by seeps along stream channels, but there are many small springs along the valley walls where the stream channel intercepts the water table, and also at the contact of the Ogallala Formation and the underlying impermeable Pierre Shale. Many of the springs and seeps continue to discharge ground water during periods of drought, and the shallow ground water along the streams supports a heavy, growth of vegetation. The amount of discharge of ground water by springs and seeps in Wallace County is not known but is believed to be considerable.
Transpiration and Evaporation
During the growing season, plants transpire a considerable amount of ground water in the major stream valleys in the area. The lowering of the water table by transpiration greatly reduces the ground-water discharge into streams, notably Rose Creek, Eagle Tail Creek, and Willow Creek, and in these streams the flow during the growing season is largely runoff from storms. The base flow increases markedly during the fall and winter when transpiration ceases. Transpiration does not occur from the water table underlying the upland areas of the county because of the greater depth of the water table. Soil moisture lost by transpiration on the uplands, however, must be replaced before any water can infiltrate downward to the water table.
Where the water table is within a few feet of the land surface, ground water may evaporate from the capillary fringe overlying the zone of saturation, or, if the water table is within a few inches of the land surface, water may evaporate directly from the zone of saturation, The evaporation of water from the ground-water reservoir is restricted to the alluvial valleys, and the amount is probably small compared to other ground-water discharge.
Wells
The effect of the pumping of wells upon an aquifer depends upon the extent and permeability of the aquifer as well as upon the quantity of water pumped. Withdrawal of ground water from wells in Wallace County is increasing. In 1960 there were 96 irrigation plants in the county using 16,234 acre-feet of water to irrigate 8,192 acres (as reported to the Division of Water Resources of the Kansas State Board of Agriculture). Withdrawal of ground water for domestic and stock supplies is small compared to withdrawal for irrigation. Sharon Springs and Wallace are the only towns in the county that derive municipal supplies from ground water.
Subsurface Outflow
Ground-water contours on Plate 1 show a subsurface outflow of ground water in the southeastern part of the county, where the movement is southeastward. A maximum of about 7,000 acre-feet of ground water per year leaves Wallace County by subsurface outflow. The amount of outflow in the alluvial valleys is considered negligible because of their relatively small areal extent.
Recovery of Ground Water
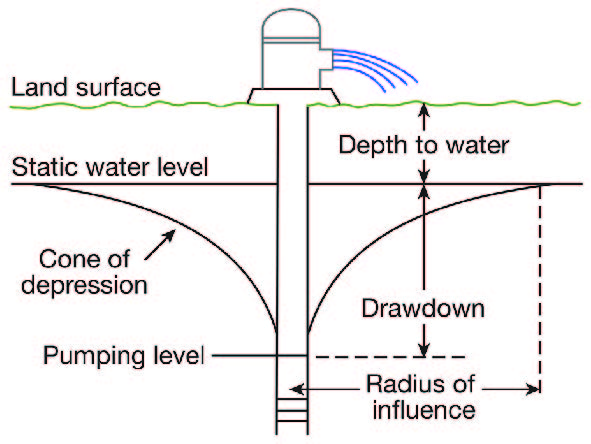
When water is pumped from a well, the water level becomes lower inside the well than outside, and water therefore moves toward the well. The water table or piezometric surface in the surrounding part of the aquifer is lowered, and a depression in the form of an inverted cone develops in the water table (Fig. 11). The lateral extent of this cone of depression is called the area of influence, and the vertical distance that the water level is lowered is called the drawdown. The size and shape of the cone of depression are determined by the transmissibility of the aquifer, rate of pumping, length of pumping time, and extent to which the well penetrates the aquifer. The cone of depression around a pumped well will increase in depth and area until it intercepts enough recharge or reduces natural discharge sufficient to supply the demand of the well. After pumping stops, the water table or piezometric surface surrounding the well will in time return to its original position.
Figure 11--Diagrammatic section of a well that is being pumped, showing its drawdown, cone of depression, and radius of influence.
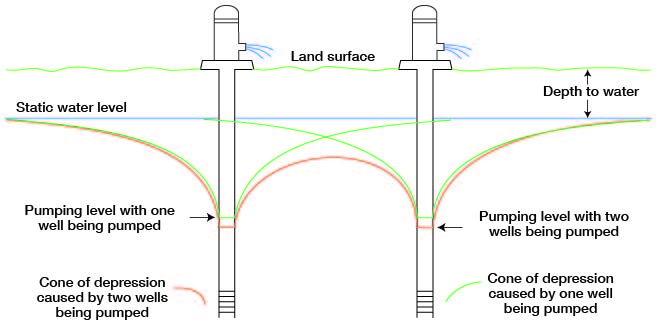
If wells are closely spaced, as in a well field or an intensively irrigated area, the cone of depression developed by each well may overlap those of adjacent wells, causing mutual interference (Fig. 12). When mutual interference occurs, the drawdown at any point within the radius of influence of the wells is the sum of the drawdowns caused by the individual wells at that point. When wells interfere, the pumping lift in each well is increased and the discharge is decreased. Also,, to maintain a constant discharge from a pumped well would increase the drawdown and extend the cone of depression. In areas where many wells .are pumping from the same aquifer, the large cone of depression resulting from mutual interference may not have sufficient time to recover between pumping periods and the water level may decline persistently.
Figure 12--Diagrammatic section of two closely spaced wells being pumped, showing mutual interference between wells and the resulting cones of depression.
Utilization of Ground Water
Data on 294 wells in Wallace County were obtained during the course of this investigation. Only part of the domestic and stock wells were visited, but records were made of all municipal and irrigation wells in the county at the time of this investigation (Table 11). The principal uses of ground water in the county are listed below.
Domestic and Stock Supplies
One of the chief uses of ground water in Wallace County is to supply domestic and stock needs, although the amount so used is small as compared to the amount pumped for irrigation. Nearly all domestic and stock supplies in the rural part of Wallace County are obtained from wells, but in parts of the county where ground water is difficult to obtain, some stock supplies are provided by ponds created by dams across small watercourses. Most domestic and stock wells in the county are drilled wells in which standard-size casing has been set and which are equipped with displacement-type pumps in which the cylinder is below the water level. Most pumps are operated by windmills; others are operated by electric or gasoline motors, or by hand.
Municipal Supplies
At the time of this investigation only the communities of Sharon Springs and Wallace maintained municipal water-supply systems. Pertinent remarks regarding individual wells and details of well construction are given in Table 11.
Sharon Springs--Sharon Springs (population about 1,000) obtains its water supply from three drilled wells in Eagle Tail Creek valley in the southwestern part of town. The wells are equipped with electrically driven turbine pumps. Storage is provided by an elevated 50,000-gallon steel tank. An average daily use of about 100,000 gallons of water was reported by city officials.
Wallace--Wallace (population about 100) obtains its water supply from well 13-39-25daa drilled into alluvium of South Smoky Hill Valley. An electrically driven turbine pumps water directly into the mains, the excess going into an elevated 50,000-gallon steel tank. An average daily use of about 15,000 gallons of water was reported by city officials.
Irrigation Supplies
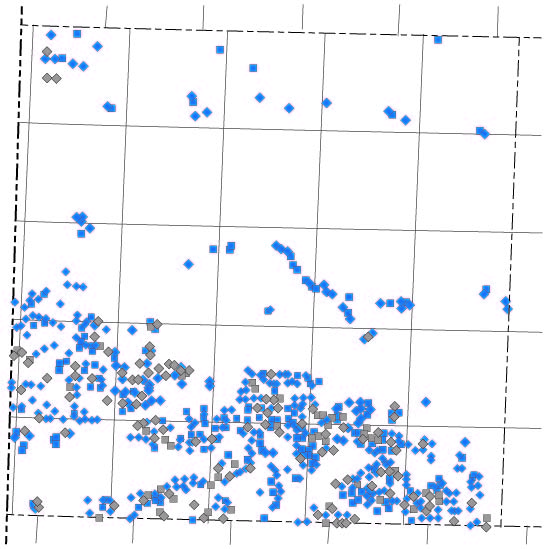
There were 96 irrigation plants in Wallace County in the fall of 1960. Nearly all were single wells, but a few plants in the valleys were pumping from batteries of two or more wells. Most of the irrigation wells are in the southern part of the county, chiefly in the lower two tiers of townships, where approximately 3 million acre-feet of water is in storage in the Ogallala Formation. Yields of irrigation wells range to more than 2,000 gpm. Figure 13 is a map of Wallace County showing the extent of land covered by water rights or applications for rights as of July 1961, according to records of the Division of Water Resources of the Kansas State Board of Agriculture. The acreage affected by these rights and applications totals 20,174 acres, of which 8,192 acres were reported to have been irrigated in 1960 by 45 appropriators. The authorized quantity of ground water appropriated totals 31,658 acre-feet, of which 16,234 acre-feet was reported to have been applied in 1960 by 49 appropriators. The acreages and quantities of water given above do not include data from surface-water irrigators, of whom there are several, mostly along Rose Creek.
Figure 13--Map showing areas in Wallace County covered by water rights to ground water [as of publication date 1963].
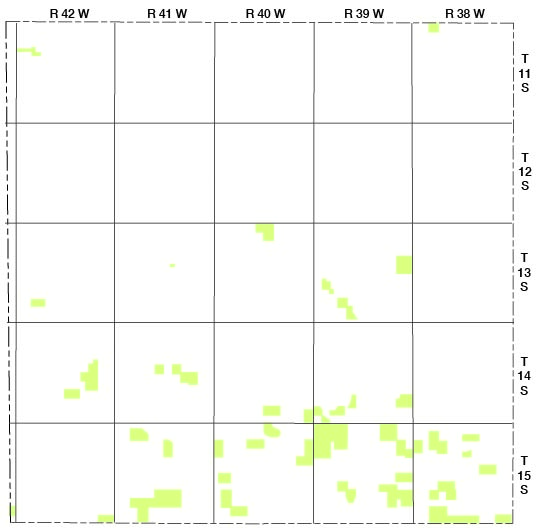
Figure 13 (2007)--Map showing areas in Wallace County covered by irrigation water rights sourced from ground water. Created using the WIMAS system in Summer 2007.
Prev Page--Geology || Next Page--Hydrologic Properties
Kansas Geological Survey, Geology
Placed on web July 9, 2007; originally published November 1963.
Comments to webadmin@kgs.ku.edu
The URL for this page is http://www.kgs.ku.edu/General/Geology/Wallace/05_gw.html