![]()
Prev Page—Ground Water || Next Page—Recharge and Discharge
Ground Water, continued
The Water Table and Movement of Ground Water
The permeable rocks that lie below a certain level in Scott County and elsewhere generally are saturated with water under hydrostatic pressure. These saturated rocks are said to be in the zone of saturation, the upper surface of which is called the water table. The permeable rocks that lie above the water table may be said to be in the zone of aeration (Waite, 1942, p. 53). The water that enters from the surface into the soil is slowly drawn down by gravity through the zone of aeration to the zone of saturation, except that which is retained by molecular attraction. In fine-grained material the earth is nearly saturated for several feet above the water table due to capillarity. This nearly saturated belt is called the capillary fringe. Water in the capillary fringe or in transit in the zone of aeration is not available to wells; hence wells must be sunk to the water table before water enters them.
Shape and Slope
The shape and slope of the water table in Scott County are shown on the map (Pl. 1) by means of contours drawn on the water table. Each contour line has been drawn through points on the water table having approximately the same altitude. Collectively they show the configuration of the upper surface of the ground-water body in much the same manner as contours on topographic maps show the general shape of the land surface. The altitudes of the water surfaces in each of the wells that were used in compiling the map have been referred to sea-level datum. Ground water moves in the direction of maximum slope, which is at right angles to the contours. The position of the contours indicates that the water table in general slopes eastward, but that the amount of slope varies considerably because of irregularities of the water table.SWThe shape of the water table, which in turn determines the rate and direction of movement of ground water, is controlled by several factors. Irregularities in the shape of the water table under Scott County may be caused by (1) the configuration of the underlying Cretaceous floor; (2) discharge of ground water into perennial streams; (3) recharge of the ground-water body by ephemeral streams; (4) local differences in the permeability of the deposits; and (5) local depressions on the water table caused by the pumping of water from wells.
The shape and slope of the water table beneath Scott County conform in general to the eastward-sloping bedrock floor, the average slope being about 10 feet to the mile in the northern half of the county and about 6 feet to the mile in the southern part of the county in the vicinity of Shallow Water. The relation of the water table to the underlying bedrock floor is shown by the cross sections in Figure 5. The water-table contours in Plate 1 show that in general the water table beneath the western half of the county slopes eastward and that in the area of the heaviest pumping, about 7 miles southwest of Scott City, a cone of depression has been established. The area of heavy pumping includes about 8 square miles and is approximately delineated by the closed 2,910-foot contour line. In the northeastern quarter of the county the contours show that the water table slopes northeastward. Near the southeastern corner of the county the contours show that the direction of movement is in a southeast direction. The presence of a bedrock high in this vicinity has undoubtedly been partially, responsible for this change in the direction of movement. It is interesting to note that the configuration of the water table, as shown by the water-table contours on Plate 1, in general is similar to the configuration of the pre-Tertiary surface as shown in Figure 2. The contours on the pre-Tertiary surface indicate the presence of a bedrock high in the southeastern quarter of the county. They show further that in the western half of the county the pre-Tertiary surface slopes rather uniformly eastward, and in the northeastern part of the county the contours show that the pre-Tertiary surface in general slopes northeastward. The contours also reveal the presence of a long, narrow trough running southward near the middle of the county.
In the northern part of the county the plains surface has been dissected by Beaver Creek and several of the smaller northward-flowing tributaries of Smoky Hill River, and in some instances the valleys of these streams have been cut below the water table. Thus, along the lower reaches of Beaver Creek, the water-table contours show that the water table in the vicinity of Beaver Creek valley slopes toward the areas of discharge along the stream. The presence of a long narrow ground-water divide on the east side of Beaver Creek after it turns abruptly northward is indicated by the water-table contours in that vicinity. Streams which gain water from the zone of saturation are said to be effluent streams (Waite, 1942, p. 55).
In the vicinity of the heavily pumped area southwest of Scott City, the water-table contours are not uniformly spaced, suggesting that the configuration of the water table in this part of the county has been rather extensively altered as a result of heavy pumping from irrigation wells in the Scott Basin (Pl. 1). This is indicated by the cone of depression enclosed by the 2,910-foot contour and by the bunching of the contours upgradient from the heavily pumped area--the steeper gradients resulting from the extension of the cone of depression. The effects of pumping are suggested also by the area of relatively flattened gradients just east of the heavily pumped area, which has been caused in part by pumping and in part by heavy recharge in the vicinity of the terminus of Whitewoman Creek.
Streams that flow only after rains are classed as ephemeral or intermittent streams. Their channels are above the water table and are dry much of the time. During periods of stream flow part of the water in an ephemeral stream may seep into the stream bed and descend to the, water table. Streams of this type are called influent streams. The lower part of Whitewoman Creek is influent and the water table near the point where the creek debouches into Scott Basin receives contributions following occasional periods of streamflow. To a lesser degree, Lion Creek and Rocky Draw may be influent near their respective termini. As shown by the dashed 2,915-foot contour (Pl. 1), the water table in the vicinity of the terminus of Whitewoman Creek has been affected by recharge from floodwaters.
Local differences in the permeability of the water-bearing beds affect the shape of the water table. Other things being equal the slope of the water table in any area in general varies inversely with the permeability of the water-bearing material. Thus, the flow of ground water varies from place to place according to the thickness and permeability of the water-bearing material. The permeability of the Ogallala formation is extremely variable as a result of changes in the character of the deposits from one locality to another. The permeability of the Smoky Hill chalk member of the Niobrara formation also is extremely variable as a result of differences in the character of the cracks and crevices that were produced by the adjustment of the brittle chalk following crustal deformation. Prior to the deposition of the Ogallala, the upper surface of the Niobrara formation was subjected to weathering with the result that cracks and crevices along joints and bedding planes were developed extensively. Structural forces originating in the earth's crust produced faulting locally in the Smoky Hill chalk member of the Niobrara. The faulting apparently increases toward the top of the Smoky Hill chalk and it is also greater in certain areas than others. The permeability of the Smoky Hill chalk, therefore, is largely dependent on the presence or absence of cracks and fissures along joints and bedding planes and along fault planes.
The extreme flattening of the water-table gradient in the vicinity of the Scott Basin, as shown by the water-table contours, is due in a large measure to the greater permeability of the thick Pleistocene fill in the deepest part of the structural trough. Because of the absence of cemented beds in this part of the county, the opportunity for the floodwaters of Whitewoman Creek to be absorbed readily by the unconsolidated sediments underlying Scott Basin is also afforded.
Relation to Topography
In Scott County the depth to water level below the land surface is controlled largely by the configuration of the land surface. A map (Pl. 2) has been prepared showing the depths to water level in wells in Scott County by means of isobath lines--lines of equal depths to water level. These lines delimit areas in which the depth to water level lies within specified ranges. As shown on this map, the depth to water level ranges from less than 25 feet to about 160 feet. In general the depth to water level is less than 25 feet in the Scott Basin and in the Dry Lake area in the southeastern part of the county. In a much larger area in the central and southern part of the county the depth to water level is less than 75 feet. The water table lies deepest in the northern third of the county. In most of the principal stream valleys the depth to water level in general is less than 50 feet. The relation between the water table and the land surface is shown in the three geologic sections across Scott County in Figure 5.
For the purposes of discussion Scott County may be divided into several areas based upon the depth to water level: (1) shallow-water areas, (2) deep-water areas, and (3) areas of intermediate depth to water level. The shallow-water areas may be subdivided into the Scott Basin, the Cretaceous area in the vicinity of Dry Lake in the southeastern part of the county, and the shallow-water areas along stream valleys. In general the deep-water areas occur in the northern part of the county and in other parts of the county lying outside of the Scott Basin.
Scott Basin shallow-water area—The Scott Basin is the largest and most important shallow-water area in the county. As shown by the map (Pl. 2) the water table stands less than 75 feet below the land surface in an area covering approximately 200 square miles. The water table stands less than 50 feet below the land surface in an area approximately half this large. In the lowest part of the Scott Basin, about 3 miles south of Scott City, the water table stands less than 25 feet below the land surface in an area covering about 14 square miles. Most of the wells in the Scott Basin obtain water from sands and gravels of Pleistocene and Pliocene age.
Cretaceous shallow-water area in the vicinity of Dry Lake—In an area embracing approximately 10 square miles in the vicinity of Dry Lake near the southeastern corner of the county, the depth to water level is less than 25 feet. The Niobrara formation of Cretaceous age lies at or near the surface in this part of the county, the Ogallala formation either being thin or locally absent. The shallow depth to water level in this part of the county is due in part to the shallow depth of the Niobrara formation which supplies water to many of the wells and in part to the relatively low altitude of the land surface in this area, the Dry Lake depression being the lowest point in the county.
Shallow-water areas along stream valleys—Small shallow-water areas occur in the narrow valleys of the principal streams in the county, notably along parts of Whitewoman Creek and along Beaver Creek. Most of the wells along Whitewoman Creek obtain water from the sands and gravels of Pleistocene and Pliocene age, since the alluvium in Whitewoman Valley is limited to a shallow deposit of sand and gravel comprising the actual stream bed. Most of the wells located on the floodplain of Beaver Creek obtain water from the alluvium, but some of the wells located along the valley sides obtain water from the Ogallala formation. Springs occur in some of the valleys that have been cut below the water table, principally in the northern part of the county. The springs issue from the basal part of the Ogallala formation near the contact with the underlying Niobrara formation.
Deep-water areas—The deep-water areas in general are located outside the Scott Basin and are most extensive in the northern third of the county (Pl. 2). The depth to water level in most of the areas is more than 100 feet and in the northern part of the county the depth to water level is locally more than 150 feet. The deepest water level (well 10) observed in the county is located about 12 miles north and 2 miles east of Scott City. With the exception of several deep-water areas in the southeastern quarter of the county, practically all the wells in the deep-water areas in Scott County obtain water from the Ogallala formation. In some parts of the southeastern quarter of the county the Ogallala formation is thin or entirely absent and some of the wells have been drilled into the underlying Niobrara formation of Cretaceous age to obtain water supplies.
Areas of intermediate depth to water level—The areas of intermediate depth to water level in general are confined to narrow belts along the valley sides of streams where the depth to water level ranges from 50 to 100 feet (Pl. 2). Most of the wells obtain water from the Ogallala formation. In the southeastern quarter of the county, the Ogallala formation is thin or absent and some of the wells obtain water from the Niobrara formation.
Fluctuations in Water Level
The water table in Scott County is not a stationary surface, but a surface that fluctuates up and down much like the water level in a lake or reservoir. In general, the water table rises when the amount of recharge exceeds the amount of discharge and declines when the discharge is greater than the recharge. Thus changes in the water levels in wells indicate to what extent the ground-water reservoir is being depleted or replenished.
The principal factors controlling the rise of the water table in Scott County are the amount of rainfall penetration, the amount of water added to the underground reservoir by influent streams, and the amount of water entering the county beneath the surface from areas to the west. The principal factors controlling the decline of the water table are the amount of water pumped from wells, the amount of water lost through transpiration and evaporation where the water table is shallow as in the Scott Basin and in stream valleys, the amount of water lost through natural discharge areas along streams, and the amount of water leaving the county beneath the surface toward the east. In the Scott Basin the water table fluctuates in response to the heavy draft made upon the ground-water reservoir by pumping from irrigation wells and to changes in storage as a result of seepage of floodwaters at the terminus of Whitewoman Creek. The factors causing the water table to rise are discussed in detail under ground-water recharge and the factors causing the water table to decline are discussed under ground-water discharge.
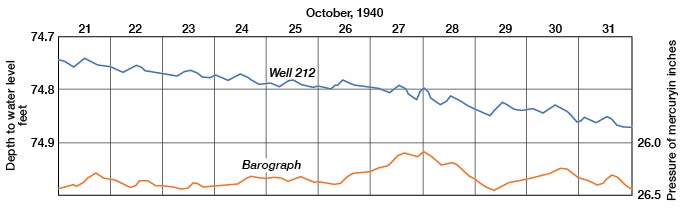
The water levels in wells that penetrate water-bearing formations having a relatively impervious confining bed above the zone of saturation may fluctuate in response to changes in atmospheric pressure. The pressure on the water surface in a well increases with an increase of atmospheric pressure. If this increase in pressure is not transmitted uniformly to the entire ground-water body but acts only on the exposed water surface in the well, the water level in the well fluctuates according to the changes in pressure. If the pressure is transmitted freely through the pore spaces of the soil above the zone of saturation to the ground water, however, there is no barometric fluctuation of the water level. A hydrograph of well 212, obtained from an automatic water-stage recorder and an inverted barograph obtained from a recording micro-barograph, are shown in Figure 8. The barograph is inverted because an increase in atmospheric pressure causes the water levels in wells to decline.
Figure 8—Changes of water level in well 212 caused by changes of atmospheric pressure.
In the fall of 1939, 29 wells at strategic points in Scott County were selected, and periodic measurements of water level in them were begun in order to obtain information concerning the fluctuation in storage of the underground reservoir. Two of these wells (196 and 212) were equipped with Stevens 8-day automatic water-stage recorders. Continuous automatic water-stage recorders have been maintained also on two wells (130 and 248) for several years by the Division of Water Resources of the Kansas State Board of Agriculture (Pl. 8B). In 1940 monthly observations were discontinued in wells 93 and 158 and measurements were begun in wells 228 and 157. In the spring of 1940 an irrigation well (249) was drilled 278 feet south of observation well 248. Because the pumping of this nearby irrigation well lowered the water level in the observation well (248), a new observation well (245) was constructed in August 1940 by the Division of Water Resources 1 mile east and 0.3 mile north of well 248, at a safer distance from local pumping influence (Pl. 9B). Complete water-level records of these wells (130, 131, 245, and 248) have been made available by George S. Knapp, Chief Engineer. The description of the wells and the water-level measurements in 1939, 1940, 1941, 1942, and 1943 are given in the annual water-level reports of the Federal Geological Survey for 1939, 1940, 1941, 1942, and 1943 (Meinzer and Wenzel, 1940, pp. 184-198; 1942, pp. 152-163; 1943, pp. 132-139; and 1944, pp. 153-158). The following table correlates the observation-well numbers used in this report with those given in Water-Supply Papers 886, 908, 938, 946, and 988. The location and description of each well appears in the table of well records at the end of this report.
Plate 8B—Automatic water-stage recorder installed on well 130. Owned and maintained by the Division of Water Resources, Kansas State Board of Agriculture.
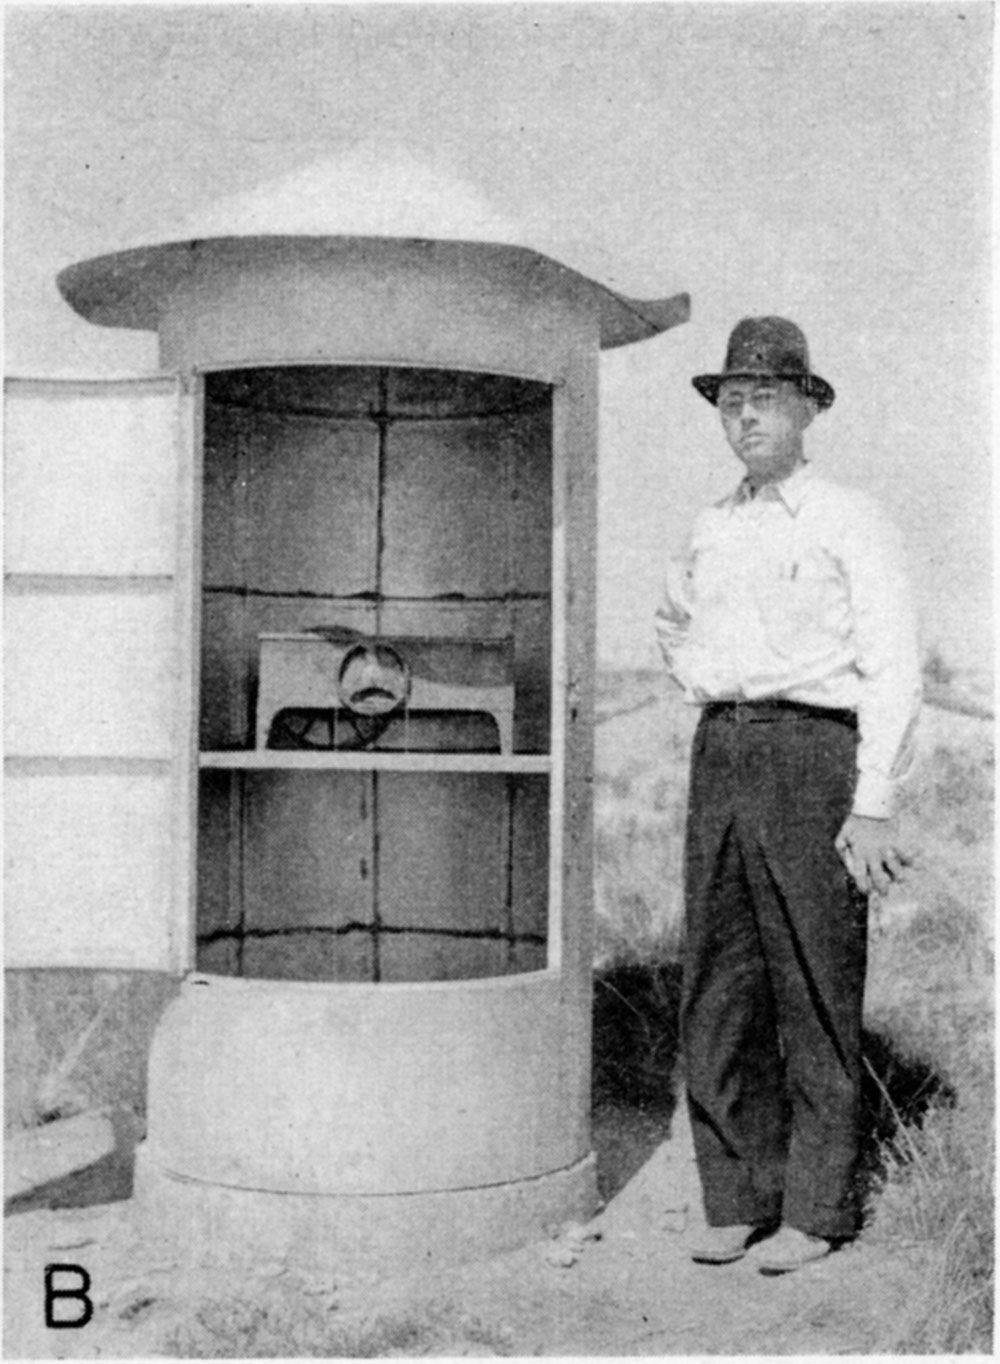
Plate 9B—Automatic water-stage recorder installed on well 245. Owned and maintained by the Division of Water Resources, Kansas State Board of Agriculture.
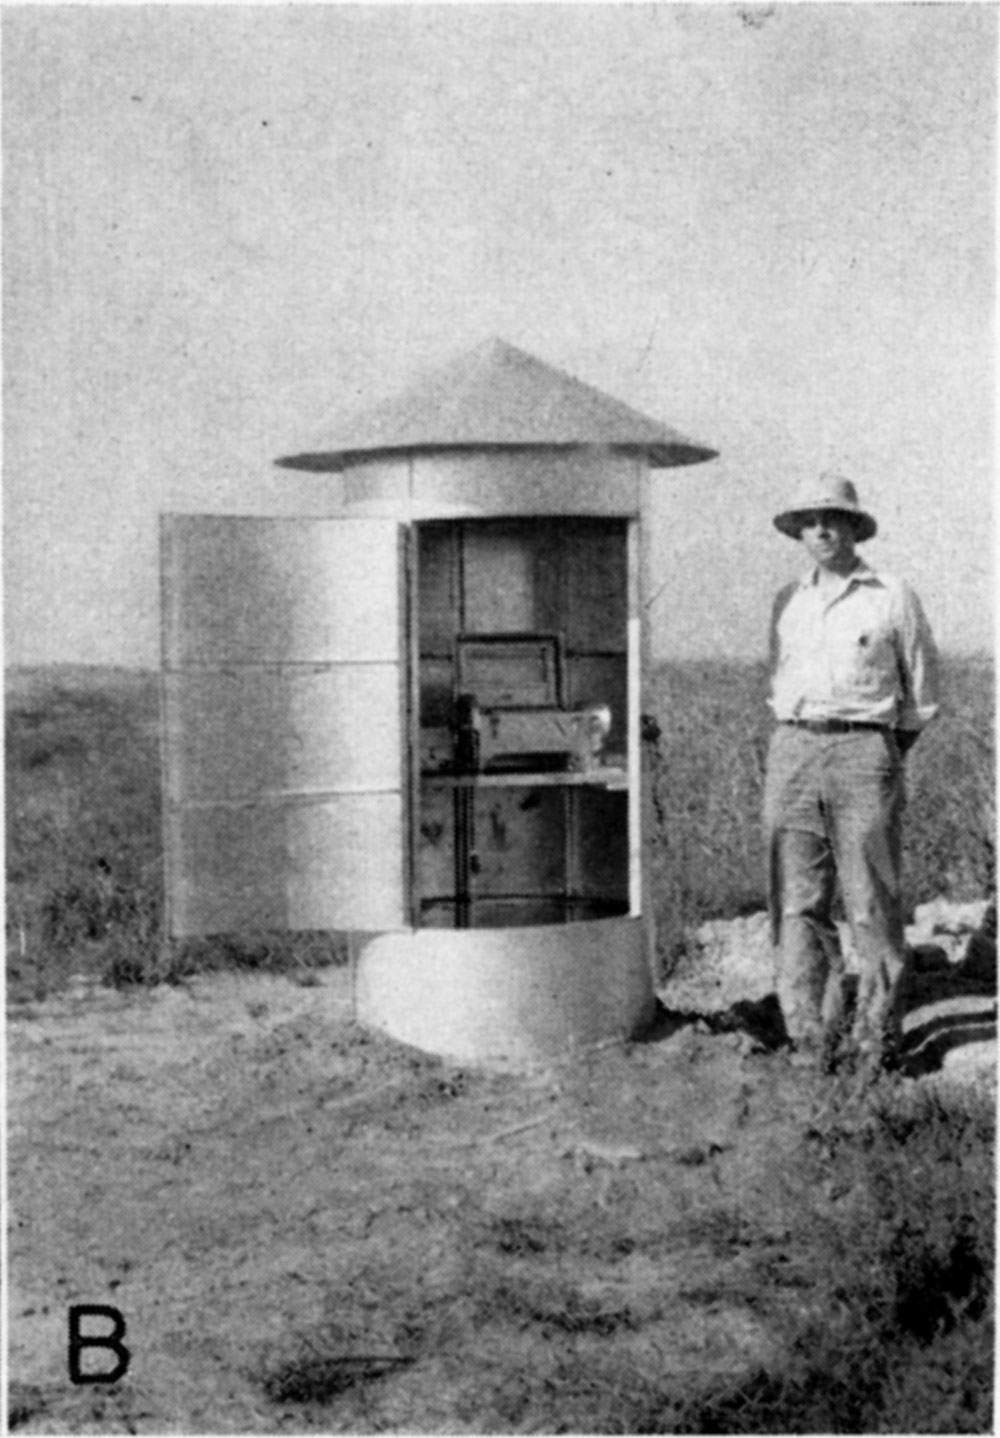
Table 7—Observation-well numbers used in this report and corresponding numbers given in Water-Supply Papers 886, 908, 938, 946, and 988.
| Well no. in this report |
Well no. in Water-Supply Papers |
Well no. in this report |
Well no. in Water-Supply Papers |
|
|---|---|---|---|---|
| 24 | 36 | 158 | 45 | |
| 27 | 35 | 162 | 50 | |
| 34 | 40 | 163 | 17 | |
| 42 | 41 | 195 | 5 | |
| 50 | 37 | 196 | b 32 | |
| 51 | 38 | 198 | 42 | |
| 69 | 39 | 207 | 6 | |
| 90 | 47 | 212 | b 33 | |
| 93 | 24 | 217 | 8 | |
| 107 | 19 | 218 | 9 | |
| 118 | 27 | 228 | 54 | |
| 123 | 3 | 232 | 49 | |
| 128 | 23 | 244 | 13 | |
| 130 | a 2 | 245 | a 1 A | |
| 145 | 34 | 248 | a 1 | |
| 149 | 4 | 267 | 48 | |
| 157 | 55 | 270 | 44 |
a. Equipped with a continuous automatic water-stage recorder and maintained by the Division of Water Resources of the Kansas State Board of Agriculture.
b. Equipped with automatic water-stage recorder during the period from September 1939-July 1941
Prev Page—Ground Water || Next Page—Recharge and Discharge
Kansas Geological Survey, Geology
Comments to webadmin@kgs.ku.edu
Web version March 2003. Original publication date July 1947.
URL=http://www.kgs.ku.edu/General/Geology/Scott/05_gw2.html