![]()
Prev Page—General Geology || Next Page—Utilization, Quality
Ground Water
Principles of Occurrence
The fundamental principles of the occurrence and movement of ground water have been given by Meinzer (1923), and a general discussion of the occurrence of ground water with special reference to Kansas has been given by Moore (1940). The reader is referred to these publications for a more detailed discussion of the occurrence of ground water.
The rocks that make up the outer crust of the earth generally are not solid but have numerous openings, called voids or interstices. The number, size, and shape of these openings depend upon the character of the rocks; therefore, the occurrence of ground water in any region is determined by the geology of that region.
The interstices or voids in rocks range in size from microscopic openings in clay to huge caverns in limestones. The openings generally are connected so that water may move from one void to another, but in some rocks the voids are isolated so that there is little or no movement of the water. Several common types of interstices or voids, and the relation of texture to porosity, are shown in Figure 12.
Figure 12—Diagram showing several types of rock interstices.
Below a certain level in the earth's crust the rocks generally are saturated with water and are said to be in the zone of saturation (Fig. 13). The upper surface of the zone of saturation is called the ground-water table or the water table. The rocks above the water table are in the zone of aeration. This zone generally consists of three parts: the belt of soil water at the top, the intermediate vadose zone, and the capillary fringe at the bottom.
Figure 13—Diagram showing divisions of subsurface water.
The belt of soil water lies just below the land surface and normally contains water held by molecular attraction. During periods of ground-water recharge this zone contains water in excess of the amount that can be held by molecular attraction, and the excess percolates downward to the water table. The thickness of the belt of soil water depends upon the soil, the precipitation, and the vegetation.
The intermediate belt of vadose water lies between the soil belt and the capillary fringe. In this zone the interstices in the rocks contain water held by molecular attraction, and at times of ground-water replenishment they contain also water that is moving downward to the water table. The intermediate zone may be absent or may be several hundred feet thick, depending on the local geology, topography, and climate. In Reno County the intermediate zone is absent in some areas and is nowhere more than 60 feet thick.
The capillary fringe lies directly below the intermediate belt and over the water table and is formed of water held up from the zone of saturation by capillary force. The water in this zone is not available to wells, which must be deepened to the zone of saturation to obtain water. The capillary fringe may be absent or very thin in coarse-grained materials, but it may be several feet thick in fine-grained materials.
The porosity of a rock aggregate is its property of containing interstices. Porosity is expressed as the percentage of the total volume occupied by the interstices.
The moisture equivalent of a water-bearing material is expressed as a ratio of (1) the weight of water that the material, after saturation, will retain against a centrifugal force 1,000 times greater than the force of gravity, to (2) the weight of the dry material. To convert this figure to percentage of volume, the moisture equivalent is multiplied by the apparent specific gravity of the dry material.
The specific retention of a rock or soil, with respect to water, is the ratio of (1) the volume of water which, after being saturated, it will retain against the pull of gravity to (2) its own volume. It is stated as a percentage and may be expressed by the formula R = 100 (r/v), where R is the specific retention, r is the volume of water retained by the rock or soil against the pull of gravity, and v is the volume of the rock or soil.
The specific yield of a water-bearing formation is the ratio of the volume of water a saturated material will yield to gravity in proportion to its own volume (Meinzer, 1923, p. 28). The specific yield is equal to the porosity minus the specific retention. The specific yield of a formation is needed to estimate the quantity of water available to wells and to estimate the quantity of water represented by a rise or decline in the water table during periods of recharge or discharge.
Physical and Hydrologic Properties of Water-bearing Materials
The quantity of water an aquifer will yield to wells depends upon the physical and hydrologic properties of the materials composing the aquifer. Geologic descriptions of the materials penetrated by test holes and wells are useful in making estimates of the quantity of water an aquifer will yield. A more precise estimate of the amount of water that an aquifer will yield can be obtained from field or laboratory tests of the water-bearing materials.
Samples of water-bearing materials were collected for analysis in the hydrologic laboratory of the Geological Survey in Lawrence. These studies included mechanical (particle-size) analyses and permeability determinations. Some of the samples were collected in the fall of 1945 during an investigation of the ground water in the Arkansas River valley in the vicinity of Hutchinson (Williams, 1946). In November 1949, samples were collected from six test holes that were drilled in the county, and mechanical analyses and permeability determinations were made on a part of these samples (Table 3).
Table 3—Physical properties of water-bearing material from test holes in Reno County.
| Test Hole Number |
Depth of Sample (feet) |
Mechanical Analysis (percent by weight) | Coefficient of permeability (gpd/ft2) |
|||||||
|---|---|---|---|---|---|---|---|---|---|---|
| Gravel (larger than 4 mm) | Fine gravel (4.0-2.0 mm) | Very coarse sand (2.0-1.0 mm) | Coarse sand (1.0-0.50 mm) | Medium sand (0.50-0.25 mm) | Fine sand (0.25-0.125 mm) | Very fine sand (0.125-0.062 mm) | Silt and clay (less than 0.062 mm) | |||
| 22-5-19ab | 0-2 | 31.3 | 49.0 | 11.7 | 8.0 | |||||
| 2-14 | 0.4 | 34.6 | 51.4 | 7.6 | 6.0 | |||||
| 14-16 | .9 | 23.9 | 37.8 | 10.0 | 27.4 | |||||
| 16-28 | .4 | 36.8 | 50.0 | 6.4 | 6.4 | |||||
| 28-38 | .9 | 27.1 | 35.8 | 11.8 | 24.5 | |||||
| 66-92 | 7.1 | 58.0 | 27.5 | 2.9 | 4.5 | 110 | ||||
| 22-5-28ad | 0-29 | 2.3 | 48.1 | 43.0 | 4.7 | 1.9 | ||||
| 29-34 | 1.0 | 40.4 | 42.0 | 8.3 | 8.3 | |||||
| 34-65 | 2.4 | 25.7 | 28.5 | 15.3 | 28.1 | |||||
| 65-85 | 3.4 | 28.8 | 34.2 | 10.3 | 23.3 | 50 | ||||
| 85-116 | 4.8 | 54.8 | 32.7 | 3.8 | 3.9 | 110 | ||||
| 22-5-30dc | 0-3 | 3.9 | 35.3 | 39.8 | 10.5 | 10.5 | ||||
| 12-18 | 20.3 | 26.4 | 30.0 | 15.9 | 4.8 | 1.3 | .4 | .9 | ||
| 18-25 | 3.2 | 11.2 | 27.1 | 28.2 | 21.1 | 6.4 | 1.2 | 1.6 | 1,400 | |
| 25-31 | 7.9 | 22.2 | 27.5 | 19.9 | 13.9 | 6.4 | 1.1 | 1.1 | 2,800 | |
| 31-34 | 5.0 | 14.9 | 29.0 | 25.6 | 16.0 | 7.3 | 1.1 | 1.1 | 750 | |
| 22-5-29dd | 0-4 | .4 | .4 | 3.5 | 8.8 | 26.4 | 34.8 | 10.2 | 15.5 | |
| 16-31 | 6.7 | 24.2 | 36.4 | 21.1 | 8.5 | 1.8 | .4 | .9 | 3,200 | |
| 22-6-26cb | 0-3 | .8 | 11.1 | 10.3 | 16.1 | 61.7 | ||||
| 10-20 | 3.6 | 17.0 | 28.9 | 26.8 | 11.6 | 4.9 | 2.7 | 4.5 | 120 | |
| 20-25 | 6.6 | 17.1 | 32.3 | 23.2 | 12.3 | 3.8 | 1.9 | 2.8 | 810 | |
| 25-68 | 19.2 | 27.4 | 33.6 | 13.5 | 3.8 | 1.0 | .5 | 1.0 | 2,400 | |
| 23-4-18cb | 0-6 | 1.3 | 11.5 | 54.1 | 27.4 | 3.8 | 1.9 | |||
| 10-43 | 15.7 | 34.2 | 29.9 | 12.8 | 5.5 | 1.1 | .4 | .4 | 1,500 | |
| 23-5-3aa | 0-5 | 1.0 | 44.7 | 43.6 | 7.1 | 3.6 | ||||
| 5-16 | .4 | 5.9 | 55.4 | 26.6 | 4.7 | 7.0 | 40 | |||
| 16-28 | 1.5 | 49.3 | 42.6 | 5.1 | 1.5 | 190 | ||||
| 28-31 | .4 | 8.4 | 59.3 | 21.3 | 4.4 | 6.2 | ||||
| 31-41 | 3.6 | 56.2 | 33.7 | 4.1 | 2.4 | 140 | ||||
| 41-47 | 4.2 | 58.3 | 30.9 | 4.2 | 2.4 | 210 | ||||
| 47-57 | 1.1 | 15.4 | 49.2 | 17.7 | 6.3 | 10.3 | 30 | |||
| 57-98 | 5.9 | 47.4 | 23.0 | 7.9 | 15.8 | 10 | ||||
| 98-107 | 6.4 | 44.6 | 36.2 | 6.4 | 6.4 | |||||
| 107-109 | 13.8 | 55.2 | 20.0 | 3.8 | 7.2 | 80 | ||||
| 109-123 | 2.3 | 33.7 | 32.7 | 10.6 | 20.7 | |||||
| 23-5-8aa | 0-3 | 1.6 | 10.6 | 15.7 | 13.3 | 28.8 | ||||
| 3-5 | 1.8 | 7.8 | 12.1 | 78.3 | ||||||
| 5-23 | 3.6 | 9.1 | 14.6 | 18.7 | 33.4 | 17.4 | 2.3 | .9 | ||
| 23-30 | 20.9 | 25.4 | 28.8 | 15.2 | 6.2 | 2.3 | .6 | .6 | 4,400 | |
| 30-42 | 8.8 | 13.6 | 25.3 | 26.6 | 16.3 | 8.2 | .7 | .7 | 1,090 | |
| 42-57 | 33.2 | 20.1 | 21.6 | 15.1 | 6.5 | 2.0 | 1.0 | .5 | ||
| 57-62 | 13.8 | 13.8 | 19.6 | 25.0 | 21.3 | 5.5 | .5 | .5 | 1,200 | |
| 23-5-14da | 0-4 | .9 | 8.2 | 56.4 | 28.9 | 3.9 | 1.7 | |||
| 4-7 | .7 | 2.9 | 5.8 | 16.1 | 33.6 | 26.6 | 6.6 | 11.7 | ||
| 7-42 | 21.5 | 25.2 | 29.0 | 19.4 | 4.1 | .8 | 2,200 | |||
| 42-47 | 10.2 | 19.6 | 34.5 | 28.0 | 5.8 | 1.1 | .4 | .4 | 950 | |
| 23-5-232dd | 0-2 | .5 | 3.8 | 7.5 | 19.8 | 30.4 | 18.2 | 19.8 | ||
| 4-46 | 24.5 | 31.1 | 25.2 | 11.9 | 4.6 | 1.3 | .7 | .7 | 2,300 | |
| 46-50 | 5.2 | 19.1 | 36.4 | 26.0 | 9.8 | 2.3 | .6 | .6 | 650 | |
| 50-97 | 42.6 | 35.9 | 14.8 | 3.6 | 1.4 | .9 | .4 | .4 | ||
| 23-6-1aa | 0-3 | 3.8 | 18.1 | 33.1 | 16.7 | 28.3 | ||||
| 11-70 | 26.6 | 34.9 | 22.3 | 9.7 | 4.0 | 1.4 | .4 | .7 | 2,120 | |
| 23-6-36dd | 0-3 | 2.8 | 23.5 | 16.6 | 13.9 | 43.2 | ||||
| 20-64 | 24.3 | 28.8 | 19.2 | 13.5 | 7.4 | 3.4 | 1.1 | 2.3 | 3,400 | |
| 74-79 | 1.6 | 4.0 | 19.8 | 37.1 | 23.8 | 8.1 | 2.4 | 3.2 | 50 | |
| 89-124 | 8.5 | 34.8 | 24.2 | 20.3 | 7.6 | 2.5 | .8 | 1.3 | 3,800 | |
| 124-136 | 3.1 | 30.7 | 32.5 | 14.2 | 9.3 | 5.3 | 1.8 | 3.1 | 2,400 | |
| 24-6-12bb | 0-3 | 1.6 | 16.8 | 39.8 | 16.7 | 7.3 | 17.8 | |||
| 20-29 | 1.3 | 9.4 | 37.1 | 34.6 | 8.2 | 3.1 | 6.3 | 380 | ||
| 29-40 | .6 | 8.1 | 19.1 | 45.0 | 22.0 | 3.5 | .6 | 1.1 | 140 | |
| 46-72 | 2.2 | 27.7 | 35.4 | 19.7 | 7.7 | 2.9 | 1.5 | 2.9 | 540 | |
| 80-152 | 6.2 | 19.0 | 24.4 | 23.4 | 14.2 | 5.7 | 2.7 | 4.4 | 90 | |
| 23-5-2dd | 32-58 | 50 | ||||||||
| 23-5-24da | 9-69 | 1,900 | ||||||||
| 22-9-20dd | 40-80 | 430 | ||||||||
| 80-119 | 230 | |||||||||
| 160-180 | 400 | |||||||||
| 193-212 | 2,400 | |||||||||
| 23-10-19bcb | 17-78.5 | 2,200 | ||||||||
| 25-10-12cc | 30-48.5 | 140 | ||||||||
| 51-85 | 460 | |||||||||
| 26-10-20dd | 20-54.5 | 50 | ||||||||
Mechanical Analysis
A mechanical, or particle-size, analysis of materials consists of separating into groups the grains of different size and determining the percentage by weight of each size group. Results of the analyses are shown in Table 3.
Laboratory determinations of porosity and specific yield were not made on any of the samples from test holes in Reno County, but such determinations were made on some well cuttings from wells in the Wichita well field, which is a few miles east of Reno County. The porosity ranged from 24.1 to 60.2 percent. The specific yield averaged 26.8 percent (Williams and Lohman, 1949). The water-bearing materials near Hutchinson in Reno County in the Arkansas River valley are very similar to those in the Wichita well field and probably have about the same porosity and specific yield.
Permeability
The permeability of water-bearing material generally is expressed as a coefficient of permeability. The coefficient of permeability is defined as the number of gallons of water a day at a temperature of 60°F that will be conducted through each mile of the water-bearing bed under investigation, measured at right angles to the direction of flow, for each foot of thickness of the bed and for each foot per mile of hydraulic gradient (Meinzer's coefficient, or meinzer).
The quantity of water that will percolate through a given cross section of water-bearing material under a known hydraulic gradient is directly proportional to the coefficient of permeability. Thus, to compute the quantity of water that will percolate into or out of a given area the permeability must be determined.
Coefficients of permeability have a wide range in value. Clay and silt, which are fine grained, may have high porosity, but very low permeability; a coarse-grained sand may have a lower porosity, but a high permeability, owing to the greater ability of the coarse-grained material to transmit water. Coefficients of permeability of less than 100 are considered low, coefficients of 100 to 1,000 are medium, and those more than 1,000 are considered high.
Permeability tests were made on samples of water-bearing materials collected near Hutchinson in Reno County. The permeability ranged from 10 for fine sand mixed with silt to 4,400 for coarse and medium gravel. The permeability of most samples ranged from 1,000 to 3,000, except in the sand-dune area (Table 8). Permeability of the silts and clays was not tested, but generally the permeability of these materials is very low.
The Water Table and Movement of Ground Water
The upper surface of the zone of saturation in ordinary permeable soil or rock has been termed the ground-water table, or simply the water table. Where the upper surface is intersected by impermeable material, the water table is interrupted, and artesian conditions are said to exist. The water table is not a plane surface but has irregularities comparable with and related to those of the land surface, although the water table is less rugged. The water table does not remain in a stationary position, but fluctuates up and down. The irregularities are caused chiefly by local differences in geology and topography, and the fluctuations are due to gain or loss of water.
The shape of the water table in Reno County is shown on Plate 1 by contour lines drawn on the water table. All points along a contour line have the same altitude, and the lines show the shape and slope of the surface of the water table as the land surface is shown on a topographic map. The water moves down slope in a direction at right angles to the contours. In general, the shape of the water table in Reno County conforms to the surface of the land. The water table is high in the dune-sand area, in areas north and east of Hutchinson, and in local areas in the western part of the county. The water table is near the surface in these areas because the surface material is relatively permeable and admits large quantities of water.
The North Fork of the Ninnescah River, Cow Creek, and Little Arkansas River are effluent streams throughout most of their courses in Reno County; that is, they are perennial streams, the channels of which have been cut below the water table and the streams are thereby gaining water from the zone of saturation. This movement of water from the underground reservoir to the channels of these streams has caused troughs to be formed in the water table that follow the courses of these streams, as indicated by the upstream flexure of the contours. The water-table contours cross the Arkansas River approximately at right angles, which indicates an apparent balance between the level of water in the stream and the adjacent water table, the stream neither gaining nor losing water. At times of low water, however, the Arkansas River will gain water from the ground-water reservoir and at times of high water the river will lose water to the ground-water reservoir.
Ground-water Recharge
Recharge is the addition of water to the ground-water reservoir. Precipitation is the original source of all ground-water recharge, although in a particular area the ground-water reservoir may be recharged in several ways. The principal source of recharge in Reno County is precipitation. At times of high water the streams, especially the Arkansas River and parts of Cow Creek, contribute water to the ground-water reservoir. The amount of water contributed by the streams is only a small part of the total amount of recharge. Water moves into Reno County from the west and also from the north. Williams (1946) estimated that about 500 acre-feet of water a year moves across each mile of border="1" area into the sandhills north of Hutchinson. He estimated also that about half the precipitation in the sandhills region becomes ground-water recharge.
The sand, soil, and topography in the sandhill area north of Hutchinson and in western Reno County are favorable for ground-water recharge. Many undrained basins hold the precipitation, and the sandy soil and subsoil allow it to percolate downward to the water table.
The sandy soil and flat topography of the terrace deposits and the alluvium in the Arkansas River valley are favorable to recharge. East of Reno County in Sedgwick and Harvey counties, wells drilled in deposits similar to those in the Arkansas River valley in Reno County were equipped with automatic water-stage recorders and have been observed since 1938. A study of these records indicates that about 20 percent of the annual precipitation reaches the water table (Williams and Lohman, 1949). The deposits described by Williams and Lohman are continuous with those in the Arkansas River valley in Reno County, so that probably about 20 percent of the annual precipitation in the valley in Reno County also reaches the water table; 20 percent of the precipitation would amount to about 300 acre-feet or about 100 million gallons on each square mile. Figure 14 shows the hydrographs of three wells in the Arkansas River valley, the monthly precipitation, and the cumulative departure from normal precipitation. The period of measurements is short, but the fluctuations of the water levels correlate fairly well with the precipitation.
In the upland areas in central and southern Reno County the slopes are steeper and the soil is not as sandy as in the valley plain. Hence a larger fraction of the water runs off the upland surface and there is much less recharge than in the valley.
In the areas underlain by Permian shales, the soils are compact and have a very low permeability. In these areas the recharge is much less than in either the upland areas or the Arkansas River valley.
Ground-water Discharge
Ground-water discharge is the water discharged from the zone of saturation or the capillary fringe and may take place by flow directly into streams, from springs and seeps, or by evaporation and transpiration. Discharge of water by these methods is called natural discharge. Discharge of water by pumping from wells or infiltration galleries is artificial discharge.
Before wells were drilled in Reno County, the water table was in approximate equilibrium; that is, the annual discharge by evaporation, transpiration, and discharge into streams was approximately equal to the annual recharge from precipitation and seepage from streams. At the present time water is discharged into the Ninnescah River, Little Arkansas River, and Peace Creek. The Arkansas River is in approximate equilibrium with the water table and does not add water to or receive water from the ground-water body in most of its course through Reno County (P1. 1).
Transpiration is the process by which water is taken into the roots of plants and is evaporated into the atmosphere. The depth from which plants will obtain their water from the water table varies with the plant species and type of soil. Ordinary grasses and field crops will not send their roots more than a few feet in the search for water, but alfalfa and certain desert plants may send their roots to a depth of as much as several tens of feet to reach the water table (Meinzer, 1923).
Discharge of ground water by transpiration and evaporation is relatively great in Reno County, owing to the shallow depth to the water table in much of the county. The greatest discharge by transpiration and evaporation probably is in the Arkansas River valley, where the water table is shallow. The quantity of ground water discharged in Reno County by evaporation and transpiration is probably much greater than the amount discharged by all other means.
The discharge of water from wells in Reno County is now one of the principal means of discharge of ground water. The average pumpage of water for industrial, municipal, and farm use is about 15,000 acre-feet annually, which is probably between 5 and 10 percent of the total recharge in the county.
Recovery
Principles of Recovery
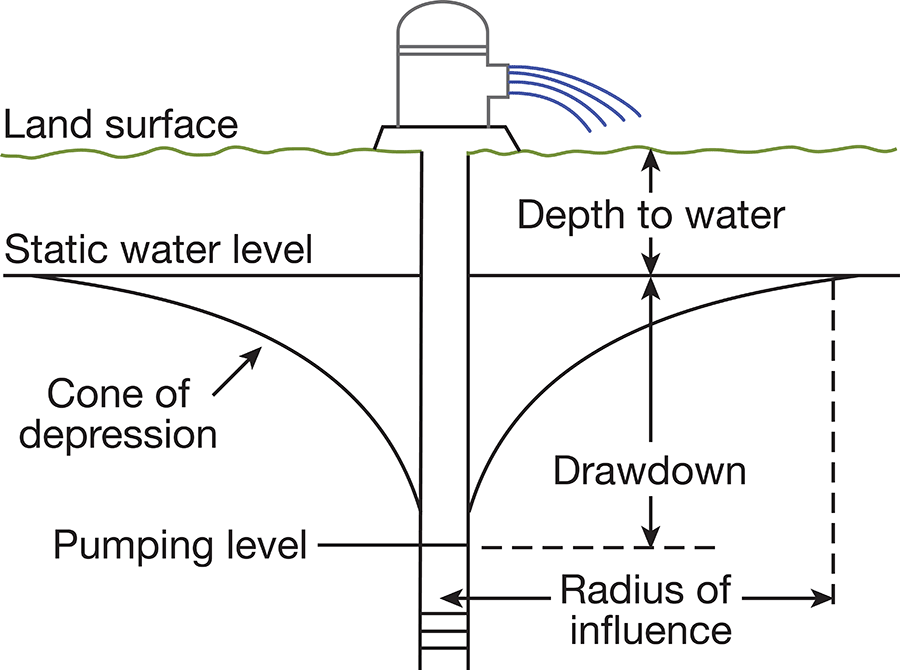
When water is pumped from a well, a difference of head exists between the water in the well and the water outside the well for some distance from the well. The water table for some distance surrounding the well develops a cone of depression (Fig. 15). In any given well, the greater the rate of pumping, the greater the drawdown in the well and throughout the cone of depression. The character and thickness of the water-bearing materials have a direct bearing on the yield and drawdown of a well. Inasmuch as the specific capacity of a well is defined as the yield in gallons a minute per foot of drawdown, the character and thickness of the material surrounding a well have a direct bearing on its specific capacity. A well in coarse material will have a higher specific capacity than a well in fine-grained, poorly sorted material.
Figure 15—Diagrammatic section of a well that is being pumped, showing its drawdown, cone of depression, and radius of influence.
Types of Wells
Dug wells—Dug wells are excavated with pick and shovel or by machinery. Dug wells generally range in diameter from about 2 to 5 feet although they may have a larger diameter--for example, the well in Greensburg, Kiowa County, which has a diameter of 40 feet. Dug wells generally extend only a short distance below the water table.
Bored wells—Bored wells are made by augers or post-hole diggers in unconsolidated materials and generally are made in areas where the water table is shallow. Many wells in Reno County are constructed by this method.
Driven wells—Driven wells are wells constructed in unconsolidated material by driving a 1 1/4- or 1 1/2-inch pipe, equipped at the bottom with a screened drive point, below the water table. Wells generally can be driven only where the water-bearing material is sufficiently permeable to permit water to flow freely into the pipe, where the material is unconsolidated enough to permit a pipe to be driven, and where the depth to the water is not more than 20 feet or so below land surface. In Reno County where the depth to water exceeds 20 feet, the well generally is dug partway so that the distance from the pump cylinder, at the bottom of the dug part of the well, to the water table is less than 20 feet.
Drilled wells—Drilled wells are wells made by percussion or rotary machines and may be drilled either in consolidated or unconsolidated material. Generally, drilled wells in Reno County are 4 to 6 inches in diameter, but many public-supply wells and industrial wells are begun as holes 30 to 60 inches in diameter and finished as gravel-walled wells having a casing 12 to 20 inches in diameter. Most drilled wells in unconsolidated rocks are cased to the bottom of the well, the last few feet of casing being slotted to admit the water into the well. Wells in consolidated rocks generally have casing only to the top of the consolidated rock or in that part of the well that will not remain open without casing. Where large supplies of water are needed, the well should penetrate all the good water-bearing material, and the casing should be perforated so that water will enter the well as fast as the surrounding material will yield it.
Prev Page—General Geology || Next Page—Utilization, Quality
Kansas Geological Survey, Geology
Comments to webadmin@kgs.ku.edu
Web version Feb. 2001. Original publication date Aug. 1956.
URL=http://www.kgs.ku.edu/General/Geology/Reno/gw01.html