![]()
Prev Page--Structural Geology || Next Page--Subsurface Rocks
Part 2--Mineral Resources of Osage County
by Howard G. O'Connor, Walter H. Schoewe, Edwin D. Goebel, and Norman Plummer
Introduction
The known mineral resources of Osage County comprise coal, limestone, sandstone, shale, sand and gravel, silt, and clay. Ground water, also an important mineral resource, is discussed separately in Part 3 of this report. Coal has been mined since the 1860s and for many years Osage County ranked first among Kansas coal-mining counties. Clay resources have been used to a very small extent if at all. No commercial amounts of oil or gas have been produced. Limestone and chert sand and gravel have been produced for local use for many years, but large reserves remain.
Plate 2 is an economic map of Osage County. Locations of active and inactive gravel pits, rock quarries, and coal mines, names of exploited stratigraphic units, and test data on several of the limestones, shales, and clays are indicated on the map and in Tables 1, 2, and 3. Locations of all test wells drilled in search of oil or gas for which any information is available also are shown. The map shows the lowest stratigraphic depth reached and present status of all wells. Locations of roads, railroads, streams, oil and gas pipelines, pumping stations, and benchmarks are indicated.
Table 1--Chemical analyses of selected outcropping limestone from Osage County. (Analyzed under the supervision of Russell T. Runnels in State Geological Survey laboratories.)
| Stratigraphic unit, thickness, and type of sample |
Location | SiO2 | Al2O3(1) | Fe2O3 | CaO | MgO | P2O5 | SO3 | Ignition loss |
Calculated CaCO3(2) |
Calculated MgCO3(3) |
|---|---|---|---|---|---|---|---|---|---|---|---|
| Ervine Creek ls., composite of 9.8 ft. | NE NW 32-14-17E | 2.77 | 0.85 | 1.32 | 52.12 | 1.03 | Trace | Trace | 42.02 | 93.02 | 2.15 |
| Tarkio ls., spot sample, lower 2.5 ft. | SE SE 12-15-13E | 5.34 | 1.64 | 2.24 | 49.32 | 0.95 | 0.07 | Trace | 38.85 | 87.8 | 1.99 |
| Curzon ls., composite of 6 ft. of bed | SE NE 27-15-15E | 3.61 | 0.81 | 1.22 | 52.75 | 0.47 | 0.11 | Trace | 41.18 | 93.83 | 0.98 |
| Ozawkie ls., composite of 11.7 ft. (without shale partings) |
NW NE 4-15-17E | 3.87 | 0.82 | 2.73 | 51.28 | 0.88 | Trace | Trace | 40.81 | 91.52 | 1.84 |
| Upper Elmont ls., spot sample, 1.5ft. Bed | NW NE 23-16-13E | 2.17 | 1.57 | 1.42 | 51.73 | 1.32 | 0.1 | 0.47 | 41.9 | 91.44 | 2.76 |
| Middle Elmont ls., spot sample, 1.5 ft. bed | NW NE 23-16-13E | 5.75 | 1.76 | 1.08 | 49.5 | 0.91 | 0.1 | 0.37 | 39.9 | 87.59 | 1.9 |
| Lower Elmont ls., composite of 3.5 ft. bed | NW NE 23-16-13E | 4.89 | 1.06 | 1.21 | 49.43 | 1.38 | 0.06 | 0.32 | 40.73 | 87.7 | 2.89 |
| Hartford ls., composite of 5 ft. bed | NW SE 12-18-14E | 0.74 | 0.24 | 0.53 | 54.37 | 0.51 | 0.07 | 43.13 | 96.81 | 1.07 | |
| Curzon ls., compostie of 5.8 ft. bed | SE SW 14-18-14E | 3.45 | 0.75 | 0.66 | 51.84 | 0.96 | 0.06 | Trace | 41.62 | 92.39 | 2.01 |
| Hartford ls., upper 3.5 ft. of 8.5 tf. bed | SE SW 14-18-14E | 2.88 | 3.89 | 5.01 | 30.77 | 13.54 | 0.2 | 0.13 | 42.59 | 54.3 | 28.14(4) |
| Hartford ls., lower 5 ft. of 8.5 ft. bed | SE SW 14-18-14E | 0.82 | 0.25 | 0.67 | 54.56 | 0.53 | 0.08 | 43.07 | 97.11 | 1.11 | |
| Plattsmouth ls., composite of 20.2 ft. bed | NW SW 3-18-16E | 3.89 | 1.04 | 1.32 | 49.59 | 2.15 | Trace | 0.16 | 41.24 | 88.31 | 4.5 |
| (1) Includes MnO and TiO2 (2) At 1,000 deg. C. (3) Not corrected for small percentages of Ca in phosphates and sulfates (4) Calculated FeCO3, 7.27 |
|||||||||||
Table 2--Ceramic data on shale samples from Osage County.
| Plastic and Dry Properties | |||||
|---|---|---|---|---|---|
| Sample no. | Location | Stratigraphic position |
Thickness sampled, feet |
Water of plasticity, percent |
Drying shrinkage, percent |
| GO-8(1) | SE SW 17-16-15E | Aarde-Severy | 47 | 19.00 | 0.87 |
| OG-8-A | SE SW 17-16-15E | Aarde-Severy | 8 | 19.74 | 2.19 |
| OG-8-B | SE SW 17-16-15E | Aarde-Severy | 10 | 17.73 | 1.10 |
| OG-8-C | SE SW 17-16-15E | Aarde-Severy | 9 | 18.21 | 0.88 |
| OG-8-D | SE SW 17-16-15E | Aarde-Severy | 10 | 17.97 | 1.45 |
| OG-8-E | SE SW 17-16-15E | Aarde-Severy | 10 | 20.85 | 0.72 |
| OG-9 | SW SE 8-14-17E | Tecumseh | 17 | 21.84 | 2.94 |
| OG-10 | SE SE 35-16-14E | Severy (middle) | 37 | 20.07 | 1.57 |
| OG-11 | SW SW 4-17-15E | Calhoun | 12 | 25.78 | 4.09 |
| OG-12 | NW SW 22-17-13E | White Cloud | 27 | 22.91 | 2.05 |
| OG-13 | NW SE 19-16-16E | Calhoun | 12 | 27.36 | 2.95 |
| OG-14 | SW NE 7-16-16E | Tecumseh (lower) | 12 | 27.15 | 6.60 |
| OG-15-C(2) | SE SW 14-16-14E | Severy (upper) | 24 | 18.82 | 1.87 |
| OG-15-D | SE SW 14-16-14E | Severy (middle) | 18 | 18.92 | 2.07 |
| OG-15-E | SE SW 14-16-14E | Severy (lower) | 18 | 18.86 | 2.61 |
| OG-15-F | SE SW 14-16-14E | Calhoun (upper) | 7 | 19.55 | 2.31 |
| OG-15-J | SE SW 14-16-14E | Tecumseh | 15 | 19.09 | 3.63 |
| OG-15-K | SE SW 14-16-14E | Stull | 14 | 19.84 | 3.70 |
| OG-15-N | SE SW 14-16-14E | Jackson Park (lower) | 29 | 19.08 | 3.57 |
| OG-15-O | SE SW 14-16-14E | Heumader | 13 | 22.47 | 5.26 |
| Fired Properties | |||||||
|---|---|---|---|---|---|---|---|
| Sample no. |
Fired to cone |
Fired color |
Linear shrinkage, percent |
Total linear shrinkage, percent |
Percent absorption |
Saturation Coefficient |
|
| 24 hours cold water |
5 hours boiling water |
||||||
| OG-8 | 06 | Red | 0.58+(3) | 0.29 | 17.30 | 23.33 | 0.74 |
| OG-8-A | 04 | Red | 2.16 | 4.35 | 13.69 | 16.79 | 0.82 |
| 01 | Red | 5.11 | 7.30 | 7.49 | 10.76 | 0.70 | |
| 2 | Dark red | 6.79 | 8.98 | 4.11 | 6.96 | 0.59 | |
| OG-8-B | 04 | Red | 0.14 | 1.24 | 14.83 | 20.57 | 0.72 |
| 01 | Red | 1.27 | 2.37 | 12.32 | 18.39 | 0.67 | |
| 2 | Dark red | 2.59 | 3.67 | 9.74 | 15.84 | 0.61 | |
| OG-8-C | 04 | Red | 0.23+ | 0.65 | 15.95 | 22.28 | 0.72 |
| 01 | Red | 0.89 | 1.77 | 14.10 | 20.66 | 0.68 | |
| 2 | Dark red | 2.49 | 3.37 | 10.19 | 16.58 | 0.61 | |
| OG-8-D | 04 | Light red | 0.29+ | 1.16 | 16.15 | 22.28 | 0.72 |
| 01 | Red | 0.84 | 2.29 | 13.80 | 20.49 | 0.67 | |
| 2 | Dark red | 2.41 | 3.86 | 10.41 | 16.90 | 0.62 | |
| OG-8-E | 04 | Red | 0.09 | 0.81 | 20.12 | 26.37 | 0.76 |
| 01 | Red | 1.90 | 2.62 | 16.71 | 22.82 | 0.73 | |
| 2 | Dark red | 3.65 | 4.14 | 12.90 | 18.58 | 0.69 | |
| OG-9 | 05 | Dark red | 3.12 | 6.06 | 11.64 | 14.54 | 0.80 |
| 02 | Weak red | 6.00 | 8.94 | 5.23 | 7.87 | 0.66 | |
| 3 | Red | 8.09 | 11.03 | 1.56 | 2.99 | 0.52 | |
| OG-10 | 05 | Orange red | 2.30 | 3.87 | 14.26 | 17.21 | 0.83 |
| 02 | Weak red | 5.20 | 6.77 | 7.77 | 11.26 | 0.69 | |
| 3 | Red | 8.04 | 9.61 | 2.68 | 5.08 | 0.53 | |
| 4 | Dark red | 8.63 | 10.20 | 0.67 | 11.15 | 0.58 | |
| OG-11 | 05 | Orange red | 4.46 | 8.55 | 10.23 | 12.44 | 0.82 |
| 02 | Weak red | 7.62 | 11.71 | 3.39 | 4.31 | 0.79 | |
| OG-12 | 05 | Orange red | 3.38 | 5.83 | 12.25 | 15.03 | 0.82 |
| 02 | Red | 6.45 | 8.50 | 6.31 | 9.25 | 0.68 | |
| 3 | Red | 8.94 | 10.99 | 1.59 | 2.58 | 0.62 | |
| OG-13 | 05 | Orange red | 6.84 | 9.79 | 9.16 | 10.85 | 0.84 |
| 02 | Orange red | 9.68 | 12.63 | 1.08 | 2.47 | 0.44 | |
| OG-14 | 05 | Orange red | 5.89 | 12.49 | 3.86 | 5.53 | 0.70 |
| 02 | Red | 7.81 | 14.48 | 0.22 | 1.31 | 0.17 | |
| OG-15-C | 05 | Pale red | 0.19 | 2.06 | 15.26 | 20.92 | 0.73 |
| 1 | Light red | 2.01 | 3.88 | 11.67 | 17.49 | 0.67 | |
| 3 | Red | 5.04 | 6.91 | 5.46 | 11.05 | 0.49 | |
| OG-15-D | 05 | Light red | 0.31 | 2.38 | 16.15 | 20.66 | 0.78 |
| 1 | Pink buff | 1.83 | 3.90 | 12.29 | 17.07 | 0.72 | |
| 3 | Red | 4.98 | 7.05 | 6.34 | 11.22 | 0.57 | |
| OG-15-E | 05 | Orange red | 0.66+ | 1.95 | 18.53 | 23.20 | 0.80 |
| 1 | Pinkish yellow | 0.17+ | 2.44 | 16.97 | 22.45 | 0.76 | |
| 3 | Yellow red | 1.54 | 4.15 | 11.67 | 17.75 | 0.66 | |
| OG-15-F | 05 | Orange red | 0.42+ | 1.89 | 15.17 | 20.28 | 0.75 |
| 1 | Orange red | 0.85 | 3.16 | 12.76 | 18.46 | 0.69 | |
| 3 | Red | 3.65 | 5.96 | 7.41 | 13.12 | 0.56 | |
| OG-15-J | 05 | Orange red | 1.11 | 4.74 | 11.88 | 14.61 | 0.81 |
| 1 | Orange red | 2.05 | 5.68 | 10.29 | 13.51 | 0.76 | |
| 3 | Yellow red | 3.77 | 7.40 | 3.83 | 6.91 | 0.55 | |
| OG-15-K | 05 | Pale red | 4.69 | 8.39 | 6.93 | 9.04 | 0.77 |
| 1 | Weak red | 6.92 | 10.62 | 2.48 | 4.36 | 0.57 | |
| OG-15-N | 05 | Light red | 2.71 | 6.28 | 10.36 | 12.78 | 0.81 |
| 1 | Reddish pink | 4.56 | 8.13 | 6.37 | 8.90 | 0.72 | |
| 3 | Red | 7.52 | 11.09 | 1.21 | 3.25 | 0.37 | |
| OG-15-O | 05 | Pale red | 7.15 | 12.41 | 5.95 | 7.30 | 0.82 |
| 1 | Weak red | 7.02 | 12.28 | 1.01 | 2.00 | 0.51 | |
| (1) OG-8 is a composite of samples OG-8-A through OG-8-E, which are successive samples taken by drilling. OG-8-A represents the upper 8 feet, etc. (2) Samples OG-15-C through OG-15-O were taken from drilling cores from the same test hole. (3) (+) Indicates expansion. |
|||||||
Economic Geology of Outcropping Rocks
Properties, sequence, and age of outcropping rocks are discussed in Part 1 of this report. Their distribution is shown on Plate 1.
Limestone
Many of the outcropping limestones have economic importance because of their thickness, lithology, or composition. The principal uses for which these rocks are suitable include concrete and other aggregate, crushed rock for road metal, agricultural limestone, industrial limestone, riprap, subgrade and embankment material, and building stone. Because of specific chemical or physical properties some of the limestones are suitable for specialized uses. Chemical analyses of rock samples from some of the ledges are listed in Table 1. Location of the active and inactive or abandoned quarries together with the stratigraphic unit represented is shown on Plate 2.
Crushed Rock and Riprap
Many of the thicker ledges in Osage County are potential sources of rock for crushing and riprap material. Because of thickness, physical properties, and geographic distribution some of the ledges have been used extensively whereas others have not been quarried. No recommendations of beds for aggregate or riprap material are made because of the many specifications for aggregate for specialized uses and because no physical tests on any of the limestones were made.
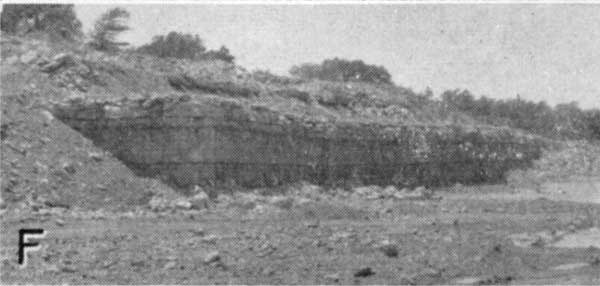
Limestones known to have been quarried for crushed rock or riprap in the past 5 years (1949-1954) include the Tarkio and Reading limestones, the Utopia member of the Howard limestone, the Ervine Creek member of the Deer Creek limestone, and the Kereford and Plattsmouth members of the Oread limestone. The Duesnbury quarry (Pl. 4F) at Melvern is reported to have produced about 60,000 tons of rock, as aggregate, road metal, and agricultural lime, during 1953 and produces the largest annual tonnage of any quarry in Osage County (K.B. Duesnbury, personal communication). The principal stratigraphic unit quarried is the Plattsmouth limestone but smaller amounts of the Kereford limestone have been quarried also.
Plate 4F--Duesnbury quarry in Plattsmouth limestone member, sec. 3, T. 18 S., R. 16 E.
Projects requiring riprap for road, bridge, or railroad fill and embankment protection have utilized the nearest local limestone available which occurred in suitable quantities and had the necessary physical requirements.
Agricultural Limestone
Limestone ledges occurring in beds sufficiently thick to allow economical quarrying and having a calcium carbonate equivalent of 80 percent or more are regarded as potential material for agricultural limestone. Physical requirements for agricultural limestone are largely dependent on processing and are not considered here.
Of 12 samples of limestone collected for chemical analysis all but one met minimum requirements for calcium carbonate equivalent (Table 1). Only those limestones that are thick enough to quarry profitably and are suitable for most uses have been exploited to any extent. These include the Plattsmouth and Ervine Creek limestone members.
Structural Stone
Requirements for structural stone, or building stone, vary greatly with the intended use. In addition to durability and bearing strength, the color, both fresh and weathered, is an important consideration for some structural building stone.
The Tarkio, Reading, lower Topeka, Ozawkie, Utopia, Church, and Kereford limestones have been quarried and used locally as structural stone, but for various reasons have never become popular. The principal use of each of these limestones except the Utopia and Kereford limestones has been for farm buildings and minor engineering work, such as small bridge abutments, foundations, and walls. Both the Utopia and Kereford limestones have been quarried chiefly for flagging.
No plants utilizing diamond or gang saws have been established in Osage County for the production of cut or dimension stone or veneer stone. Structural stone production has been limited to intermittent operation of small quarries to produce hand-selected but uncut stone for the local market.
Flagging was shipped from Osage County quarries to Topeka and Emporia chiefly for use as paving sidewalks in the 1880's and 1890's.
Shales from eight locations were tested to determine drying and firing characteristics. Samples from location OG-8 (Pl. 2) were taken by rotary drilling, and those from location OG-15 by core drilling. Shales sampled included White Cloud, Severy, Calhoun, Tecumseh, Stull member, Jackson Park member, and Heumader member.
The data given in Table 2 were obtained from standard ceramic tests, and indicate that all the shales tested are suitable for the production of heavy clay products such as brick, tile blocks, quarry tile, and drain tile. All samples fire to a shade of red, required firing or burning temperatures ranging from cone 04 (about 1920 deg. F.) to cone 3 (about 2090 deg. F.). The temperatures suitable for firing any of the shales extend over a range long enough for processing in the commonly used downdraft beehive kiln.
Most of the shales contain enough silt or sand to make them somewhat lean or short when pugged with water for molding or extrusion. For most this should be considered an advantage because shales of this type can be dried rapidly without danger of cracking or warping.
The shales were also tested for their suitability as a raw material for producing lightweight concrete aggregate by the rotary kiln method of bloating. The test kiln used is a small batch type. Samples tested in this kiln were preheated to about 1000 deg. F. before being charged into the rotary kiln. Total bloating time ranged from 4 to 9 minutes. The results of these tests are given in Table 3. Unit weights were determined on samples crushed through rolls set three-sixteenths inch apart. This produced an aggregate with maximum sizes slightly more than three-eighths inch in diameter. Unit weights of the crushed samples ranged from 28.40 to 55.00 pounds per cubic foot. This is well within the limit of 75 pounds per cubic foot set by the American Society for Testing Materials (1949) for lightweight aggregate. Unit weights ranging from 40 to 50 pounds per cubic foot are usually considered desirable. Ten of the shales tested fall within this range.
Table 3--Results of lightweight aggregate bloating tests on Osage County shales. Stratigraphic position and location given in Table 2.
| Sample no. |
Time in kiln, minutes |
Firing temperatures, degrees F. |
Unit weight, lbs. per cu. ft. |
Color of crushed aggregate |
||
|---|---|---|---|---|---|---|
| Initial softening |
Formed soft roll |
Maximum attained |
||||
| OG-9 | 8 | 2,220 | 2,240 | 2,240 | 54.30 | Dark gray |
| OG-10 | 5 | 2,170 | 2,230 | 2,260 | 47.73 | Dark gray |
| OG-11 | 4 | 2,260 | 2,270 | 2,290 | 43.80 | Dark gray |
| OG-12 | 9 | 2,200 | 2,240 | 2,240 | 47.73 | Dark gray |
| OG-13 | 6 | 2,220 | 2,260 | 2,260 | 43.55 | Red and dark gray |
| OG-14 | 5 | 2,220 | 2,240 | 2,240 | 28.40 | Red and gray |
| OG-15-C | 6 | 2,230 | 2,250 | 2,260 | 49.10 | Tan and dark gray |
| OG-15-D | 6 | 2,170 | 2,190 | 2,210 | 48.10 | Dark gray |
| OG-15-E | 6 | 2,180 | 2,230 | 2,260 | 48.80 | Dark gray |
| OG-15-F | 5 | 2,120 | 2,180 | 55.00 | Black and tan | |
| OG-15-J | 5 | 2,100 | 2,140 | 2,180 | 38.10 | Dark gray |
| OG-15-K | 5 | 2,160 | 2,170 | 2,190 | 41.40 | Black and tan |
| OG-15-N | 5 | 2,100 | 2,110 | 2,190 | 41.90 | Black and tan |
| OG-15-O | 5 | 2,140 | 2,160 | 2,180 | 44.10 | Black and tan |
Gravel, Sand, and Sandstone
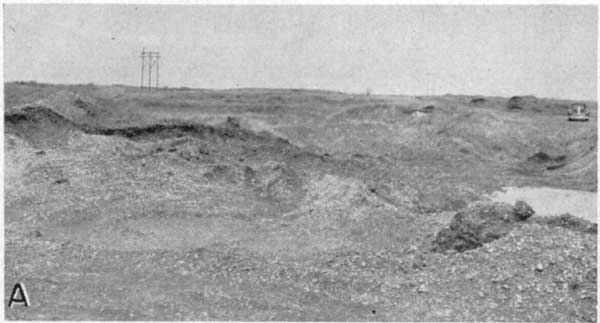
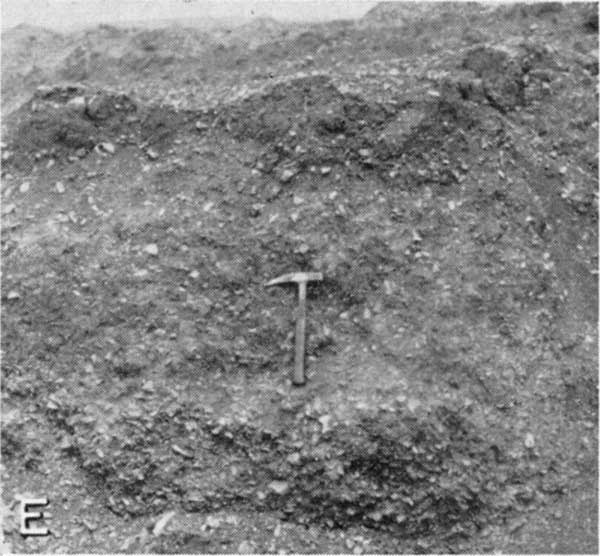
Extensive deposits of gravel and sand composed of chert occur in the terraces of Kansan age and older (Pl. 4A, 4E). These gravel deposits have been used without washing or sizing as road metal on county and township roads for many years. The red clay matrix which fills the voids in the sand and gravel serves as a binder when used as road surfacing material, but limits the uses to which the sand and gravel may be suitable without washing and cleaning.
Plates 4A and 4E--Chert gravel quarry in Pliocene (?) terrace deposits, sec. 27, T. 17 S., R. 14 E.
Gravel and sand in the alluvium and low terrace deposits are not well suited for commercial production because the deposits are poorly sorted and contain varying amounts of hard (limestone, chert, and quartz) and soft (shale, siltstone, and sandstone) rocks. Because it is generally necessary to remove considerable overburden of silt and clay to obtain the sand and gravel and because of the poor quality of material, these deposits likely will remain of little importance as a source of sand or gravel. Locally, small amounts of this material have been removed directly from stream beds for use as an inexpensive but poor quality road metal.
Deposits of fine to very fine (0.25-0.0625 mm) quartz sandstone occur in several of the outcropping shale formations. Individual quartz grains are angular to subangular. Associated with the quartz are scattered mica flakes, glauconite, and pyrite. The sandstones range from well cemented to friable, soft sandstone on the outcrop and grade laterally into sandy shale and shale. One small quarry in the Severy shale (NW 1/4 sec. 1, T. 14 S., R. 15 E.) has been worked recently for sandstone for use as a road material.
Coal
At least nine separate coals have been identified in outcrops in Osage County (stratigraphic column, Pl. 2), but only two, the Nodaway and upper Williamsburg, have been mined to any extent. Schoewe (1946) presents data on the history, location of mines, production, and reserves of coal in the Wabaunsee group. Bowsher and Jewett (1943) compiled similar data on coals of the Douglas group.
The following additional information on mining and coal reserves was compiled as of January 1, 1954.
Two coals, the upper Williamsburg of the Douglas group and the Nodaway of the Wabaunsee group, have been mined in Osage County. Of these two coals, the Nodaway is the only one currently mined and is the one of greatest commercial importance. Cumulative Nodaway coal production of Osage County from 1869 to 1953 inclusive is 11,733,692 tons. Although Osage County at present ranks fifth in production of coal among the Kansas coal mining counties, it formerly ranked first. The period from 1885 to 1892 marked the greatest development of the Osage County mining industry. In 1889, Osage County had 118 coal mines which employed 2,271 men and produced almost 400,000 tons of coal. Seventy-five mines employing 2,917 men were operated in 1891, whereas in 1953, there were only 4 strip and 3 shaft mines mining coal, employing 85 men and producing less than 15,000 tons of coal. The Nodaway coal averages 18 inches in thickness and is mined at the surface by stripping (Pl. 4D) and in shaft mines (Pl. 4C) to a depth of 120 feet. The upper Williamsburg coal averages 12 inches in thickness and lies from 12 to 50 feet beneath the surface in the Quenemo mining area. Production of the Williamsburg coal was never great. As of January 1, 1954, the measured Nodaway coal reserves of Osage County are estimated at 55 million tons of which approximately 35 million tons are within strippable depths, whereas 20 million tons constitute the deep coal. Of the strippable coal 75 percent (or 26,250,000 tons) is considered recoverable coal whereas 50 percent of the deep coal (or 10 million tons) is recoverable. The total recoverable measured Nodaway coal therefore amounts to 36,250,000 tons. The indicated Nodaway coal reserves underlie 49.5 square miles, average 18 inches in thickness, and total 85,536,000 tons of coal. The inferred Nodaway coal is estimated at 142,800,000 tons. The upper Williamsburg coal reserves are estimated at 3,720,000 tons for the measured and indicated reserves and 7,200,000 tons for the inferred reserves.
Plate 4C--Central Fuels Coal Company (Nodaway) coal mine, SW sec. 23, T. 15 S., R. 14 E.
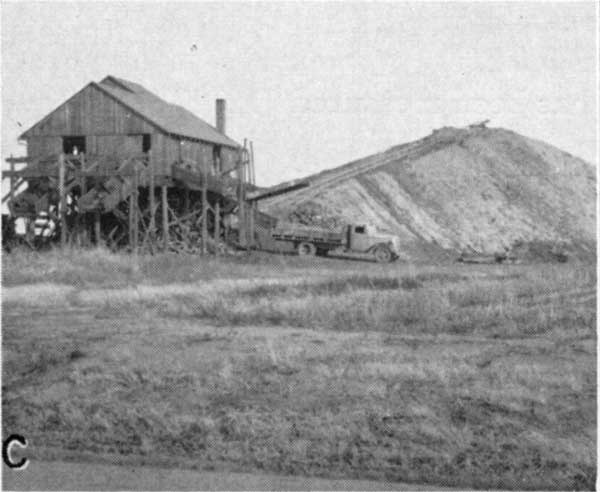
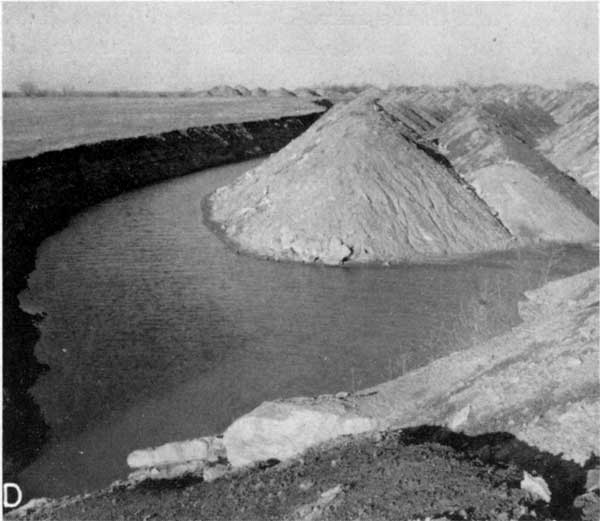
Plate 4D--Oxbow Coal Company strip mine, SW sec. 17, T. 16 S., R. 15 E.
Prev Page--Structural Geology || Next Page--Subsurface Rocks
Kansas Geological Survey, Geology
Web version April 2002. Original publication date May 1955.
Comments to webadmin@kgs.ku.edu
The URL for this page is http://www.kgs.ku.edu/General/Geology/Osage/04_mine.html