![]()
Prev Page--Geology || Next Page--Almena Project
Ground Water
Source
The following discussion on the source and occurrence of ground water has been adapted from Meinzer (1923, pp. 2-102) and the reader is referred to his report, for a more complete discussion of the subject. A summary of ground-water conditions in Kansas has been made by Moore (1940).
Water that occurs in the pores or openings of the rocks and within the zone of saturation is called ground water. The amount of ground water that, can occur below the surface in any region and the manner and rate of its movement to wells or springs is largely controlled by the character of the rocks.
In Norton and northwestern Phillips counties, as in other parts of the central Great Plains, ground water is derived almost, entirely from precipitation in the form of rain or snow. Part of the water that falls as rain or snow is carried away by surface runoff and is lost to streams, part of it may evaporate or be absorbed by vegetation and transpired into the atmosphere. The part that escapes surface runoff, evaporation, and transpiration percolates downward through the soil and underlying strata until it reaches the water table, where it joins the body of ground water in the zone of saturation. In the southern High Plains the average amount of rainfall entering the ground-water body each year has been determined by two different investigations as about one-fourth inch (Frye, 1942, p. 66) and as about one-half inch (Theis, Burleigh, and Waite, 1935, pp. 1-4). The geologic conditions in this area are somewhat different from those in the two areas farther south, but the average annual rainfall is only a few inches more and the amount of rainfall reaching the ground-water body is probably of the same order of magnitude. Although this is a small percentage of the annual rainfall, it should be noted that one-half inch of water entering the groundwater reservoir under 1 square mile amounts to 8,689,348 gallons, or 26.6 acre-feet.
Ground water moves slowly through the rocks in directions determined by the shape and slope of the water table, which is controlled by topography, local variations in the quantity of recharge or discharge, and the stratigraphy and structure of the rocks. It is eventually discharged through springs or wells, through seeps into streams, or by evaporation or transpiration in bottom lands adjacent to streams. Most of the water obtained from wells in Norton County and northwestern Phillips County comes from precipitation in the general vicinity and adjacent areas to the west.
Occurrence
Nearly all rocks that underlie the surface of the earth at depths shallow enough to be penetrated by drills contain voids or interstices. These range in size from microscopic openings to the large caverns developed in limestone regions. The percentage of the volume of the rock mass consisting of such open spaces is known as the porosity. Although it is desirable when considering problems of ground-water supply to know the porosity of the strata under an area, it is the permeability of the material that influences the amount of ground water which can move through it toward a pumping well. The permeability of a rock is determined by the size, shape, and arrangement of the openings. For instance, a bed of fine silt or clay might have a relatively high porosity, but because of the size of the particles each opening is very small. As the force known as molecular attraction holds a very thin layer of water on the surface of each grain, these layers of water (that are not free to move) might fill or almost fill all the openings in such a fine-textured sediment; thus the permeability, or water-yielding capacity of the rock, is very low even though its porosity, or water-holding capacity, is quite high. Likewise, larger openings that are not connected or are poorly connected might produce a high porosity and a low permeability. Water moves most freely through a rock that has relatively large and well-connected openings. Several common types of openings or interstices and the relation of texture to porosity are shown in Figure 4.
Fig. 4--Diagram showing several types of rock interstices and the relation of rock texture to porosity. A, well-sorted sedimentary deposit having a high porosity; B, poorly sorted sedimentary deposit having low porosity; C, well-sorted sedimentary deposit consisting of pebbles that are themselves porous so that the deposit as a whole has a very high porosity; D, well-sorted sedimentary deposit whose porosity has been diminished by the deposition of mineral matter in the interstices; E, rock rendered porous by solution; F, rock rendered porous by fracturing. (From O. E. Meinzer.)
The Water Table and Movement of Ground Water
Shape and slope
The water table is defined as the upper surface of the zone of saturation, except where that surface is formed by an impermeable body (Meinzer, 1923a, p. 32). It may also be regarded as the boundary between the zone of saturation and the zone of aeration. The water table is not a level surface but rather is generally a sloping surface having many irregularities caused by differences in permeability or thickness of the water-bearing materials or by unequal additions to or withdrawals from the ground-water reservoir at different places.
The shape and slope of the water table in Norton and northwestern Phillips Counties are shown on the map (Pl. 2) by means of contour lines drawn on the water table. Each point on the water table along a given contour line has the same altitude. These water-table contours show the configuration of the water surface just as contours on a topographic map show the configuration of the land surface. The direction of movement of the ground water is at right angles to these contour lines--in the direction of the greatest slope.
Plate 2 shows the location of all water wells in which depth to water level was measured, the location of test holes drilled with the State Geological Survey's hydraulic rotary drilling machine, and the sea-level elevation of the water surface at various points along the channels of the main streams. These various data were utilized in the preparation of the water-table contour map, which is generalized because the wells are not close enough to allow detailed control in variable materials such as the Ogallala formation. Also, it was impossible to show minor variations in the water table produced by the deeper parts of many of the tributary valleys. It should be noted that contours have not been drawn for several local areas, particularly in the southeastern corner of Norton County, because in such areas the surficial mantle of Tertiary and Quaternary sediments is thin or absent. This lack of contour lines should not be construed, however, to mean that ground water is not present in the area. In the uncontoured localities of southeastern Norton County some wells obtain water from local alluvial deposits, and deep drilled wells obtain water from Cretaceous rocks.
The map shows that ground water moves under the plains in a general easterly direction across this area, and moves out from the major divide areas toward the principal valleys. The direction of flow of ground water toward the major valleys generally makes an oblique angle upstream with them, and some water may move in a direction essentially parallel to the divides for long distances under the interstream areas. Owing to the great variation in direction of ground-water flow, the gradient of the water table varies greatly. Under the major divide crests it has a general easterly slope of as little as 5 feet per mile. However, along the flanks of the major valleys the water table attains a gradient of as much as 50 feet per mile.
All the major streams of Norton and northwestern Phillips counties exert an important influence on the shape of the water table. In the divide areas ground water moves down slope toward these streams through Ogallala formation, terrace deposits, and alluvium, and is discharged into the channel by seepage along its banks. However, most of the tributary valleys, except in their lower parts, are well above the water table and during periods of flow lose water by seepage rather than gain it. These two relationships of streams to the water table are called influent, for streams that lose water to the water table, and effluent, for streams that gain water from the water table. They have been described by Meinzer and are illustrated in Figure 5.Fig. 5--Diagrammatic sections showing influent and effluent streams. (From O.E. Meinzer.)
Relation to topography
In general the shape of the water table conforms to the regional topography, but it is little affected by minor or local features. That is, the water table slopes upward under the major divide areas to a crest about midway between the major streams, but it is at a greater depth under the divide areas than it is in the valley areas. It might be said that the hills on the water table are not as high as the hills on the surface. Plate 2 shows that the depth to water in some wells in the uplands is as much as 175 feet, whereas the depth to water under the prominent terrace surface along the major valleys is generally less than 40 feet, and in some wells dug or drilled into the alluvium it is less than 10 feet. For the most part, minor topographic features such as the headwater areas of tributary valleys have little or no effect on the water table. For this reason a well drilled in a small valley in the uplands will generally encounter water at a shallower depth than a well drilled on a nearby divide, although the water level in the two may be at about the same elevation with reference to sea level.
Fluctuations of the water table
The water table does not remain in a stationary position but fluctuates much like the water level in a surface reservoir. If the inflow to the underground reservoir exceeds the draft, the water table will rise. Conversely, if the draft exceeds the inflow, the water table will decline. Thus the rate and magnitude of fluctuations of the water table depend upon the rate and magnitude at which the underground reservoir is replenished or depleted.
Factors controlling the rise of the water table in this area are the amount of rainfall that descends through the soil to the water table, the amount of seepage that reaches the underground reservoir from surface streams whose channels are above the water table, and the amount of water entering the county beneath the surface from areas to the west and south. All these factors depend upon precipitation, either in this area or immediately adjacent to the western edge of Norton County.
Factors controlling the decline of the water table are the amount of water pumped from wells, the amount of water absorbed directly from the water table by plants (transpiration), the amount of water lost from the ground-water reservoir by evaporation, the amount of ground water entering surface streams by channel-bank seepage, and the amount of water passing beneath the surface into adjacent areas.
Changes in the water levels in wells record the fluctuations of the water table, which in turn record the recharge and discharge of the ground-water reservoir. In order to determine the character and magnitude of water-level fluctuations in this area, a group of wells was selected for observation and periodic measurement of the water levels in them was begun in 1947. Complete records of these wells are to be published annually by the Federal Geological Survey.
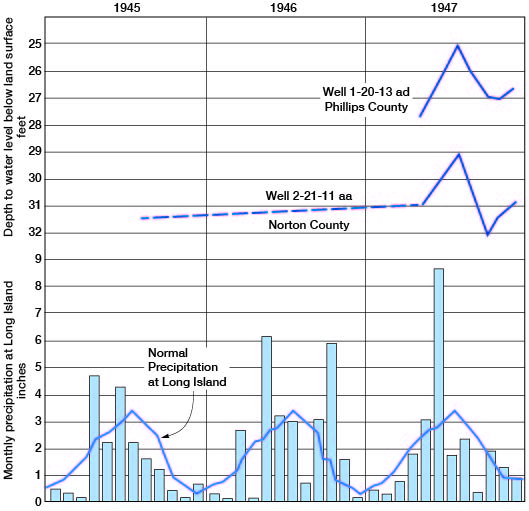
The fluctuations of water level in four observation wells in Norton and Phillips Counties and the monthly precipitation near Norton and at Long Island for the period 1945 through 1947 are given in Figures 6 and 7. The period of observation measurements in these wells is as yet too short to permit definite correlation between precipitation and recharge. Nevertheless, the general concordance between rising water levels and high precipitation is indicated.
Fig. 6--Hydrographs of two observation wells and monthly precipitation (1945-47) near Norton. (Precipitation data from U.S. Weather Bureau.)
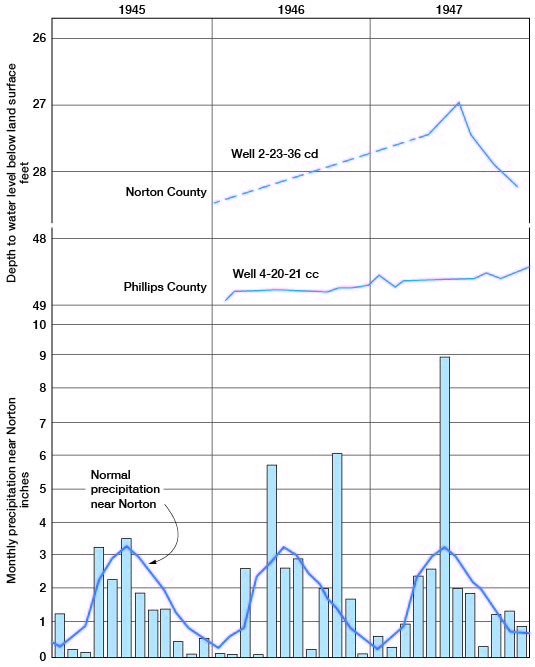
Fig. 7--Hydrographs of two observation wells and monthly precipitation (1945-47) at Long Island. (Precipitation data from U.S. Weather Bureau.)
Recharge
Recharge is the addition of water to the underground reservoir and may be accomplished in several ways. All ground water within a practicable drilling depth in Norton and northwestern Phillips counties, with the possible exception of that obtained from some of the Cretaceous rocks, as in the southeastern part of Norton County, is derived from water that falls as snow or rain either within the area or on nearby areas to the west. Once the water becomes a part of the ground-water body it moves down the slope of the water table, later to be discharged for the most part into the channels of the major streams of this area or those areas immediately adjacent to the east and northeast, or by transpiration in the shallow water areas.
Recharge from local precipitation--The normal annual precipitation in this area is about 21 inches, but probably only a small fraction of this amount enters the zone of saturation, thus to recharge the ground-water reservoir. The depth to the water table exerts an important influence on the amount and frequency of recharge, as does the type of material occurring above the water table. That is, the broad flat, terrace surfaces and flood plains of North Fork Solomon River and Prairie Dog and Sappa Creeks, where the water table lies relatively near the surface and is overlain by unconsolidated deposits of sand and sandy silt, represent, areas of relatively high recharge. On the other hand, maturely dissected divide areas characterized by channels and steep slopes, where the water table lies at considerable depth below the surface and is overlain by the Ogallala formation and massive silts and buried soils of the Sanborn formation, represent, areas of relatively small recharge. Recharge into the small areas of outcropping Cretaceous rocks may vary widely, as little water can penetrate the almost impervious chalky shales and black fissile shales which typify these formations. However, in areas where faulting has occurred, where joints are well developed, or where solution has opened up small channel ways in the chalk, recharge may be relatively high.
Recharge from streams and ponds--All three of the major streams crossing this area occur below the water table and are receiving water from the ground-water reservoir. Therefore they do not constitute sources of recharge to the ground-water body, except in rare instances in local areas where heavy pumping from wells may have lowered the water table below channel level. The upper courses of tributary streams, however, occur above the water table, and during and after rains when these valleys are carrying surface flow some water probably seeps into the alluvial deposits and percolates downward to join the general body of ground water.
A relatively large number of surface ponds have been constructed in Norton County (Moore, 1940, p. 55). Where such ponds contain water, occur above the water table, and are underlain by permeable material, they constitute a source of recharge to the groundwater body. However, where the ponds are well sealed to prevent downward leakage, they have small effect, in recharging the groundwater reservoir.
Recharge from subsurface inflow--As indicated by the slope of the water table (Pl. 2), the movement of ground water under the major divides is in an easterly direction. Hence a small amount of recharge from precipitation that occurs in eastern Decatur County moves into western Norton County and contributes to the available supply of ground water.
Much of the recharge to the water-bearing zones in the Cretaceous rocks may be derived from areas outside Norton and Phillips Counties. Water has been thought to enter these rocks along their outcrop belt east and southeast of this area, and to move westward to replenish the supply under these counties. However, the Cretaceous rocks in southeastern Norton County dip eastward toward the outcrop areas, and the wells which penetrate these rocks in that part of the area encounter water that is under artesian pressure, so that at some places the piezometric surface is more than 100 feet above the level at which the water was encountered. These facts, together with the folding and faulting noted in the Cretaceous rocks in many places, I suggest that the source of the water in these beds is either in or adjacent to this area or west of it, where the land surface is higher and would contribute to the development of hydrostatic pressure.
Discharge
Natural discharge at the surface--Before any wells were drilled the ground-water reservoir of Norton and northwestern Phillips counties was in a state of approximate equilibrium--that is, the average annual recharge was balanced by an approximately equal average annual discharge. The greater part of this discharge occurred by ground-water movement into the major stream channels and eastward under the divide areas out of the counties, and by transpiration by plants in the areas of shallow water. The factors producing discharge by seepage into major stream channels have been changed little, and seepage likely accounts for the major part of the ground-water discharge in the area.
Discharge from wells--At the present time wells constitute one of the principal means of discharge of ground water. Although the total quantity of water pumped annually from wells is not known, all city supplies and some irrigation supplies have been obtained from wells. Most of the rural residents of these counties obtain their domestic and stock supplies from wells, but the total volume of water pumped for such uses is comparatively small.
Recovery
Principles of Recovery
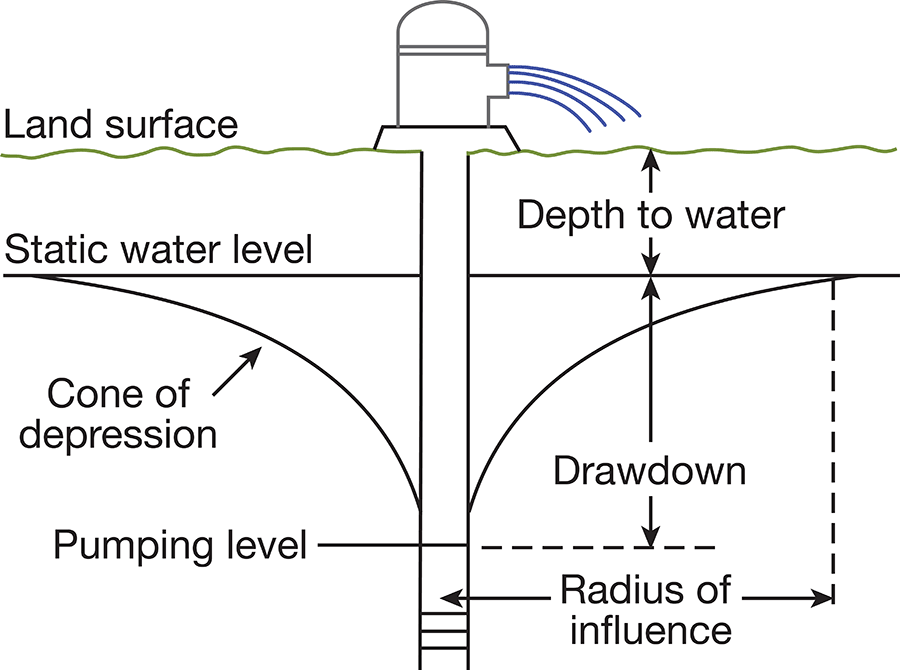
When water is withdrawn from a well there is a difference in head between the water inside the well and the water in the surrounding material for some distance from the well. The water table in the vicinity of the well develops a cone of depression (Fig. 8). In any given well a higher pumping rate produces a greater drawdown (depression of the water level, commonly expressed in feet), and the diameters of the cone of influence and of the area of influence will be greater.
Fig. 8--Diagrammatic section of a well that is being pumped, showing its drawdown, cone of depression, and radius of influence.
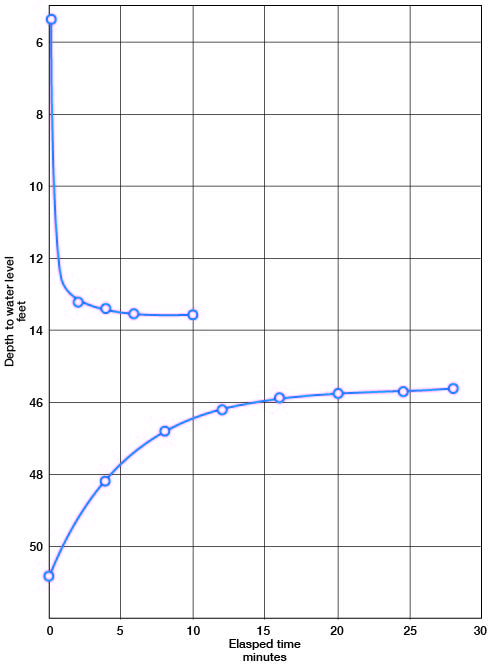
The specific capacity of a well is its rate of yield per unit of drawdown, and it is generally stated in gallons a minute per foot of drawdown after a specified period of pumping. When a well is pumped the water level drops rap-idly at first and then more slowly, and it may continue to decline until a balance is established between recharge and pumping. In testing the specific capacity of a well, therefore, it is important to continue pumping until the water level remains approximately stationary. When the pump is stopped the water level rises rapidly at first, then more slowly, and may continue to rise long after pumping has ceased (Fig. 9).
Fig. 9--Drawdown curve of city well at Lenora, and recovery curve of a city well at Norton. All measurements were made by steel tape during the field season of 1945.
The character and thickness of the water-bearing materials have a definite. bearing on the yield and drawdown of a well and hence on its specific capacity. Drawdown increases the height that water must be lifted in pumping, thus increasing the cost of pumping. If the water-bearing material is coarse and of fairly uniform size it will readily yield large quantities of water to a well with a minimum drawdown; if the water-bearing material is fine or poorly sorted it will offer more resistance to the flow of water, thereby de-creasing the yield and increasing the drawdown. Other things being equal, the drawdown of a well varies inversely with the permeability of the water-bearing material.
Types of wells
Dug wells--Dug wells are excavated with picks, shovels, spades, or power machinery. They generally are between 2 and 10 feet in diameter and are quite shallow. Many of the early wells in this area were dug by hand, but many of these have since been replaced by drilled wells. A few dug wells now are in use in the major valleys. Of the 285 wells listed in Table 8 only 28 are dug wells, 10 are bored wells, and 247 are drilled wells.
Bored and driven wells--Bored wells are made by augers or posthole diggers. Some wells are bored to the water-bearing formation, and a well point is then driven into the sand or gravel from which the water is obtained. In some shallow-water areas well points are driven from the surface without recourse to boring. These are called driven wells. Bored and driven wells, are in use in the valley areas and at some places on the uplands.
Drilled wells--A drilled well is one that is excavated by means of a percussion or rotary drill. Many of the wells in Norton County and northwestern Phillips County are drilled wells. The drilled domestic and stock wells generally are 6 inches in diameter and those used for irrigation and public supply purposes generally are 14 to 18 inches in diameter.
All the wells in this area, with the exception of the few deep wells penetrating Cretaceous rocks, obtain water from relatively unconsolidated deposits. Wells in such deposits generally are cased nearly to the bottom of the hole with galvanized or wrought-iron casing. In some wells the water may enter only through the open end of the casing, but to provide greater intake facilities a strainer or well screen may be used or the casing may be perforated below the water table. The size of the perforations is an important factor in the construction of a well and the capacity or even the life of the well may be determined by it. If the perforations are too large the fine material may filter through and fill the well; if the perforations are too small they may become clogged so that water is prevented from entering the well freely.
Some wells in unconsolidated sediments are equipped with well screens. It is good practice to select a slot size that will pass 30 to 60 percent of the water-bearing material, depending on the texture and degree of sorting. The coarser particles that remain around the screen form a natural gravel pack which increases the effective diameter and therefore the capacity of the well.
Gravel-wall wells generally are effective for obtaining large supplies of water from relatively fine-grained unconsolidated deposits and have been used for public supply and irrigation. In such wells a large-diameter hole is first drilled with a rotary drill or excavated by a hoist and orange-peel bucket and temporarily cased with unperforated casing. A well screen or perforated casing is then centered in the hole opposite the water-bearing material and enough blank casing added to reach the surface. The space between the two casings is filled with carefully screened gravel and all but 20 or 30 feet of the outer casing is pulled from the hole. A packing of a well-sorted medium to coarse gravel generally gives the best results, but where the water-bearing material is extremely fine a coarse sand or fine gravel may be preferred. The slots in the screen or casing should be as large as possible without permitting entry of the gravel used for packing the well. If the water-bearing formation consists of well-sorted coarse gravel the capacity of the well probably will not be increased by addition of a gravel pack around the screen.
McCall and Davison (1939, p. 29) state that drawdown can be kept at a minimum in several ways:
First, the well should be put down through all valuable water-bearing material. Secondly, the casing should be properly perforated so as to admit water to the well as rapidly as the surrounding gravel will yield the water. Third, the well should be completely developed so that the water will flow freely into the well. . . . Increasing the depth of a well will have a greater effect on reducing the drawdown than will increasing the diameter, so long as additional water-bearing formations are encountered.
A report (Davison, 1939) containing descriptions of different types of pumping plants, the conditions for which each is best suited, construction methods, and a discussion of construction costs is available from the Division of Water Resources, Kansas State Board of Agriculture, Topeka, Kansas, and the reader is referred to this publication for additional details of well construction.
Methods of lift and types of pumps
Water from many of the domestic and stock wells in this area is obtained by wind-mill-operated lift or force pumps. The cylinders or working barrels in both lift pumps and force pumps are similar and are located below the land surface, either above or below the water surface, but a lift pump is capable of discharging water only at the pump head, whereas a force pump can raise water above this point--such as to an elevated tank. Pitcher pumps are used on some dug or bored wells in the shallow-water areas of the major valleys. Most of the pitcher pumps and a few of the lift and force pumps are hand-operated.
Several types of power-driven pumps are in use in the irrigation and city wells. For the most part these are turbine pumps and are powered by electric motors, stationary gasoline engines, and tractor engines. Data concerning such wells are given in Table 8.
Utilization
During the course of this investigation data on 241 wells in Norton County and 44 wells in northwestern Phillips County were obtained. All types of wells in all parts of the area were visited. Of the 285 wells listed in Table 8, 86 were used for stock water, 46 for domestic supplies, and 101 for both purposes. Of the remaining wells, 14 were used for public supply and 17 for irrigation; 21 were not in use at the time they were visited. Although Table 8 includes only part of the domestic and stock wells in the area, all the public supply and irrigation wells that could be located during the course of the field work were visited and are listed in the table.
Domestic and stock supplies
Nearly all the domestic supplies and many of the stock supplies in rural areas are obtained from wells. In parts of Norton County ponds are used to some extent to supply stock water. The domestic use of water generally includes drinking, cooking, washing, and in some cases the disposal of sewage. In this area, the ground water generally is satisfactory for all domestic purposes (see Quality of Water), and can be obtained in sufficient quantities for such uses at nearly any locality.
Public supplies
Four municipalities in Norton County and one in northwestern Phillips County have public water supplies obtained from wells.
Almena--The City of Almena, located in the Prairie Dog Creek Valley in northeastern Norton County, obtains its water supply from two wells (2-21-8ca and 2-21-8dc) drilled into sand and gravel deposits underlying the prominent Almena terrace surface. Water is pumped from these wells to a steel standpipe located on the bluffs of Prairie Dog Creek Valley on the south side of the city. The storage tank has a reported capacity of 90,000 gallons. Each of the two wells is pumped with a turbine pump powered by an electric motor; they have rated capacities of 150 and 250 gallons per minute. The reported maximum daily capacity of the system is 72,000 gallons but the average daily consumption is not known. Data on the wells are given in Table 8 and a chemical analysis is given in Table 5. The water is of good quality and is not treated.
Clayton--The City of Clayton, located at the western edge of Norton County in the Prairie Dog Creek Valley, obtains its water supply from one well (4-25-6ab) drilled into the terrace deposits. Water is pumped from this well into a concrete storage tank on the southeast side of town, which provides capacity for 50,000 gallons. The maximum daily use of water in Clayton is reported to be 9,000 gallons and the annual use is reported to be about 300,000 gallons. Data on the well are given in Table 8 and a chemical analysis of the water is given in Table 5. The water is of good quality and is not treated.
Lenora--The City of Lenora, located in the valley of North Solomon River in southwestern Norton County, obtains its water supply from one well (5-24-14eb) drilled in the alluvium of North Fork Solomon River. The water is pumped with a 4-inch centrifugal pump powered by an electric motor and a standby pump powered with a gasoline engine is provided in the well house. Water is pumped from the well to an elevated standpipe with a reported storage capacity of 50,000 gallons. Data on the well are given in Table 8 and a chemical analysis of the water is given in Table 5. The water is of good quality and is not treated.
Long Island--The City of Long Island, located in northwestern Phillips County in the Valley of Prairie Dog Creek, obtains its water supply from two wells (1-20-23da1 and 1-20-23da2) drilled into the deposits underlying the prominent terrace surface. Water is pumped from the wells to an elevated steel storage tank with a reported capacity of 30,000 gallons in the northern part of town. Reported maximum daily use is 26,000 gallons, and 4,900,000 gallons was used from June 1, 1946, to June 1, 1947. Data on the wells are given in Table 8 and a chemical analysis of the water is given in Table 5. The water is of good quality and is not treated.
Norton--Norton, the county seat of Norton County and largest city in the area covered by this report, obtains its water supply from six wells drilled into the deposits underlying the dominant terrace level along Prairie Dog Creek Valley. Each of the six wells is pumped with a turbine pump powered by electricity and has a rated capacity of 250 gallons per minute. Water is pumped from the wells into a collecting reservoir with a capacity of 360,000 gallons located near the municipal power plant. The water from the collecting reservoir is pumped to the city distribution system by three high-service pumps having a combined capacity of approximately 1,400 gallons per minute. An elevated storage tank with a capacity of 250,000 gallons is located in the northwestern part of the city. The annual pumpage of water by the city generally exceeds 100,000,000 gallons and the largest pumpage recorded is for 1946 when 181,474,600 gallons of water was pumped. Pumpage data for the period 1930 through 1947 are given in Table 4. The rated daily capacity of the system is 1,730,000 gallons. Data on the wells are given in Table 8 and a chemical analysis of the water is given in Table 5. The water is of good quality and is not treated.
Table 4--Annual pumpage of water by the city of Norton, 1930-47 (Data furnished by Lloyd Johnson, City Engineer).
| Year | Water pumped (millions of gallons) |
|---|---|
| 1930 | 135 |
| 1935 | 131 |
| 1940 | 116 |
| 1941 | 104 |
| 1942 | 89 |
| 1943 | 136 |
| 1944 | 115 |
| 1945 | 121 |
| 1946 | 181 |
| 1947 | 168 |
Irrigation supplies
A relatively small amount of water has been pumped for irrigation use in Norton County and northwestern Phillips County. The Division of Water Resources of the Kansas State Board of Agriculture lists 575 acres under irrigation in Norton County in 1943. For the most part irrigation has been by well water, but in a few places some water has been pumped from major stream channels for irrigation purposes. At the time field work was in progress for this investigation, irrigation was restricted to the terrace surfaces along three major valleys of the area studied. Seventeen irrigation wells were visited, and data concerning them are given in Table 8. Chemical analyses of the water obtained from several of these wells are given in Tables 5 and 6. The yields of the irrigation wells visited vary widely, but several of them have reported yields well in excess of 1,000 gallons per minute.
The quantity of water available for possible future irrigation supplies varies widely throughout this area. The terrace deposits along the three major valleys present the most adequate source of ground water for irrigation. Also, the water table is relatively near the surface and is uniform in slope under these generally flat terrace surfaces. The water-table contours on Plate 2 show that water is moving from the divide areas into the deposits underlying the terrace surfaces, so that these deposits are supplied with ground water not only from recharge by precipitation on their surfaces but also from recharge that occurs in the broad divide areas. Furthermore, the stream channels of the three major valleys are essentially at water-table level; therefore, in areas where local cones of depression are developed which might lower the level of the water table below the stream channel some additional recharge might be obtained by water entering the ground from the stream channels. Owing to the lenticular nature of the alluvial deposits underlying the major terraces, however, it is advisable to drill test holes to determine the amount of saturated sand and gravel at any locality before. an irrigation well is constructed there.
The area underlain by the Crete sand and gravel member of the Sanborn formation, generally along the north side of Prairie Dog Creek Valley, probably represents the second most likely source of irrigation water. Here water generally moves from the divide area on the north and aids in the replenishment of the supply in these sands and gravels. However, the Crete sand and gravel has been dissected by many tributaries, and the bedrock floor below the sand and gravel deposits is somewhat uneven. For these reasons the quantity of water available in this area varies widely, and careful test drilling should be done before any irrigation well is constructed.
A third area in which quantities of water adequate for irrigation purposes might be obtained is the upland divide area between Sappa and Prairie Dog Creeks in northwestern Norton County. The cross sections in Plate 3 show a relatively great thickness of saturated sand and gravel underlying this divide, with the water table generally at a depth of more than 100 feet below the surface. However, only relatively meager subsurface data on this area are available and special caution should be used in planning any irrigation in this area.
It is unlikely that the Ogallala formation, except in northwestern Norton County, will yield adequate supplies of water to wells for extensive irrigation. Future test drilling, however, may reveal other small areas of the Ogallala formation where large supplies of water may be obtained. In the parts of the two counties where saturated deposits of Tertiary and Quaternary age do not generally occur and where the existing water wells draw upon supplies in the Cretaceous rocks, it is quite unlikely that adequate supplies of water for irrigation can be obtained.
For data concerning cost of pumping water for irrigation and construction of irrigation pumping plants the reader is referred to reports prepared by the Kansas State Board of Agriculture (Davison, 1939; McCall and Davison, 1939).
Quality
The chemical character of ground water in Norton County and northwestern Phillips County is indicated by the analyses in Tables 5 and 6, and in Figures 10 and 11. The analyses were made by Howard Stoltenberg in the Water and Sewage Laboratory of the Kansas State Board of Health and by the Quality of Water Branch of the Federal Geological Survey. Samples of water were collected for chemical analysis from 45 representative wells, distributed as uniformly as possible within Norton County, but concentrated in the Prairie Dog Creek Valley of Phillips County. The water samples are representative of all the water-bearing formations of the area. Analyses of the water pumped from several municipal wells are also given in Table 5.
Fig. 10--Analyses of water from the principal water-bearing formations in Norton County. The various constituents are shown by patterns and the number refers to the number of the well in this report.
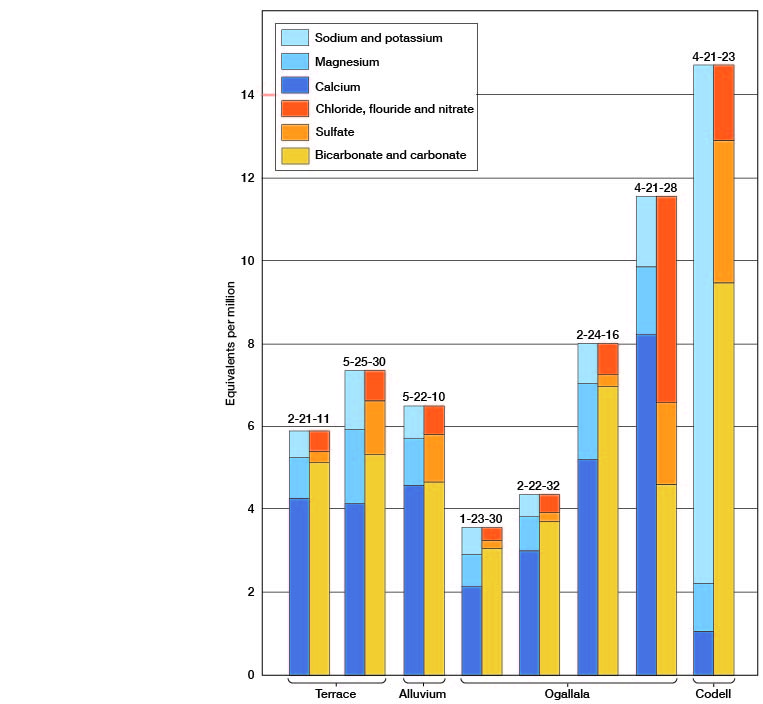
Fig. 11--Analyses of water from the principal water-bearing formations in eastern Norton County and northwestern Phillips County. The various constituents are shown by patterns and the number refers to the number of the well in this report.
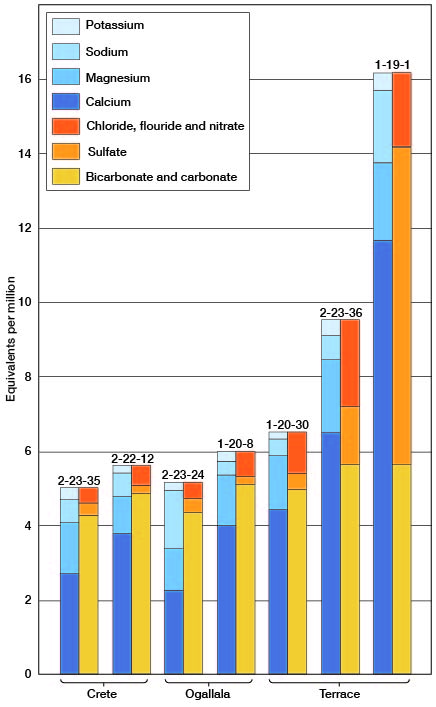
Table 5--Analyses of water from typical wells in Norton County, Kansas. Analyzed by H. A. Stoltenberg. Dissolved constituents given in parts per milliona, and in equivalents per millionb (in italics).
| No. on Plate 2 |
Location | Depth (feet) |
Geologic source |
Date of collection, 1946 |
Temp. (°F) |
Dissolved solids |
Silica (SiO2) |
Iron (Fe) |
Calcium (Ca) |
Magnesium (Mg) |
Sodium and potassium (Na+K) |
Bicarbonate (HCO3) |
Sulfate (SO4) |
Chloride (Cl) |
Fluoride (F) |
Nitrate (NO3) |
Hardness as CaCO3 | ||
|---|---|---|---|---|---|---|---|---|---|---|---|---|---|---|---|---|---|---|---|
| Total | Carbonate | Non- carbonate |
|||||||||||||||||
| 1-20-23da | Long Island City well (Phillips County) |
46 | Terrace | Jan. 18(c) | 880 | 40 | 0.08 | 173 8.63 |
36 2.96 |
65 2.81 |
515 8.45 |
118 2.45 |
78 2.2 |
0.1 0.01 |
80 1.29 |
580 | 422 | 158 | |
| T. 1 S., R. 21 W. | |||||||||||||||||||
| 1-21-16dd | SE SE sec. 16 | 55.2 | Ogallala | June 27 | 56 | 323 | 32 | 0.57 | 80 3.99 |
16 1.32 |
12 0.53 |
307 5.03 |
9.9 0.21 |
19 0.54 |
0.4 0.02 |
2.7 0.04 |
266 | 252 | 14 |
| T. 1 S., R. 22 W. | |||||||||||||||||||
| 1-22-14ba | NE NW sec. 14 | 67.4 | Ogallala | April 3 | 54 | 286 | 39 | 2.7 | 67 3.34 |
15 1.23 |
10 0.45 |
279 4.58 |
9.5 0.2 |
7 0.2 |
0.4 0.02 |
1.3 0.02 |
228 | 228 | 0 |
| T. 1 S., R. 23 W. | |||||||||||||||||||
| 1-23-7da | NE SE sec. 7 | 108.2 | Ogallala | April 4 | 56 | 311 | 28 | 18 | 84 4.19 |
12 0.99 |
12 0.53 |
328 5.38 |
3.7 0.08 |
8 0.22 |
0.3 0.02 |
0.88 0.01 |
259 | 259 | 0 |
| 1-23-26aa | NE NE sec. 26 | 143 | Ogallala | April 3 | 55.5 | 285 | 48 | 0.66 | 62 3.09 |
15 1.23 |
11 0.49 |
270 4.43 |
8.6 0.18 |
5 0.14 |
0.5 0.03 |
1.8 0.03 |
216 | 216 | 0 |
| 1-23-30aa | NE NE sec. 30 | 109.2 | Ogallala | April 4 | 54 | 196 | 18 | 31 | 43 2.14 |
9.3 0.76 |
15 0.65 |
189 3.1 |
9.1 0.19 |
8 0.22 |
0.7 0.04 |
0 0 |
145 | 145 | 0 |
| T. 1 S., R. 25 W. | |||||||||||||||||||
| 1-25-19aa | NE NE sec. 19 | 50.8 | Ogallala | June 24 | 58 | 296 | 41 | 3.4 | 62 3.09 |
17 1.4 |
15 0.65 |
282 4.62 |
10 0.21 |
7 0.2 |
0.6 0.03 |
4.9 0.08 |
224 | 224 | 0 |
| 1-25-24cc | SW SW sec. 24 | 95.6 | Ogallala | June 24 | 57 | 282 | 45 | 0.33 | 61 3.04 |
16 1.82 |
9.9 0.43 |
266 4.36 |
5.3 0.11 |
6 0.17 |
0.3 0.02 |
8 0.13 |
218 | 218 | 0 |
| T. 2 S., R. 21 W. | |||||||||||||||||||
| 2-21-8 | Almena City wells | 64 | Terrace | Nov. 20 | 456 | 40 | 0.06 | 104 5.19 |
19 1.56 |
26 1.14 |
436 7.15 |
15 0.31 |
13 0.37 |
0.3 0.02 |
2.2 0.04 |
338 | 338 | 0 | |
| 2-21-11aa | NE NE sec. 11 | 82 | Terrace | April 5 | 56 | 338 | 39 | 0.1 | 86 4.29 |
12 0.99 |
14 0.59 |
314 5.15 |
12 0.25 |
11 0.31 |
0.3 0.02 |
8.4 0.14 |
264 | 258 | 6 |
| T. 2 S., R. 22 W. | |||||||||||||||||||
| 2-22-9dc | SW SE sec. 9 | 93.3 | Ogallala | June 27 | 58 | 333 | 40 | 0.1 | 78 3.89 |
14 1.15 |
15 0.66 |
283 4.64 |
14 0.29 |
19 0.54 |
0.3 0.02 |
13 0.21 |
252 | 232 | 20 |
| 2-22-32bd | SE NW sec. 32 | 47.2 | Terrace | April 3 | 55 | 442 | 35 | 7.7 | 101 5.04 |
22 1.81 |
29 1.26 |
439 7.2 |
26 0.54 |
12 0.34 |
0.3 0.02 |
0.44 0.01 |
342 | 342 | 0 |
| T. 2 S., R. 24 W. | |||||||||||||||||||
| 2-24-16dc | SW SE sec. 16 | 148.5 | Ogallala | June 24 | 56 | 454 | 42 | 0.03 | 105 5.24 |
22 1.81 |
22 0.95 |
428 7.02 |
12 0.25 |
6 0.17 |
0.2 0.01 |
34 0.55 |
352 | 351 | 1 |
| T. 2 S., R. 25 W. | |||||||||||||||||||
| 2-25-27ba | NE NW sec. 27 | 148 | Ogallala | June 27 | 57 | 278 | 41 | 0.75 | 53 2.64 |
19 1.56 |
14 0.63 |
266 4.36 |
6.2 0.13 |
9 0.25 |
0.4 0.02 |
4.4 0.07 |
210 | 210 | 0 |
| T. 3 S., R. 21 W. | |||||||||||||||||||
| 3-21-2dd | SE SE sec. 21 | 96.5 | Ogallala | April 4 | 56 | 263 | 31 | 8 | 64 3.19 |
14 1.15 |
6.7 0.29 |
254 4.16 |
9.5 0.2 |
5 0.14 |
0.4 0.02 |
7.1 0.11 |
217 | 208 | 9 |
| 3-21-27cc | SW SW sec. 27 | 40.1 | Alluvium | June 27 | 56 | 306 | 34 | 1.2 | 70 3.49 |
17 1.4 |
13 0.55 |
295 4.84 |
9.9 0.21 |
9 0.25 |
0.5 0.03 |
7.1 0.11 |
244 | 242 | 2 |
| T. 3 S., R. 22 W. | |||||||||||||||||||
| 3-22-9bb | NW NW sec. 9 | 70.2 | Ogallala | April 4 | 56 | 259 | 27 | 4.9 | 69 3.44 |
10 0.82 |
8.3 0.36 |
259 4.25 |
7 0.14 |
6 0.17 |
0.2 0.01 |
3.3 0.05 |
213 | 212 | 1 |
| T. 3 S., R. 23 W. | |||||||||||||||||||
| 3-23-3 | Norton City wells | 58-70 | Terrace and alluvium | Feb. 11 | 614 | 31 | 0.48 | 136 6.79 |
24 1.97 |
30 1.3 |
410 6.72 |
120 2.5 |
27 0.76 |
0.3 0.02 |
3.5 0.06 |
438 | 336 | 102 | |
| 3-23-27ba | NE NW sec. 27 | 153.3 | Ogallala | June 26 | 57 | 266 | 41 | 1.7 | 61 3.04 |
10 0.82 |
12 0.51 |
207 3.39 |
17 0.35 |
20 0.56 |
0.5 0.03 |
2.7 0.04 |
193 | 170 | 23 |
| T. 3 S., R. 25 W. | |||||||||||||||||||
| 3-25-27ad | SE NE sec. 27 | 34.1 | Terrace | June 27 | 56 | 395 | 41 | 0.73 | 86 4.29 |
19 1.56 |
27 1.16 |
371 6.08 |
20 0.42 |
16 0.45 |
0.4 0.02 |
2.2 0.04 |
292 | 292 | 0 |
| T. 4 S., R. 21 W. | |||||||||||||||||||
| 4-21-23cd | SE SW sec. 23 | 364.2 | Codell | June 27 | 59 | 852 | 12 | 0.88 | 21 1.05 |
15 1.23 |
289 12.56 |
578 9.48 |
165 3.43 |
58 1.64 |
5 0.26 |
2.1 0.03 |
114 | 114 | 0 |
| 4-21-28ba | NE NW sec. 28 | 45.3 | Ogallala | April 4 | 54 | 722 | 33 | 0.64 | 165 8.23 |
20 1.64 |
40 1.73 |
277 4.54 |
96 2.00 |
108 3.04 |
0.3 0.02 |
124 2.00 |
494 | 227 | 267 |
| T. 4 S., R. 22 W. | |||||||||||||||||||
| 4-22-29da | NE SE sec. 29 | 109 | Ogallala | April 4 | 56 | 284 | 35 | 2.1 | 67 3.34 |
14 1.15 |
12 0.53 |
279 4.58 |
9.5 0.2 |
6 0.17 |
0.4 0.02 |
3 0.05 |
224 | 224 | 0 |
| T. 4 S., R. 23 W. | |||||||||||||||||||
| 4-23-1ac | SW NE sec. 1 | 74 | Ogallala | April 4 | 55 | 338 | 31 | 13 | 94 4.69 |
12 0.99 |
6.7 0.29 |
315 5.17 |
16 0.33 |
8 0.22 |
0.2 0.01 |
15 0.24 |
284 | 258 | 26 |
| 4-23-19dc | SW SE sec. 19 | 145.3 | Ogallala | June 26 | 57 | 294 | 33 | 4.4 | 73 3.64 |
15 1.23 |
7.6 0.83 |
282 4.62 |
9.9 0.21 |
7.5 0.21 |
0.4 0.02 |
8.8 0.14 |
244 | 231 | 13 |
| T. 4 S., R. 24 W. | |||||||||||||||||||
| 4-24-31ac | SE NE sec. 31 | 30.6 | Alluvium | June 26 | 55 | 266 | 36 | 0.66 | 60 2.99 |
15 1.23 |
10 0.45 |
261 4.28 |
4.9 0.1 |
6.5 0.18 |
0.5 0.08 |
4.9 0.08 |
211 | 211 | 0 |
| T. 4 S., R. 25 W. | |||||||||||||||||||
| 4-25-6ab | Clayton City well | 51 | Terrace | July 5 | 434 | 37 | 0 | 90 4.49 |
22 1.81 |
27 1.16 |
377 6.18 |
28 0.58 |
21 0.59 |
0.3 0.02 |
5.3 0.09 |
315 | 309 | 6 | |
| 4-25-7da | NE SE sec. 7 | 120 | Ogallala | June 27 | 57 | 285 | 34 | 1.3 | 67 3.34 |
15 1.23 |
9.2 0.4 |
259 4.25 |
12 0.25 |
11 0.31 |
0.3 0.02 |
8.8 0.14 |
228 | 212 | 16 |
| T. 5 S., R. 21 W. | |||||||||||||||||||
| 5-21-16ba | NE NW sec. 16 | 309.5 | Niobrara and Codell | June 25 | 58 | 384 | 9.2 | 4.6 | 12 0.6 |
9.2 0.76 |
129 5.6 |
340 5.58 |
40 0.83 |
12 0.34 |
3.4 0.18 |
1.9 0.03 |
68 | 68 | 0 |
| T. 5 S., R. 22 W. | |||||||||||||||||||
| 5-22-10dd | SE SE sec. 10 | 34.9 | Alluvium | June 26 | 58 | 397 | 45 | 0.23 | 92 4.59 |
14 1.15 |
17 0.75 |
281 4.61 |
58 1.21 |
11 0.31 |
0.4 0.02 |
21 0.34 |
287 | 230 | 57 |
| 5-22-32da | NE SE sec. 32 | 117 | Ogallala | June 26 | 58 | 260 | 36 | 0.97 | 61 3.04 |
10 0.82 |
12 0.51 |
227 3.72 |
11 0.23 |
10 0.28 |
0.2 0.01 |
8 0.13 |
193 | 186 | 7 |
| T. 5 S., R. 24 W. | |||||||||||||||||||
| 5-24-14cb | Lenora City well | 29 | Alluvium | March 23 | 719 | 24 | 0 | 138 6.89 |
27 2.22 |
44 1.91 |
393 6.45 |
119 2.48 |
51 1.44 |
0.4 0.02 |
39 0.63 |
456 | 322 | 134 | |
| 5-24-20bc | SW NW sec. 20 | 43.1 | Terrace | April 4 | 56 | 449 | 45 | 0.4 | 124 6.19 |
19 1.56 |
6.7 0.29 |
439 7.2 |
14 0.29 |
11 0.31 |
0.5 0.08 |
13 0.21 |
388 | 360 | 28 |
| 5-24-24bc | SW NW sec. 24 | 53 | Terrace | June 26 | 55 | 427 | 35 | 0 | 105 5.24 |
22 1.81 |
16 0.71 |
409 6.71 |
21 0.44 |
14 0.39 |
0.5 0.03 |
12 0.19 |
352 | 336 | 16 |
| T. 5 S., R. 25 W. | |||||||||||||||||||
| 5-25-30dd | SE SE sec. 30 | 33.4 | Terrace | June 26 | 55 | 420 | 32 | 0 | 84 4.19 |
21 1.73 |
33 1.45 |
328 5.38 |
61 1.27 |
22 0.62 |
0.6 0.03 |
4.4 0.07 |
296 | 269 | 27 |
| a. One part per million is equivalent to one pound of substance per million pounds of water or 8.33 pounds per million gallons of water. | |||||||||||||||||||
| b. An equivalent per million is a unit chemical equivalent weight of solute per million unit weights of solution. Concentration in equivalents per million is calculated by dividing the concentration in parts per million by the chemical combining weight of the substance or ion. | |||||||||||||||||||
| c. 1947. | |||||||||||||||||||
Table 6--Analyses of water from typical wells in Almena Unit area, Norton and Phillips counties, Kansas. Analyzed by Quality of Water Branch, Feneral Geological Survey, Lincoln, Nebraska. Dissolved constituents given in parts per milliona, and in equivalents per millionb (in italics).
| No. on Plate 2 |
Location | Depth (feet) |
Geologic source |
Date of collection, 1947 |
Temp. (°F) |
Dissolved solids |
Silica (SiO2) |
Iron (Fe) |
Calcium (Ca) |
Magnesium (Mg) |
Sodium (Na) |
Potassium (K) |
Bicarbonate (HCO3) |
Sulfate (SO4) |
Chloride (Cl) |
Fluoride (F) |
Nitrate (NO3) |
Boron (B) |
Percent sodium |
Hardness as CaCO3 | U.S.G.S. lab sample no. |
||
|---|---|---|---|---|---|---|---|---|---|---|---|---|---|---|---|---|---|---|---|---|---|---|---|
| Total | Carbonate | Non- carbonate |
|||||||||||||||||||||
| T. 1 S., R. 19 W. | |||||||||||||||||||||||
| 1-19-1db | NW SE sec. 1 | 46.7 | Terrace | Dec. 18 | 55 | 1,020 | 42 | 0.1 | 234 11.68 |
25 2.06 |
44 1.9 |
17 0.44 |
353 5.78 |
402 8.37 |
48 1.35 |
0.3 0.02 |
35 0.56 |
0.07 | 1 | 687 | 289 | 398 | 3406 |
| 1-19-8cb | NW SW sec. 8 | 53.4 | Terrace | Dec. 19 | 55 | 864 | 53 | 0.05 | 160 7.98 |
42 3.45 |
46 2.02 |
25 0.64 |
497 8.14 |
118 2.46 |
60 1.69 |
0.15 0.01 |
111 1.79 |
0.09 | 14 | 572 | 408 | 164 | 3407 |
| 1-19-9cb | NW SW sec. 9 | 43 | Terrace | Dec. 18 | 55 | 1,030 | 40 | 0.1 | 202 10.08 |
39 3.21 |
71 3.07 |
20 0.51 |
512 8.39 |
242 5.04 |
70 1.97 |
0.3 0.02 |
90 1.45 |
0.12 | 18 | 664 | 419 | 245 | 3409 |
| 1-19-20dd | SE SE sec. 20 | 41.8 | Alluvium | Dec. 19 | 56 | 1,880 | 25 | 0.1 | 378 18.86 |
67 5.51 |
41 1.79 |
32 0.82 |
269 4.41 |
272 5.66 |
160 4.51 |
0.2 0.01 |
768 12.39 |
0.09 | 7 | 1,220 | 222 | 998 | 3411 |
| T. 1 S., R. 20 W. | |||||||||||||||||||||||
| 1-20-8dd | SE SE sec. 8 | 97 | Ogallala | Dec. 18 | 56 | 342 | 45 | 0.08 | 82 4.09 |
16 1.32 |
8.5 0.37 |
8.1 0.21 |
317 5.2 |
9.7 0.2 |
12 0.34 |
0.2 0.01 |
15 0.24 |
0 | 6 | 270 | 260 | 10 | 3401 |
| 1-20-11dc | SW SE sec. 11 | 70.2 | Ogallala | Dec. 18 | 55 | 297 | 43 | 0.04 | 69 3.443 |
12 0.987 |
12 0.541 |
5.7 0.146 |
270 4.43 |
14 0.291 |
11 0.31 |
0.4 0.021 |
4 0.065 |
0.02 | 11 | 222 | 222 | 0 | 3402 |
| 1-20-30dd | SE SE sec. 30 | 45.4 | Terrace | Dec. 17 | 56 | 393 | 40 | 0.02 | 91 4.54 |
17 1.4 |
9.9 0.43 |
7.8 0.2 |
310 5.09 |
19 0.4 |
18 0.51 |
0.2 0.01 |
35 0.56 |
0.05 | 6 | 297 | 255 | 42 | 3412 |
| 1-20-32ad | SE NE sec. 32 | 50 | Terrace | Dec. 17 | 55 | 682 | 26 | 0.05 | 138 6.89 |
45 3.7 |
23 1.01 |
18 0.46 |
498 8.17 |
148 3.08 |
28 0.79 |
0.1 0 |
1 0.02 |
0.18 | 8 | 530 | 409 | 121 | 3405 |
| T. 2 S., R. 20 W. | |||||||||||||||||||||||
| 2-20-1ab | NW, NE, sec. 1 | 32 | Ogallala | Dec. 18 | 55 | 298 | 51 | 0.02 | 71 3.543 |
12 0.987 |
8.3 0.36 |
5.5 0.141 |
265 4.343 |
9 0.187 |
16 0.451 |
0.5 0.026 |
1.5 0.024 |
0 | 7 | 226 | 216.6 | 9.4 | 3413 |
| 2-20-5da | NE SE sec. 5 | 46 | Ogallala | Dec. 17 | 55 | 500 | 40 | 0.05 | 123 6.14 |
16 1.32 |
12 0.5 |
8.7 0.22 |
328 5.38 |
50 1.04 |
45 1.27 |
0.15 0.01 |
30 0.48 |
0 | 6 | 373 | 269 | 104 | 3403 |
| T. 2 S., R. 21 W. | |||||||||||||||||||||||
| 2-21-30cb | NW SW sec. 30 | 71.7 | Terrace | Dec. 17 | 56 | 309 | 55 | 0.12 | 75 3.743 |
13 1.069 |
13 0.559 |
4.8 0.123 |
302 4.949 |
8 0.167 |
12 0.338 |
0.3 0.016 |
1.5 0.024 |
0 | 10 | 241 | 241 | 0 | 3400 |
| T. 2 S., R. 22 W. | |||||||||||||||||||||||
| 2-22-12ab | NW NE sec. 12 | 110 | Crete | Dec. 17 | 55 | 327 | 44 | 0.02 | 76 3.792 |
12 0.987 |
16 0.685 |
6.6 0.169 |
298 4.897 |
11 0.229 |
13 0.867 |
0.2 0.011 |
8 0.129 |
0.06 | 12 | 239 | 239 | 0 | 3410 |
| T. 2 S., R. 23 W. | |||||||||||||||||||||||
| 2-23-24da | NE SE sec. 24 | 66.5 | Ogallala | Dec. 15 | 56 | 302 | 54 | 0.04 | 47 2.345 |
13 1.069 |
35 1.536 |
8.6 0.22 |
273 4.474 |
15 0.312 |
10 0.282 |
0.4 0.021 |
5 0.081 |
0 | 30 | 171 | 171 | 0 | 3408 |
| 2-23-35bb | NW NW sec. 35 | 113 | Crete | Dec. 15 | 60 | 274 | 42 | 0.08 | 55 2.745 |
16 1.316 |
14 0.63 |
11 0.281 |
262 4.294 |
14 0.291 |
11 0.31 |
0.7 0.037 |
2.5 0.04 |
0 | 13 | 203 | 203 | 0 | 3404 |
| 2-23-36cc | SW SW sec. 36 | 60 | Terrace | Dec. 19 | 55 | 586 | 36 | 0.02 | 131 6.54 |
23 1.89 |
15 0.66 |
16 0.41 |
349 5.72 |
72 1.5 |
47 1.33 |
0.2 0.01 |
60 0.94 |
0 | 7 | 422 | 286 | 136 | 3414 |
| a. One part per million is equivalent to one pound of substance per million pounds of water or 8.33 pounds per million gallons of water. | |||||||||||||||||||||||
| b. An equivalent per million is a unit chemical equivalent weight of solute per million unit weights of solution. Concentration in equivalents per million is calculated by dividing the concentration in parts per million by the chemical combining weight of the substance or ion. | |||||||||||||||||||||||
Chemical constituents in relation to use
The following discussion of the chemical constituents of ground water has been adapted from publications of the United States Geological Survey and the State Geological Survey of Kansas.
Dissolved solids--The residue left after a natural water has evaporated consists of mineral matter, with which may be included some organic materials and a small amount of water of crystallization. Water containing less than 500 parts per million of dissolved solids generally is entirely satisfactory for domestic use, except for difficulties resulting from its hardness, and, in some areas, its excessive iron content. Water having more than 1,000 parts per million of dissolved solids is likely to contain enough of certain constituents to produce a noticeable taste or to make the water unsuitable in other respects.
The dissolved solids in samples of water collected from private wells in this area ranged from 196 to 1,880 parts per million. Water from 3 of the 45 wells sampled contained more than 1,000 parts per million of dissolved solids, and that from 8 other wells, between 500 and 1,000 parts per million. The average content for all waters analyzed is 440 parts per million, and only one sample showed less than 250 parts per million.
Hardness--The hardness of water, which is the property that generally receives the most attention, is commonly recognized by its effect when soap is used with the water; it produces a curd-like scum. Calcium and magnesium cause nearly all the hardness in most water. These constituents are also the active agents in the formation of the greater part of all the scale found in steam boilers and in other vessels in which water is heated or evaporated.
In addition to total hardness, the analyses indicate the carbonate hardness and the noncarbonate hardness of water. The carbonate hardness is that due to the presence of calcium and magnesium bicarbonate, and it is largely removed by boiling. In some reports this type of hardness has been called temporary hardness. The noncarbonate hardness is due to the presence of sulfates or chlorides of calcium and magnesium, which cannot be removed by boiling, and has sometimes been called permanent hardness. With reference to use with soap, there is no difference between the carbonate and noncarbonate hardness. In general, the noncarbonate hardness forms a harder adhering scale in steam boilers.
Water having hardness of less than 50 parts per million is generally rated as soft, and its treatment for removal of hardness under ordinary circumstances is not necessary. Hardness between 50 and 150 parts per million does not seriously interfere with the use of water for most purposes, but it does slightly increase the consumption of soap; its removal by a softening process is profitable for laundries or other industries using large quantities of soap. Water in the upper part of this range of hardness will cause considerable scale in steam boilers. Hardness exceeding 150 parts per million can be noticed by anyone; if the hardness is 200 or 300 parts per million it is common practice to soften water for household use or to install a cistern to collect soft rain water. Where municipal water supplies are softened, an attempt is generally made to reduce the hardness to about 60 parts per million. The additional improvement from further softening of an entire public supply is deemed not worth the increase in cost.
The hardness of water samples collected from wells in this area ranged from 68 to 1,220 parts per million and averaged 308 parts per million. Of the 45 samples, 3 have a hardness of less than 150 parts per million, 30 between 150 and 300 parts per million, and 12 more than 300 parts per million.
Iron--Next to hardness, iron is the constituent of natural waters that receives the most attention. The quantity of iron in ground waters may differ greatly from place to place, even though the waters are from the same formation. If a water contains much more than 0.3 part per million of iron, the excess may separate out as a reddish sediment. Iron, which may be present in sufficient quantity to give a disagreeable taste and to stain clothing, porcelain-ware, and cooking utensils, may be removed from most waters by simple aeration and filtration, but a few waters require the addition of lime or some other substance.
The analyses given in Tables 5 and 6 show the range in iron content of waters in the area studied to be from 0 to 31.0 parts per million and the average iron content of 45 samples to be 2.8 parts per million. Twenty-five analyses show 0.3 part per million or less, and 18 show an iron content between 0.3 and 5.0 parts per million.
Fluoride--Although quantities of fluoride are relatively small as compared with other common constituents of natural waters, it is desirable to know the amount of fluoride present in water that is likely to be used by children. Fluoride in water has been associated with the dental defect known as mottled enamel, which may appear on the teeth of children who drink water containing excessive quantities of fluoride during the period of formation of their permanent teeth. Water containing 1.5 parts per million or more of fluoride is likely to produce mottled enamel. If the water contains as much as 4 parts per million of fluoride, 90 percent of the children exposed are likely to have mottled tooth enamel, and 35 percent or more of the cases will be classed as moderate or worse (Dean, 1936). Small quantities of fluoride, not sufficient to cause mottled enamel, are likely to be beneficial by decreasing dental caries (Dean, Jay, Arnold, and Elvove, 1941).
Two samples of water collected from this area contained more than 1 part per million fluoride and 43 samples contained less than 1 part per million. The average fluoride content of the 45 samples of water analyzed is 0.53 part per million.
Nitrate--Considerable interest has been shown recently in the amount of nitrate in ground waters. A discovery was made a few years ago that an unusually large amount of nitrate in well water may cause cyanosis when the water is used in the preparation of a baby's formula. The range and average nitrate content for waters analyzed from each formation in the area covered by this report are shown in Table 7. The difference in nitrate content for the waters is great and seemingly is not related to any geologic formation. High nitrate content probably is due to the inflow of surface water around the well or to the movement of water through soil that contains more than a normal amount of nitrate. Wells near fields of alfalfa or other legumes might receive some of the nitrate which these plants have added to the soil. Shallow and poorly sealed wells allow more infiltration of surface seepage than do deeper, more tightly eased wells. Thus shallow wells in alluvium or terrace deposits and dug wells of large diameter are more likely to have water of high nitrate content.
Table 7--Range in concentration of constituents, in parts per million, in water from several stratigraphic units in Norton County and northwestern Phillips County, Kansas.
| Stratigraphic unit |
No. of analyses |
Total hardness (as CaCO3) |
Fluoride (F) |
Iron (Fe) |
Nitrate (NO3) |
Dissolved solids |
||||||||||
|---|---|---|---|---|---|---|---|---|---|---|---|---|---|---|---|---|
| Max. | Min. | Avg. | Max. | Min. | Avg. | Max. | Min. | Avg. | Max. | Min. | Avg. | Max. | Min. | Avg. | ||
| Alluvium | 4 | 1,220 | 211 | 490 | .50 | .20 | .40 | 1.20 | 0.10 | .55 | 768 | 4.9 | 200.3* | 1,880 | 266 | 712 |
| Terraces | 13 | 687 | 241 | 411 | .60 | .10 | .32 | 9.4 | 0.0 | 1.77 | 111 | 0.44 | 28.76 | 1,030 | 338 | 566 |
| Crete | 2 | 239 | 203 | 221 | .70 | .20 | .45 | .08 | .02 | .05 | 8.0 | 2.5 | 5.25 | 327 | 274 | 300 |
| Ogallala | 24 | 494 | 145 | 247 | .70 | .15 | .37 | 31.0 | .02 | 3.95 | 124 | 0.0 | 12.8 | 722 | 196 | 323 |
| Niobrara and Codell | 2 | 114 | 68 | 91 | 5.0 | 3.4 | 4.2 | 4.6 | .88 | 2.74 | 2.1 | 1.9 | 2.0 | 852 | 384 | 618 |
| Average of three samples, 21.6. | ||||||||||||||||
Although nearly all the water samples analyzed contained some nitrate, 40 samples had less than 45 parts per million. Water that contains more than 90 parts of nitrate is considered, by the Kansas State Board of Health, likely to cause infant cyanosis. Water containing less than 10 parts of nitrogen, or 45 parts of nitrate, is generally considered safe. Four water samples had nitrate contents ranging from 90 to 768 parts per million. It should be noted also that water from two city supplies had considerable nitrate. The water from the Long Island supply had 80 parts per million of nitrate and that from Lenora had 39 parts per million.
Sanitary considerations
The analyses of water (Tables 5 and 6) show only the amount of dissolved mineral matter in the water and do not indicate the sanitary quality of the water. An abnormal amount of certain mineral constituents, such as nitrate or chloride, however, may indicate pollution of the water.
The entire population of Norton County and northwestern Phillips County and nearly all the livestock are dependent on well-water supplies. Although the area has five municipal water plants that are safeguarded against pollution, a large percentage of the population is dependent upon private wells, and every precaution should be taken to protect these supplies from pollution. Deep-drilled wells on the uplands that penetrate relatively impervious silt above the water table are less subject to pollution than are shallow dug or driven wells in the valleys, where pervious sandy material extends from the surface down to the shallow water table. A well should not be located close to or below possible sources of pollution, such as barnyards, privies, and cesspools, and every well should be tightly sealed down to a level several feet below the land surface. It is generally advisable to locate a well on a site slightly higher than the surrounding area, or bank earth around the top of the well so that surface drainage will run away from rather than into the well. If a well must be located near a source of possible pollution it should be up slope from such pollution so that rain water will run toward the source of pollution rather than toward the well. Drilled wells are generally satisfactorily protected by the casing, although some are poorly sealed at the top.
Quality in relation to stratigraphy
The quantity of various dissolved mineral constituents in the ground waters of this area differs greatly from one formation to another. A sufficient number of chemical analyses are available to permit general conclusions concerning waters pumped from the Ogallala formation and the terrace deposits, but the few analyses of water collected from the alluvium, the Crete member of the Sanborn formation, the Niobrara formation, and the Codell sandstone member of the Carlile shale give less reliable indication of the quality of water in those stratigraphic units.
The maximum, minimum, and average concentrations of several constituents in parts per million from five water-bearing formations are given in Table 7, and typical analyses from each are plotted in graphic form in Figures 10 and 11. Twenty-four analyses show the water in the Ogallala formation to be of generally good quality and the range in dissolved constituents to be relatively low. The highest total hardness of Ogallala waters is less than 500 parts per million, and the average hardness of the 24 samples is 247 parts per million. The range in iron content is high--from 0.02 to 31.0 parts per million--with an average of 3.95 parts per million.
Two samples of water from Crete sand and gravel were analyzed and all constituents fall within the range of the Ogallala waters., As the water table is continuous from the Ogallala deposits into the Crete there is seemingly no significant difference between the waters of the two formations (Fig. 10).
Thirteen analyses of water pumped from terrace deposits indicate that the water from this source is significantly higher in total hardness than water in the Ogallala formation. The average hardness of waters from the terrace deposits is 411 parts per million as contrasted with an average of 247 parts per million for the Ogallala. The average iron content is much lower than for the Ogallala water but the range of 0.0 to 9.4 parts per million indicates that this may have little significance. Dissolved solids in waters from the terrace deposits have a range of 338 to 1,030 parts per million and the average is nearly 250 parts per million more than the average for water in the Ogallala.
As the water table at many places is continuous from the Ogallala into the terrace deposits the contrast in quality between the two probably is the result of the addition of dissolved mineral matter to the water from the terrace deposits themselves, or from the Cretaceous bedrock adjacent to the terrace deposits. Part of the water occurring under the prominent terraces is derived from the adjacent Ogallala formation and Crete sand and gravel and part from recharge from the terrace surface.
Although only four samples of water from alluvium in this area were analyzed, the ranges in total hardness and total dissolved solids are greater than for all other waters analyzed, and the average in each case is higher than the average for water from any other formation. The fluoride and iron content, on the other hand, are relatively low. Because only four analyses are available and the range in concentration of various constituents is extremely large, comparison with waters from other formations is apt to be misleading. The differences in composition of the water may be caused by the range in materials constituting the alluvium and by the fact that part of the recharge to these deposits is derived from surface-water infiltration at times of overflow of the stream channels.
Only two analyses of water from the Niobrara formation and Codell sandstone are available. However, the contrast in quality of these waters to the other waters of the area is so striking that they deserve special notice. The fluoride contents shown by these analyses are 5.0 and 3.4 parts per million, whereas the highest fluoride among the other 43 analyses is 0.7 part per million. The total hardnesses are 68 and 91 parts per million, whereas the lowest hardness among the other 43 analyses is 145 parts per million and only 4 samples have a hardness of less than 200 parts per million. The range of iron content and dissolved solids is no greater than in water from the other formations. The calcium and magnesium content of water from the Codell is low and the sodium content is quite high (129 and 289 parts per million). The lowest sodium content is significantly greater than the highest reported from the other formations. Probably the chemical characteristics peculiar to waters from the Codell sandstone are the result of a natural softening process. Water which percolates into the Codell from the overlying formations probably has a high content of calcium and magnesium and would be quite hard. The water in the Codell probably is softened by a natural base exchange in which calcium and magnesium ions in the water are exchanged for sodium ions in the rocks.
Prev Page--Geology || Next Page--Almena Project
Kansas Geological Survey, Geology
Placed on web July 18, 2008; originally published Dec. 1949.
Comments to webadmin@kgs.ku.edu
The URL for this page is http://www.kgs.ku.edu/General/Geology/Norton/05_gw.html