![]()
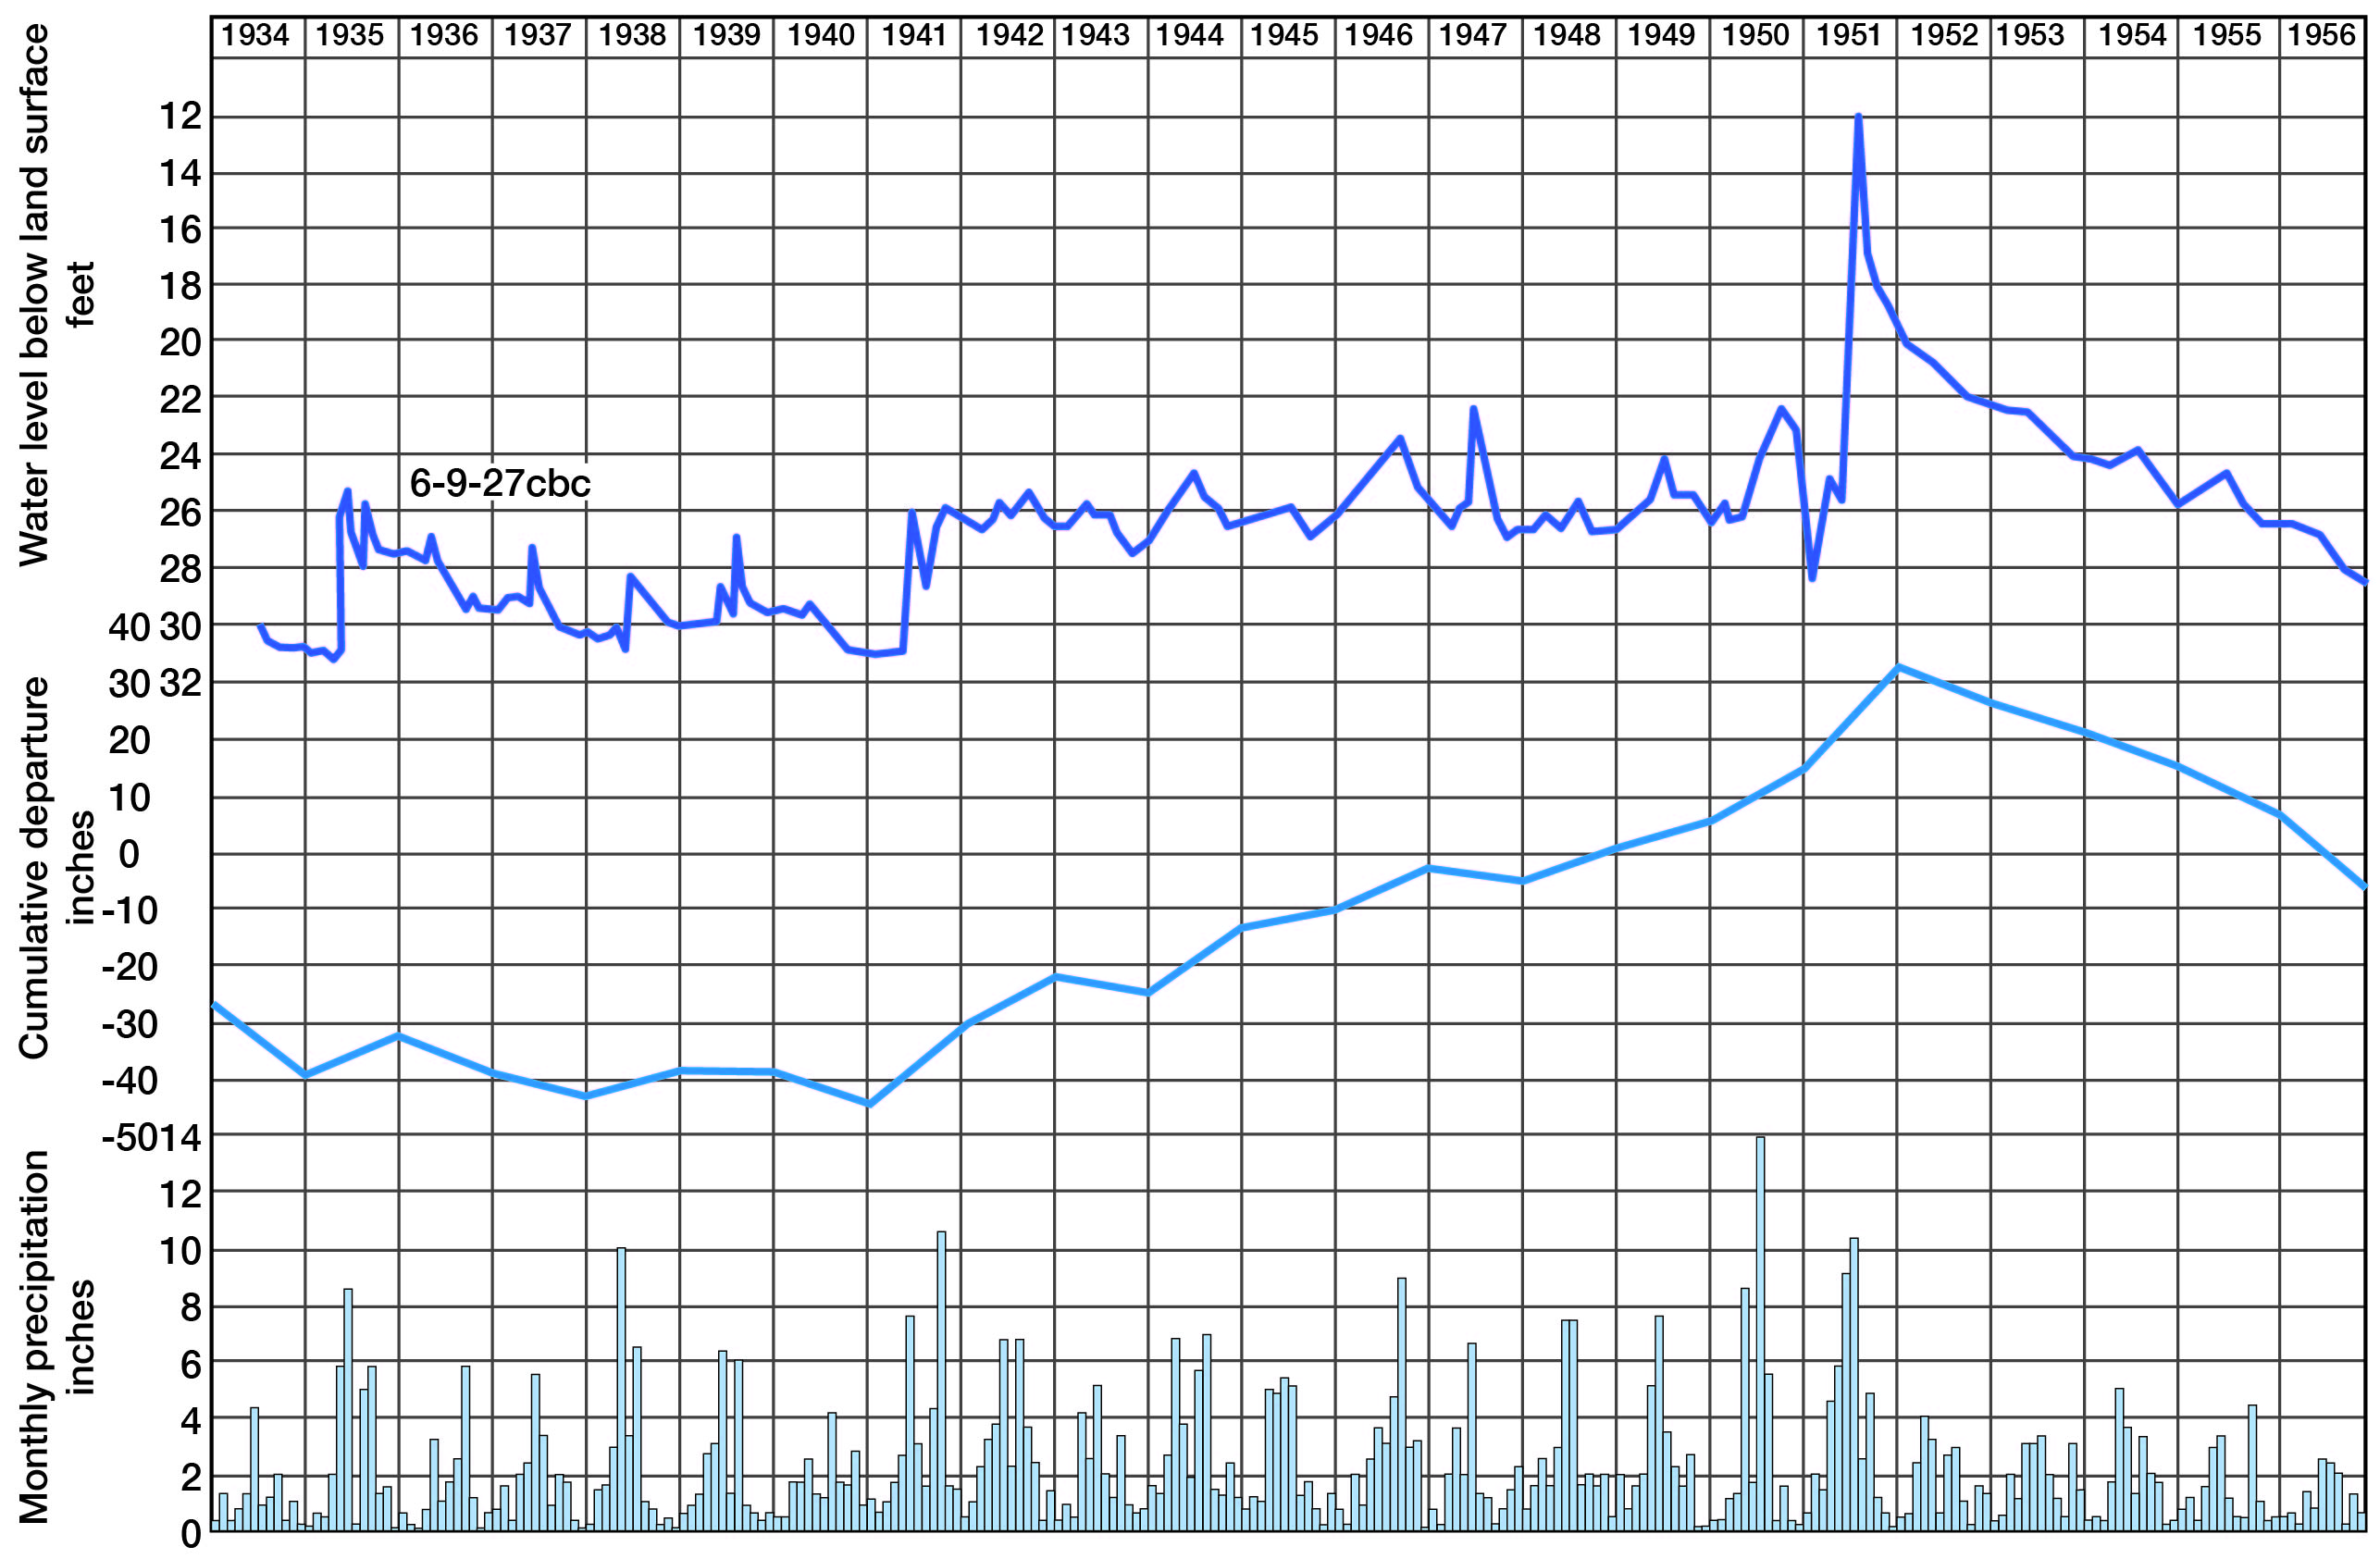
Figure 10
Figure 10--Hydrograph showing fluctuation of water levels of a wells, and graphs showing monthly precipitation and annual cumulative departure from normal precipitation at Beloit.
Kansas Geological Survey, Geology
Placed on web June 16, 2009; originally published April 1959.
Comments to webadmin@kgs.ku.edu
The URL for this page is http://www.kgs.ku.edu/General/Geology/Mitchell/fig10.html