![]()
Prev Page--Ground water || Next Page--Geologic Formations
Ground Water, continued
Utilization
During this investigation 310 domestic, stock, municipal, industrial, and irrigation wells were inventoried. Information regarding type, construction, depth, use of wells, and the depth to water is given in Table 17. Principal uses of ground water and types of wells are described below.
Domestic and Stock Supplies
One of the chief uses of ground water in Mitchell County is for domestic and stock supplies. Most domestic and stock wells that were inventoried were dug wells, the walls of which were lined with native stone, but drilled wells in which standard size galvanized casing has been set are common in the Solomon Valley and the valleys of the larger tributaries where ground water is plentiful. In the eastern part of the upland, where potable ground water from the Dakota Formation is available, most wells are drilled and tap this deeper artesian water.
Most domestic and stock wells are equipped with displacement-type pumps in which the cylinder is below the water level, and most pumps are operated by windmills; others are operated by electric motors, by gasoline engines, or by hand. A few wells are equipped with electrically driven jet pumps, which use a stream of water under pressure to raise the water. Most water for rural domestic use is ground water, but many residents rely on cisterns, particularly in much of the upland of Mitchell County where only meager supplies of ground water can be obtained from the underlying Cretaceous bedrock. In parts of the upland where groundwater supplies are difficult to obtain, ponds made by the construction of dams across hillside watercourses help solve the problem of stock supplies.
Municipal Supplies
Brief descriptions of cities in Mitchell County and their water supplies are given below; details of well construction are given in the table of wells and logs at the end of the report. Analyses of water from municipal wells are given in Table 5.
Beloit--Beloit (population in 1950 was 4,085), the county seat of Mitchell County, obtains its water supply from Solomon River. The flood of July, 1951, destroyed two wells just west of the city limits that bad been used as auxiliary wells during times of low river flow. During the summer of 1955, test drilling was done in the terrace deposits west of Beloit in anticipation of establishing two new wells to supplement surface water from Solomon River. The average amount of water used by Beloit is reported to be about 325,000 gallons per day. Table 14 gives partial chemical analyses of water taken from Solomon River at 3-mile intervals.
Cawker City--Cawker City (population in 1950 was 691) obtains its water supply from a dug well (6-10-27cdd) deriving water from terrace deposits of the Solomon Valley south of the city. The well is 60 feet deep and is walled with brick. The well is equipped with two electrically driven turbine pumps having capacities of 250 and 300 gallons per minute. Water is pumped directly into the mains, the excess going into an elevated 75,000-gallon tank. The average amount of water used by Cawker City is reported to be about 80,000 gallons per day.
Glen Elder--Glen Elder (population in 1950 was 582) obtains its water supply from two dug wells deriving water from terrace deposits of the Solomon Valley east of the city. The wells are 48 feet deep and are walled with native stone. One well having a 350-gpm turbine pump driven by a 30-horsepower electric motor pumps water directly into the mains, the excess going into an elevated 75,000-gallon tank. The other well has a 150-gpm turbine pump and is used as an auxiliary well in case of emergency. The average amount of water used by Glen Elder is reported to be about 50,000 gallons per day.
Tipton--Tipton (population in 1950 was 246) obtains its water supply from two dug wells and a drilled well deriving water from alluvial deposits along Carr Creek at the south edge of the city. The wells are about 42 feet deep and are equipped with electrically driven turbine pumps. Water is pumped directly into the mains, the excess going into an elevated 15,000-gallon tank. The average amount of water used by Tipton is reported to be about 25,000 gallons per day.
Hunter--Hunter (population in 1950 was 236) obtains its water supply from a dug well deriving water from alluvial deposits along a small creek one-fourth mile west of the city. The well is 34 feet deep and is equipped with an electrically driven jet pump. Water is pumped directly into the mains, the excess going into an elevated 33,000-gallon tank. The average amount of water used by Hunter is reported to be about 20,000 gallons per day.
Simpson--Simpson (population in 1950 was 231) obtains its water supply from a drilled well deriving water from terrace deposits of the Solomon Valley. The well is 47 feet deep and is equipped with an electrically driven turbine pump having a capacity of 70 gpm. Water is pumped directly into the mains, the excess going into an elevated 75,000-gallon tank. The average amount of water used by Simpson is reported to be about 15,000 gallons per day.
Scottsville--Scottsville (population in 1950 was 108) has no municipal water supply, and residents rely on wells or cisterns. Only small supplies of ground water are available in the Scottsville area, and during extended dry periods many users are forced to haul water from nearby cities.
Asherville--Asherville (unincorporated) has no municipal water supply. Residents reported that ground water in the Asherville area was unsatisfactory for domestic purposes because it had a bad taste. Although salty water in small areas of Wisconsinan terrace deposits in the Beloit area is attributed to the underlying Dakota Formation, an analysis of water from a stock well in Asherville indicates that ground water in the Asherville area has been locally contaminated from the barnyards, feeding pens, privies, and cesspools that are evident throughout Asherville. The analysis (7-6-27cdd, Table 5) of ground water in the Asherville area shows the water to be hard and relatively low in chloride, sulfate, and sodium ions, which is typical of ground water in the terrace deposits in Mitchell County. In addition, the water has an exceptionally high concentration of nitrate (456 ppm), indicating surface pollution. In contrast, analysis of water (7-7-15cbc, Table 5) from terrace deposits south of Beloit shows the water to be high in chloride (2,000 ppm), sulfate (1,090 ppm), and sodium (1,710 ppm), which is characteristic of ground water from the Dakota Formation in Mitchell County. Although there are stock wells in the Asherville area, residents depend upon cisterns for household water. During periods of deficient rainfall, water is hauled from Simpson or Beloit and stored in the cisterns.
Industrial Supplies
Mitchell County is primarily an agricultural area having very few industries and, therefore, very little water is used for industrial purposes. Most industries in Mitchell County are in Beloit, and many obtain their water supplies from the municipal water system in Beloit.
The Hund Ice Co., the Nehi Bottling Co., and the Beloit Dairy Products each have private wells in the 100 block of West Second Street in Beloit. These wells are drilled to a depth of about 50 feet and are cased with 8- to 12-inch casing; the wells derive water from terrace deposits of the Solomon Valley (Table 17). Although no pumpage data are available, the wells are reported to supply sufficient quantities of water.
Several business houses in Beloit maintain wells to provide water for air conditioning. These wells commonly are bored or driven from basement floors and derive water from the underlying terrace deposits. No data on pumpage are available.
The Union Pacific Railway Co. and Missouri Pacific Railroad Co. at one time maintained wells at Beloit, Simpson, and Asherville and used them to fill the boilers of steam locomotives. In recent years the railroads have converted to diesel engines, and the wells have been destroyed or abandoned.
Irrigation Supplies
At the time of the field investigation there were three irrigation wells in Mitchell County. All obtain water from Wisconsinan terrace deposits in the Solomon Valley. An irrigation well (7-6-20bdd) owned by Henry Remus was drilled during the early part of 1954. The well has a reported yield of 325 gpm and a drawdown of about 30 feet and hence a specific capacity of about 11 gpm per foot of drawdown. The well is used to irrigate 60 acres. A well owned by Alfred Emmot (7-7-15dcc2), drilled in the spring of 1955, has a reported yield of 250 gpm and a drawdown of about 27 feet and a specific capacity of about 9 gpm per foot of drawdown. An irrigation well (7-8-1adc1, about 2 miles west of Beloit) owned by Gerald Smith has the greatest yield reported. The reported yield at the time of installation was 900 gpm, the drawdown about 25 feet, and specific capacity about 36 gpm per foot of drawdown. Aquifer tests were made on the Smith well and the Remus well. Additional data regarding these irrigation wells and their construction are given in Table 17.
Several pumping plants along Solomon River draw water from the river for irrigation. Water generally is pumped up to the flood plain surface or to the Kirwin Terrace surface by means of a centrifugal pump powered by a stationary engine or tractor. As a rule, sprinkler systems are used for distributing the water.
Possibilities for Additional Ground-Water Irrigation
Logs of test holes show that fine to coarse alluvial material of moderate thickness underlies the valley of Solomon River. Although considerable sand and gravel generally is present in the lower part of the alluvial fill, this material is not well sorted in many places, and transmissibility is not great. Data from logs of test holes indicate that the saturated material, in general, is neither thick enough nor permeable enough for the development of wells having large yields. Wells of moderate yield, however, capable of irrigating small tracts, can be obtained in alluvial materials of the Solomon Valley.
Quality of Ground Water
The chemical character of ground water in Mitchell County is indicated by analyses of water from wells distributed over the county deriving water from the principal aquifers (Table 5). Also included in the table are analyses from five municipal supplies. Partial analyses of water collected from Solomon River at 3-mile intervals are given in Table 14. An analysis of water from Great Spirit Spring is given in Table 2. The analyses were made by H. A. Stoltenberg, Chemist, in the Water and Sewage Laboratory of the Kansas State Board of Health. The results of the analyses are given in parts per million. Factors for converting parts per million of mineral constituents to equivalents per million are given in Table 6. The analyses show only the dissolved mineral contents and do not indicate the sanitary condition of the water. Representative analyses of ground water from the principal aquifers are shown graphically in Figure 14.
Table 5--Analyses of water from typical wells in Mitchell County. Analyzed by H. A. Stoltenberg. Dissolved constituents given in parts per million. (One part per million is equivalent to one pound of substance per million pounds of water or 8.33 pounds per million gallons of water.)
| Well no. |
Depth (feet) |
Geologic source | Date of collection |
Temp. (°F) |
Dissolved solids |
Silica (SiO2) |
Iron (Fe) |
Calcium (Ca) |
Magnesium (Mg) |
Sodium and Potassium (Na+K) |
Bicarbonate (HCO3) |
Sulfate (SO4) |
Chloride (Cl) |
Fluoride (F) |
Nitrate (NO3) |
Hardness as CaCO3 | ||
|---|---|---|---|---|---|---|---|---|---|---|---|---|---|---|---|---|---|---|
| Total | Carbonate | Non- carbonate |
||||||||||||||||
| 6-6-17ddd | 39.0 | Greenhorn Limestone | 8-10-1955 | 59 | 1,230 | 24 | 0.41 | 202 | 20 | 187 | 357 | 286 | 222 | 0.3 | 111 | 586 | 292 | 294 |
| 6-7-13cdd | 140 | Dakota Formation | 7-22-1955 | 56 | 3,000 | 7.5 | 1.1 | 17 | 16 | 1,140 | 964 | 258 | 1,080 | 3.4 | 2.1 | 108 | 108 | 0 |
| 6-7-14dcc | 93 | Dakota Formation | 7-22-1955 | 57 | 805 | 22 | 1.1 | 81 | 13 | 212 | 473 | 43 | 199 | 0.3 | 1.9 | 256 | 256 | 0 |
| 6-8-24cdc | 28.0 | Greenhorn Limestone | 8-12-1955 | 59 | 2,000 | 14 | 0.33 | 323 | 59 | 236 | 412 | 365 | 325 | 0.8 | 478 | 1,050 | 340 | 710 |
| 6-8-32ccd | 44.7 | Terrace deposits | 10-21-1954 | 58 | 1,600 | 45 | 0.18 | 316 | 37 | 162 | 546 | 142 | 312 | 0.1 | 319 | 940 | 448 | 492 |
| 6-8-34ddc | 53.5 | Terrace deposits | 10-21-1954 | 58 | 402 | 24 | 0.48 | 96 | 7.4 | 39 | 315 | 19 | 43 | 0.2 | 18 | 270 | 258 | 12 |
| 6-9-15bbb | 33.0 | Terrace deposits | 8-10-1955 | 59 | 765 | 34 | 0.58 | 165 | 10 | 93 | 444 | 111 | 111 | 0.1 | 23 | 452 | 364 | 88 |
| 6-9-20dcd | 55.0 | Greenhorn Limestone | 11-18-1954 | 58 | 497 | 22 | 0.70 | 145 | 8.3 | 20 | 395 | 53 | 28 | 0.2 | 26 | 396 | 324 | 72 |
| 6-9-26cad1 | 48 | Terrace deposits | 8-9-1955 | 58 | 729 | 37 | 0.05 | 164 | 12 | 74 | 449 | 130 | 75 | 0.0 | 12 | 458 | 368 | 90 |
| 6-9-30dab | 37.0 | Terrace deposits | 11-18-1954 | 58 | 975 | 32 | 4.2 | 128 | 22 | 199 | 473 | 147 | 212 | 0.1 | 1.9 | 410 | 388 | 22 |
| 6-9-33acc | 48.7 | Terrace deposits | 10-21-1954 | 57 | 696 | 41 | 1.8 | 130 | 16 | 98 | 433 | 86 | 111 | 0.2 | 1.2 | 390 | 355 | 35 |
| 6-10-16ddc | 35.5 | Greenhorn Limestone | 10-21-1954 | 59 | 434 | 42 | 0.13 | 103 | 9.5 | 32 | 310 | 28 | 48 | 0.3 | 18 | 296 | 254 | 42 |
| 6-10-27cdd | 60 | Terrace deposits | 5-23-1955 | 57 | 462 | 35 | 0.04 | 110 | 9.1 | 36 | 361 | 48 | 29 | 0.1 | 3.3 | 312 | 296 | 16 |
| 7-6-10cbb | 130 | Dakota Formation | 7-22-1955 | 56 | 921 | 10 | 0.69 | 7.1 | 2.3 | 351 | 568 | 154 | 114 | 0.6 | 2.2 | 27 | 27 | 0 |
| 7-6-20bdd | 41.0 | Terrace deposits | 10-21-1954 | 58 | 1,110 | 24 | 1.2 | 172 | 18 | 206 | 429 | 192 | 283 | 0.2 | 1.5 | 503 | 352 | 151 |
| 7-6-24cdd | 40 | Dakota Formation | 11-19-1954 | 59 | 1,300 | 12 | 5.9 | 256 | 52 | 90 | 376 | 668 | 30 | 0.8 | 1.2 | 852 | 308 | 544 |
| 7-6-27cdd | 42 | Terrace deposits | 10-21-1954 | 58 | 1,860 | 34 | 0.32 | 403 | 38 | 132 | 476 | 271 | 290 | 0.1 | 456 | 1,160 | 390 | 770 |
| 7-6-32ddd | 40 | Terrace deposits | 11-18-1954 | 58 | 1,200 | 28 | 1.1 | 146 | 28 | 242 | 549 | 217 | 188 | 0.3 | 80 | 479 | 450 | 29 |
| 7-6-36aab | 45.0 | Terrace deposits | 11-19-1954 | 58 | 658 | 22 | 0.19 | 167 | 9.1 | 52 | 403 | 158 | 48 | 0.3 | 3.8 | 454 | 330 | 124 |
| 7-7-11cbb | 145 | Dakota Formation | 11-10-1954 | 56 | 1,910 | 10 | 6.0 | 127 | 23 | 562 | 654 | 320 | 540 | 0.6 | 2.8 | 412 | 412 | 0 |
| 7-7-12bac | 38.5 | Terrace deposits | 10-21-1954 | 57 | 1,030 | 18 | 0.05 | 240 | 19 | 89 | 479 | 302 | 107 | 0.1 | 15 | 677 | 393 | 284 |
| 7-7-15cbc | 37.5 | Terrace deposits | 8-12-1955 | 58 | 5,580 | 38 | 16 | 211 | 100 | 1,710 | 859 | 1,090 | 2,000 | 0.4 | 2.7 | 938 | 704 | 234 |
| 7-7-21bbb | 40 | Terrace deposits | 11-10-1954 | 57 | 4,350 | 26 | 5.5 | 371 | 85 | 1,110 | 637 | 735 | 1,700 | 0.2 | 5.3 | 1,280 | 520 | 760 |
| 7-7-29ab | 32.0 | Terrace deposits | 11-12-1954 | 58 | 952 | 32 | 0.17 | 195 | 10 | 115 | 468 | 217 | 73 | 0.2 | 80 | 528 | 384 | 144 |
| 7-8-1adc2 | 45.0 | Terrace deposits | 11-19-1954 | 57 | 1,180 | 23 | 0.12 | 186 | 19 | 201 | 410 | 152 | 271 | 0.1 | 128 | 542 | 336 | 206 |
| 7-8-27aaa | 35.0 | Greenhorn Limestone | 10-21-1954 | 58 | 1,670 | 23 | 0.06 | 384 | 32 | 107 | 422 | 824 | 72 | 0.6 | 19 | 1,090 | 346 | 744 |
| 7-9-9cc | 40 | Greenhorn Limestone | 10-21-1954 | 58 | 3,650 | 18 | 3.4 | 693 | 96 | 376 | 671 | 1,700 | 440 | 0.9 | 2.2 | 2,120 | 550 | 1,570 |
| 7-10-3dda | 40 | Terrace deposits | 11-12-1954 | 57 | 583 | 31 | 0.25 | 153 | 11 | 30 | 344 | 109 | 52 | 0.1 | 28 | 426 | 282 | 144 |
| 7-10-8bbb | 62.5 | Greenhorn Limestone | 11-12-1954 | 57 | 1,000 | 16 | 0.44 | 198 | 18 | 115 | 298 | 371 | 125 | 0.8 | 11 | 568 | 244 | 324 |
| 7-10-14ddd | 14.5 | Greenhorn Limestone | 11-10-1954 | 58 | 939 | 25 | 0.74 | 208 | 19 | 80 | 332 | 291 | 120 | 0.3 | 32 | 597 | 272 | 325 |
| 7-10-19add | 45.0 | Terrace deposits | 10-21-1954 | 57 | 732 | 24 | 2.2 | 149 | 15 | 86 | 339 | 99 | 139 | 0.2 | 53 | 434 | 278 | 156 |
| 7-10-22cca | 15.5 | Terrace deposits | 7-29-1955 | 58 | 370 | 45 | 0.10 | 86 | 11 | 26 | 315 | 19 | 22 | 0.3 | 5.8 | 260 | 258 | 2 |
| 7-10-25bcb | 27.4 | Greenhorn Limestone | 7-28-1955 | 59 | 2,140 | 45 | 0.22 | 433 | 45 | 183 | 351 | 901 | 249 | 0.3 | 106 | 1,270 | 290 | 980 |
| 7-10-32baa | 26.7 | Terrace deposits | 8-11-1955 | 58 | 473 | 24 | 0.10 | 128 | 10 | 23 | 327 | 81 | 34 | 0.1 | 12 | 360 | 268 | 92 |
| 8-6-1add | 47 | Terrace deposits | 3-17-1955 | 59 | 568 | 34 | 0.08 | 140 | 9.4 | 52 | 454 | 84 | 22 | 0.1 | 13 | 388 | 372 | 16 |
| 8-6-9bcc | 50 | Dakota Formation | 10-21-1954 | 58 | 1,120 | 23 | 0.23 | 256 | 17 | 102 | 356 | 251 | 234 | 0.1 | 58 | 708 | 292 | 416 |
| 8-6-20cdc | 165 | Dakota Formation | 7-22-1955 | 56 | 615 | 7.0 | 2.1 | 4.0 | 3.2 | 242 | 532 | 62 | 32 | 1.4 | 1.1 | 23 | 23 | 0 |
| 8-6-30aaa | 165 | Dakota Formation | 7-22-1955 | 57 | 1,160 | 7.0 | 0.45 | 135 | 41 | 241 | 722 | 275 | 105 | 0.5 | 1.9 | 506 | 506 | 0 |
| 8-7-2bad | 41.0 | Greenhorn Limestone | 10-21-1954 | 58 | 1,680 | 24 | 0.06 | 305 | 25 | 220 | 337 | 523 | 311 | 0.4 | 102 | 864 | 276 | 588 |
| 8-8-22aaa | 34.0 | Greenhorn Limestone | 8-11-1955 | 59 | 2,770 | 16 | 5.3 | 614 | 85 | 119 | 351 | 1,650 | 79 | 0.8 | 28 | 1,880 | 290 | 1,590 |
| 8-8-31dcc | 26.0 | Greenhorn Limestone | 8-11-1955 | 59 | 1,558 | 15 | 0.11 | 311 | 33 | 150 | 417 | 423 | 191 | 0.4 | 230 | 912 | 342 | 570 |
| 8-9-17aab | 42.0 | Terrace deposits | 8-10-1955 | 57 | 730 | 35 | 1.6 | 181 | 17 | 43 | 442 | 214 | 20 | 0.2 | 1.5 | 522 | 362 | 160 |
| 8-10-30aac | 42 | Terrace deposits | 3-29-1955 | 59 | 959 | 39 | 0.10 | 211 | 18 | 74 | 407 | 347 | 37 | 0.2 | 17 | 600 | 334 | 266 |
| 9-6-10bcb | 180 | Dakota Formation | 8-3-1955 | 56 | 987 | 15 | 0.44 | 110 | 15 | 216 | 439 | 368 | 42 | 0.6 | 4.1 | 336 | 336 | 0 |
| 9-6-29aaa | 190 | Dakota Formation | 8-12-1955 | 57 | 479 | 13 | 3.6 | 52 | 12 | 112 | 366 | 83 | 21 | 0.6 | 5.3 | 179 | 179 | 0 |
| 9-7-19da | 22.0 | Terrace deposits | 8-4-1955 | 59 | 1,460 | 33 | 0.08 | 299 | 23 | 172 | 398 | 203 | 415 | 0.2 | 115 | 840 | 326 | 514 |
| 9-7-22ddd | 26.5 | Dakota Formation | 8-4-1955 | 58 | 1,600 | 19 | 0.30 | 296 | 19 | 200 | 415 | 218 | 270 | 0.2 | 376 | 816 | 340 | 476 |
| 9-8-15bad | 27.0 | Terrace deposits | 8-5-1955 | 59 | 2,460 | 23 | 2.7 | 324 | 46 | 460 | 409 | 843 | 555 | 0.5 | 2.2 | 998 | 336 | 662 |
| 9-8-34bcc | 185.0 | Dakota Formation | 7-19-1955 | 57 | 2,270 | 8.5 | 3.8 | 22 | 17 | 835 | 637 | 261 | 810 | 1.2 | 2.8 | 125 | 125 | 0 |
| 9-9-7dcb | 23.0 | Colluvium | 7-27-1955 | 59 | 888 | 22 | 0.12 | 180 | 15 | 110 | 520 | 167 | 63 | 0.4 | 75 | 510 | 426 | 84 |
| 9-9-26aaa | 24.5 | Greenhorn Limestone | 8-11-1955 | 59 | 803 | 19 | 0.18 | 198 | 20 | 44 | 371 | 169 | 90 | 0.4 | 80 | 576 | 304 | 272 |
| 9-10-21ab | 28.0 | Colluvium | 8-1-1955 | 59 | 5,380 | 34 | 0.14 | 625 | 354 | 541 | 471 | 2,920 | 364 | 0.8 | 310 | 3,010 | 380 | 2,630 |
| 9-10-26ddc | 34 | Terrace deposits | 2-18-1954 | 58 | 1,610 | 40 | 0.13 | 348 | 27 | 105 | 456 | 686 | 78 | 0.4 | 11 | 979 | 374 | 605 |
Figure 14--Graphic representation of chemical analyses of samples of water from wells in principal water-bearing formations.
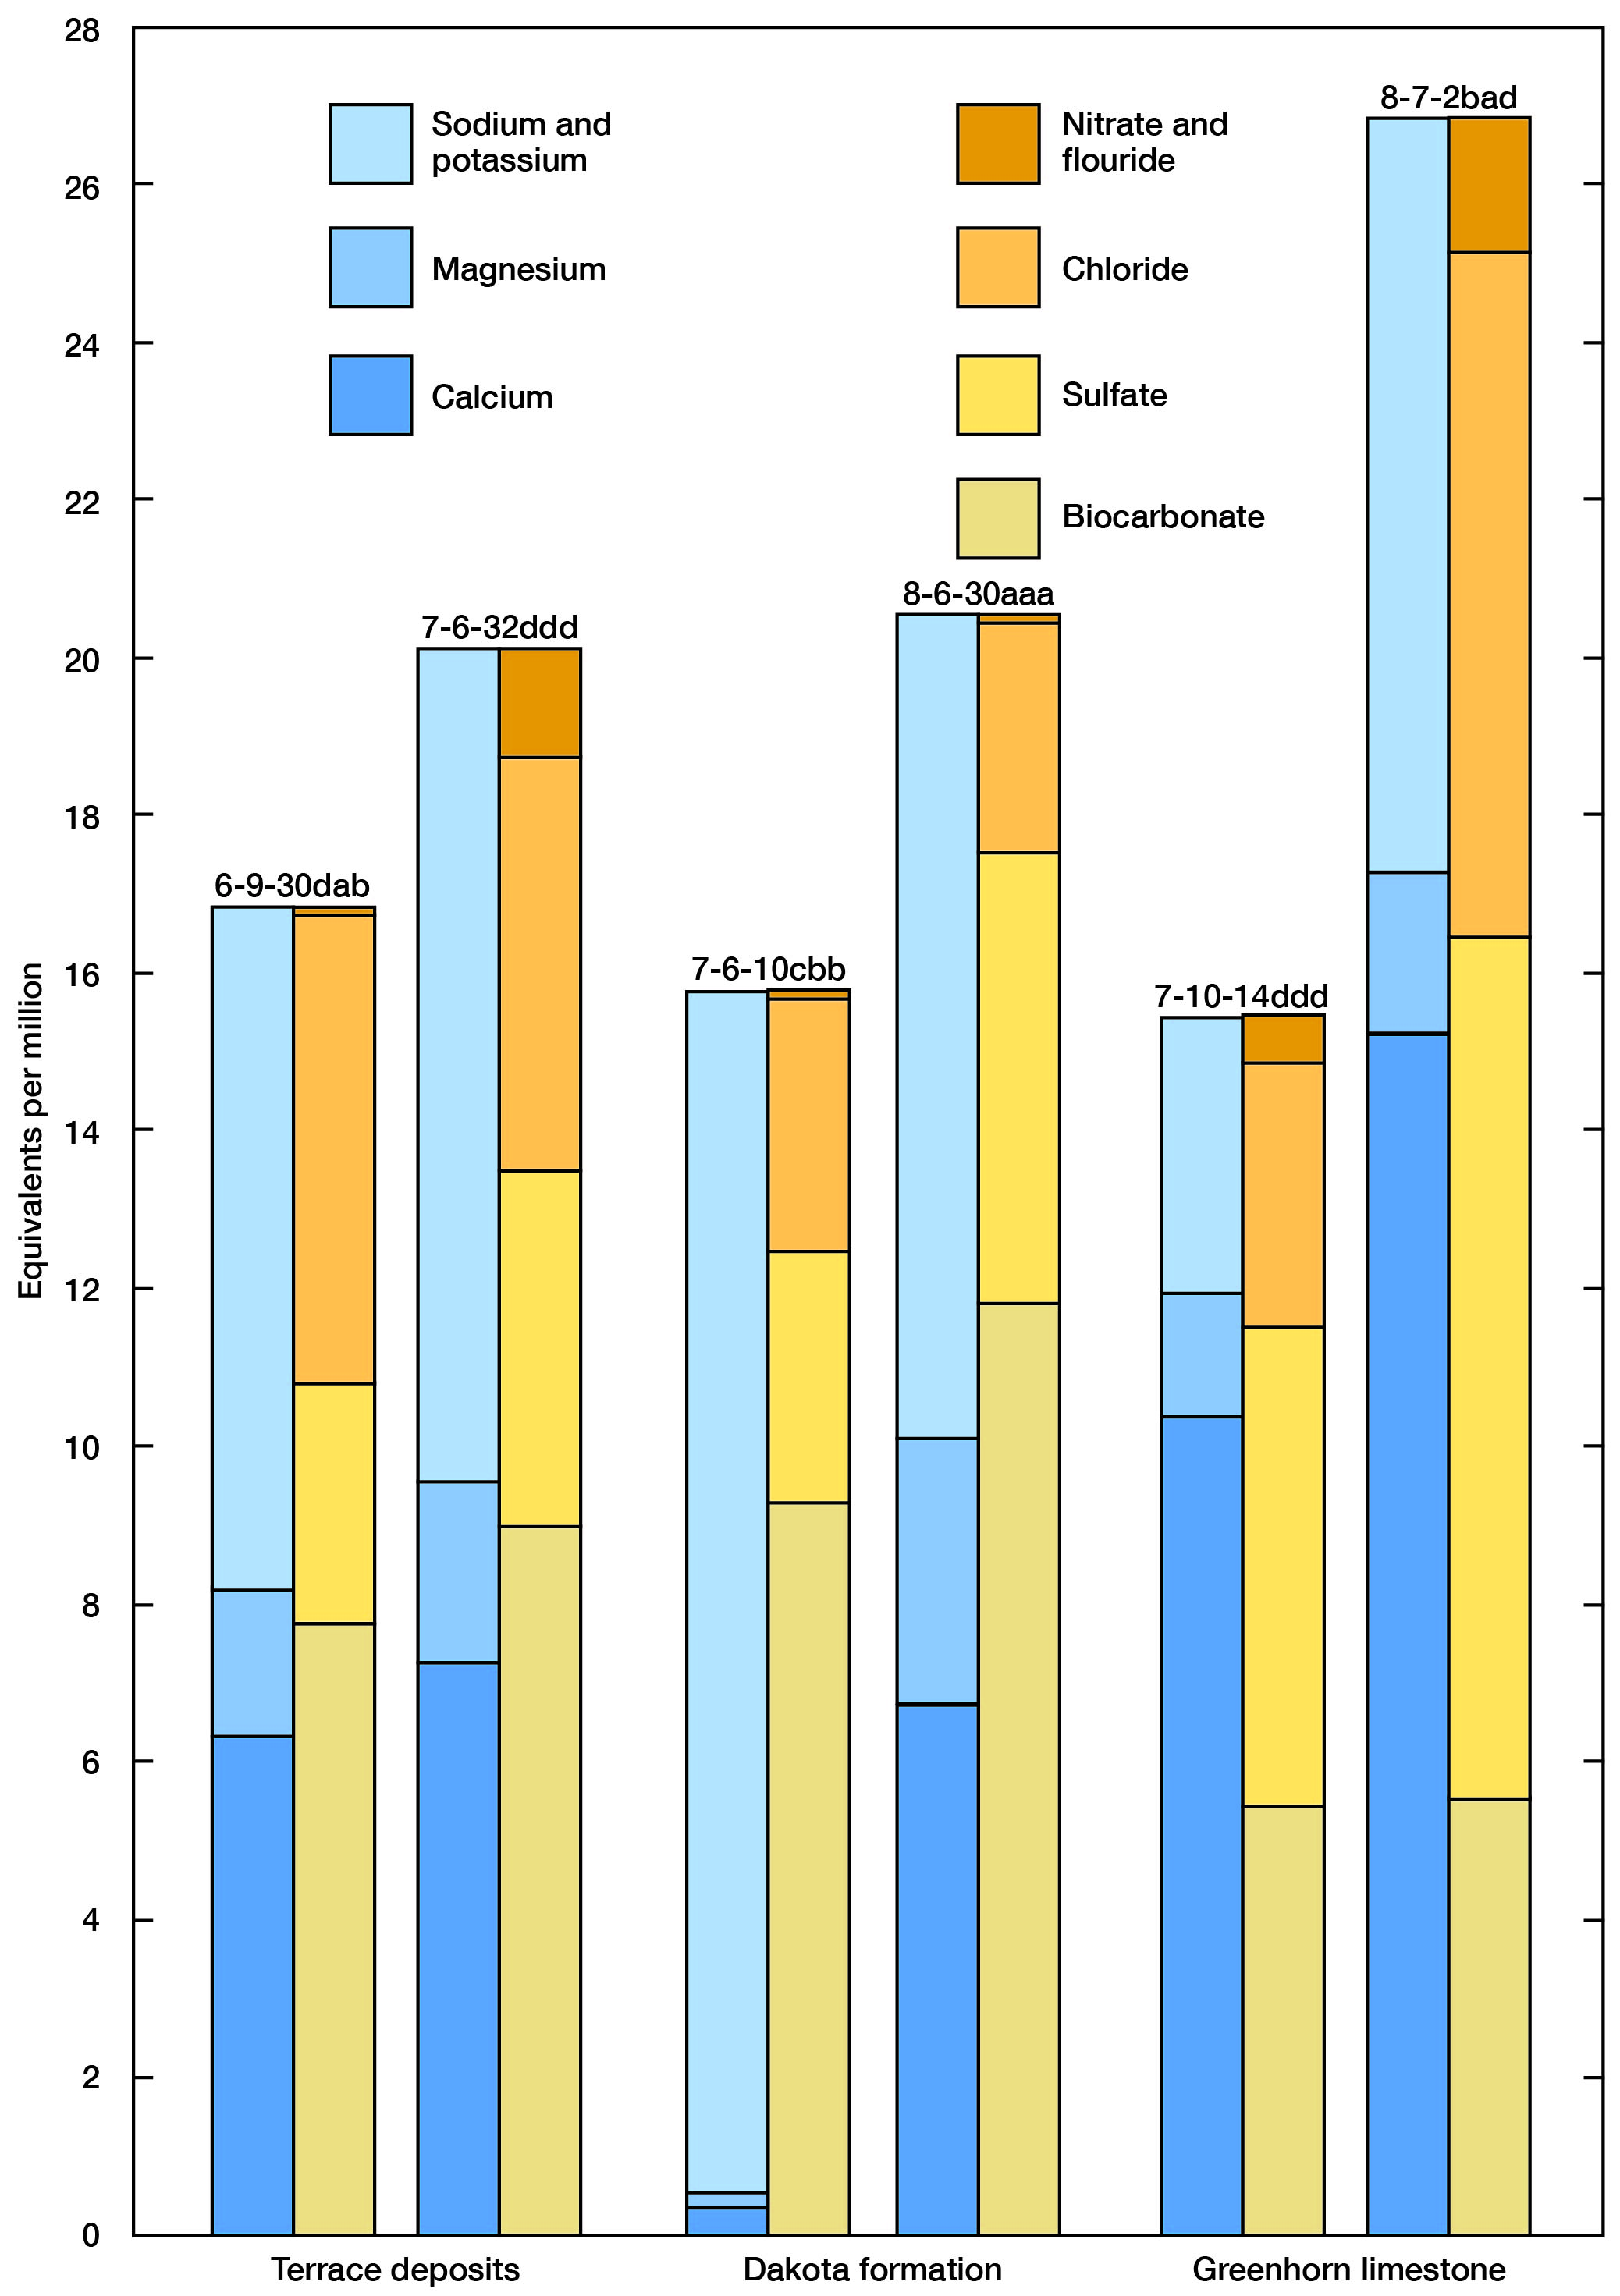
Table 6--Factors for converting parts per million to equivalents per million.
| Mineral constituent |
Chemical symbol |
Factor |
|---|---|---|
| Calcium | Ca++ | 0.0499 |
| Magnesium | Mg++ | 0.0822 |
| Sodium | Na+ | 0.0435 |
| Potassium | K+ | 0.0256 |
| Carbonate | CO3-- | 0.0333 |
| Bicarbonate | HCO3- | 0.0164 |
| Sulfate | SO4-- | 0.0208 |
| Chloride | Cl- | 0.0282 |
| Fluoride | F- | 0.0526 |
| Nitrate | NO3- | 0.0161 |
Chemical Constituents in Relation to Use
The following discussion of the chemical constituents of ground water in relation to use has been adapted in part from publications of the U. S. Geological Survey and the State Geological Survey of Kansas.
Dissolved solids--The residue left after a natural water has evaporated consists mainly of the mineral constituents but may also include some organic material and water of crystallization. Water containing less than 500 ppm of dissolved solids generally is satisfactory for domestic and many industrial purposes. Water containing more than 1,000 ppm of dissolved solids generally contains enough of certain constituents to produce a disagreeable taste or to make the water unsuitable in other respects.
The dissolved solids in samples of water from wells in Mitchell County ranged from 370 to 5,580 ppm. Seven samples contained less than 500 ppm of dissolved solids and about half the samples (25) contained less than 1,000 ppm (Table 7).
Table 7--Dissolved solids in samples of water from wells in Mitchell County.
| Dissolved solids, parts per million |
Number of samples |
|---|---|
| Less than 400 | 1 |
| 400-600 | 8 |
| 601-800 | 7 |
| 801-1,000 | 9 |
| 1,001-1,500 | 10 |
| 1,501-2,000 | 8 |
| More than 2,000 | 10 |
| Total | 53 |
Hardness--Hardness of water is recognized most commonly by the amount of soap needed to produce a lather or suds and by an insoluble scum that forms during washing processes. Calcium and magnesium cause almost all the hardness of water and are the constituents that form most of the scale in steam boilers and other containers in which water is heated or evaporated. The table of analyses (Table 5) gives carbonate hardness and noncarbonate hardness in addition to total hardness. Calcium and magnesium bicarbonates cause carbonate hardness, which is sometimes called temporary hardness because the hardness can be virtually removed by boiling the water. Noncarbonate hardness, which is sometimes called permanent hardness because it cannot be removed by boiling, is caused by calcium and magnesium salts of the strong acid constituents--sulfate, chloride, nitrate, and fluoride. Both types of hardness react similarly with soap.
Water that has a hardness of 50 ppm or less is considered soft. Water that has a hardness of 50 to 150 ppm is satisfactory for most purposes, but the hardness does increase the amount of soap needed, and treatment of such water by a softening process generally is profitable for laundries. Water having a hardness in the upper part of this range will cause considerable scale in steam boilers. Hardness of more than 150 ppm is, very obvious, and water that has a hardness of 200 or 300 ppm generally is undesirable for household purposes until it is treated by a softening process. Where municipal water supplies are softened, the hardness generally is reduced to about 100 ppm.
Water samples from wells in Mitchell County ranged in total hardness from 23 to 3,010 ppm. Four samples had a hardness of less than 150 ppm. Only 9 samples had hardnesses of less than 300 ppm, and 8 had hardnesses of more than 1,000 ppm (Table 8).
Table 8--Hardness of samples of water front wells in Mitchell County.
| Hardness, parts per million |
Number of samples |
|---|---|
| Less than 100 | 2 |
| 100-200 | 3 |
| 201-300 | 4 |
| 301-400 | 6 |
| 401-500 | 8 |
| 501-600 | 10 |
| 601-1,000 | 12 |
| More than 1,000 | 8 |
| Total | 53 |
Iron--Iron and manganese in quantities that exceed a few tenths of a part per million are undesirable, as they stain fabrics and plumbing fixtures and produce an objectionable coloration in the water. The limit generally specified is 0.3 ppm. Water in the ground may contain considerable iron, but upon exposure to air most of the iron is oxidized and precipitated as a reddish sediment, only a few tenths of a part per million of the iron remaining in solution. Iron may be removed from most water by aeration and filtration, but some water requires additional treatment.
The iron content of water samples from wells in Mitchell County ranged from 0.04 to 16 ppm. Ten samples contained 0.1 ppm of iron or less, and 24 samples contained 0.3 ppm or less (Table 9).
Table 9--Iron content of samples of water from wells in Mitchell County.
| Iron, parts per million |
Number of samples |
|---|---|
| 0-0.10 | 10 |
| 0.11-0.30 | 14 |
| 0.31-0.50 | 7 |
| 0.51-1.00 | 4 |
| More than 1.00 | 18 |
| Total | 53 |
Fluoride--Fluoride generally is present only in small concentrations in ground water, but to know the amount of fluoride in water used by children is important. Too much fluoride in water has been shown to be associated with the dental defect known as mottled enamel, which may appear on the teeth of children who drink water containing too much fluoride during the period when permanent teeth are forming (Dean, 1936, p. 1270).
Recent studies have shown that concentrations of fluoride too small to cause objectionable mottling of tooth enamel--from 1.0 to 1.5 ppm--may help to prevent tooth decay. The United States Public Health Service (1946) has published standards that set or recommend the concentrations of mineral constituents permissible in drinking water that is used on interstate carriers. The maximum amount of fluoride permissible is 1.5 ppm.
The fluoride content of water samples from wells in Mitchell County ranged from 0 to 3.4 ppm. Only 3 samples contained more than 1.0 ppm (Table 10).
Table 10--Fluoride content of samples of water from wells in Mitchell County.
| Fluoride, parts per million |
Number of samples |
|---|---|
| 0.0 | 1 |
| 0.1 | 11 |
| 0.2 | 11 |
| 0.3-0.5 | 16 |
| 0.6-1.0 | 11 |
| More than 1.0 | 3 |
| Total | 53 |
Nitrate--The variation in nitrate content for different waters is great and in many waters seemingly is not related to any geologic formation. Although some nitrate may be derived from nitrate-bearing rocks and minerals in the water-bearing formation, high nitrate concentrations may be due to direct flow of surface water into the well or to percolation of water into the well from the overlying soil zone. Nitrates are dissolved readily from soils that contain concentrations of nitrate derived from plants, animal waste, or nitrifying action. Because privies, cesspools, and barnyards are sources of organic nitrogen, a large amount of nitrate in well water may indicate the presence of harmful bacteria or prior pollution.
Nitrate in concentrations greater than about 45 ppm is undesirable because of the possible toxic effect that it may have on infants (Metzler and Stoltenberg, 1950). This effect, which is known as cyanosis, may result when water that contains excessive nitrate is used in the preparation of the baby's formula. In cyanosis, the baby becomes listless and drowsy, and the skin takes on a blue color. The Kansas State Board of Health regards 45 ppm as the safe limit of nitrate (as NO3). This is equivalent to 10 ppm of nitrate nitrogen. Water containing as much as 90 ppm of nitrate generally is considered very dangerous to infants, and water containing as much as 150 ppm may cause severe cyanosis. Nitrate in drinking water does not cause cyanosis in adults or older children but may be responsible for certain digestive disorders. Nitrate cannot be removed from water by boiling.
The nitrate content of water from wells sampled in Mitchell County ranged from 1.1 to 478 ppm; 21 samples contained less than 10 ppm of nitrate, but 17 samples contained more than the 45 ppm limit set by the Kansas State Board of Health (Table 11).
Table 11--Nitrate content of samples of water from wells in Mitchell County.
| Nitrate, parts per million |
Number of samples |
|---|---|
| 0-10 | 21 |
| 11-50 | 15 |
| 51-100 | 6 |
| More than 100 | 11 |
| Total | 53 |
Sulfate--Sulfate (SO4) in ground water is derived principally from gypsum or anhydrite (calcium sulfate) and from the oxidation of pyrite (iron disulfide). Magnesium sulfate (Epsom salt) and sodium sulfate (Glauber's salt), if present in sufficient quantities, will impart a bitter taste to the water and the water may act as a laxative for people not accustomed to drinking it. More than 250 ppm of sulfate in drinking water generally is undesirable (U. S. Public Health Service, 1946).
The sulfate content of water samples from wells in Mitchell County ranged from 19 to 2,920 ppm. Nearly half (25) of the samples contained more than 250 ppm of sulfate (Table 12).
Table 12--Sulfate content of samples of water from wells in Mitchell County.
| Sulfate, parts per million |
Number of samples |
|---|---|
| Less than 100 | 12 |
| 100-250 | 16 |
| 251-500 | 14 |
| More than 500 | 11 |
| Total | 53 |
Chloride--Water that contains less than 150 ppm of chloride is satisfactory for most purposes. Water containing more than 250 ppm of chloride generally is objectionable for municipal supplies, and water containing more than 350 ppm is objectionable for most irrigation or industrial use. Water containing as much as 500 ppm of chloride has a disagreeable taste. H. A. Stoltenberg (personal communication) believes the upper limit of chloride in water permissible for cattle to be about 4,000 or 5,000 ppm.
The chloride content of water samples from wells in Mitchell County ranged from 20 to 2,000 ppm. Thirty samples contained less than 150 ppm of chloride (Table 13).
Table 13--Chloride content of samples of water from wells in Mitchell County.
| Chloride, parts per million |
Number of samples |
|---|---|
| Less than 50 | 14 |
| 50-150 | 16 |
| 151-500 | 17 |
| More than 500 | 6 |
| Total | 53 |
Bicarbonate--Bicarbonate, the predominant anion in ground water in Mitchell County, and carbonate cause alkalinity of ground water. The concentration of bicarbonate in samples from wells in Mitchell County ranged from 298 to 964 ppm.
Silica--Silica is a mineral constituent in most ground water and may be deposited with other scale-forming constituents in steam boilers, but it has little effect on the use of water for other purposes. The concentration of silica in samples from wells in Mitchell County ranged from 7.0 to 45 ppm.
Sodium--The amount of sodium in water to be used for irrigation is important because a large percentage of sodium (equivalents per million of sodium divided by equivalents per million of sodium, potassium, calcium, and magnesium, expressed as a percentage) is undesirable in water to be used for irrigation. The effect of sodium content in irrigation water is discussed [in the section on Irrigation].
Quality of Water from Solomon River
Twelve samples of water from Solomon River were collected at 3-mile intervals across Mitchell County for partial analysis (Table 14). The samples were collected at a time of relatively low flow in the river, when ground water was contributing largely to the river flow. The analyses indicate a general decrease in chloride content upstream across the county toward the west. An increase of chloride in the sample collected in the NW sec. 31, T. 6 S., R. 9 W., probably can be attributed to Waconda Springs, about half a mile northwest. The analyses show that west of Waconda Springs the chloride content is small.
Table 14--Partial analyses of water collected October 1, 1954, from Solomon River. Analyses given in ppm.
| Location | Total hardness as CaCO3 |
Alkalinity as CaCO3 |
Chloride | Sulfate |
|---|---|---|---|---|
| SE sec. 12, T. 8 S., R. 6 W. | 336 | 267 | 251 | 161 |
| SE sec. 33, T. 7 S., R. 6 W. | 318 | 236 | 240 | 170 |
| NW sec. 31, T. 7 S., R. 6 W. | 332 | 254 | 180 | 149 |
| NE sec. 21, T. 7 S., R. 7 W. | 330 | 244 | 179 | 158 |
| NE sec. 12, T. 7 S., R. 8 W. | 820 | 234 | 134 | 152 |
| SE sec. 4, T. 7 S., R. 8 W. | 296 | 214 | 123 | 152 |
| SE sec. 1, T. 7 S., R. 9 W. | 298 | 223 | 108 | 146 |
| NW sec. 34, T. 6 S., R. 9 W. | 276 | 186 | 90 | 151 |
| NW sec. 31, T. 6 S., R. 9 W. | 292 | 196 | 120 | 163 |
| NW sec. 3, T. 7 S., R. 10 W. | 286 | 216 | 33 | 113 |
| SW sec. 31, T. 6 S., R. 10 W. | 270 | 220 | 24 | 95 |
| NW sec. 19, T. 7 S., R. 10 W. | 266 | 169 | 32 | 149 |
Natural Softening Process in the Dakota Formation
The soft sodium bicarbonate water characteristic of the Dakota Formation is believed to result from a natural softening process in which calcium bicarbonate water has exchanged part of its calcium and magnesium for sodium by reaction with base-exchange silicates within the Dakota Formation (Latta, 1944). The completeness of the base-exchange reaction in the bicarbonate water is indicated by the ratio between the calcium and sodium ions, a small ratio of calcium to sodium indicating a soft water. The principal base-exchange silicates in the Dakota Formation are believed to be the clay-forming minerals of the montmorillonite, kaolinite, and illite groups. However, Plummer (personal communication) believes that the abundant mica and feldspar in the sandstones of the Dakota could be partly responsible for the base exchange.
Analysis of water from well 7-6-10cbb (Fig. 14) illustrates natural softening of water in the Dakota Formation by base exchange. Water samples collected from wells 8-6-20cdc and 8-6-30aaa (Table 5), about a quarter mile apart, further illustrate natural softening of water in the Dakota Formation. Analysis of water from well 8-6-20cdc shows a very low calcium and magnesium content and a total hardness of 23 ppm. Conversely, water from well 8-6-30aaa shows fairly high concentrations of calcium and magnesium and a total hardness of 506 ppm.
Sanitary Considerations
The analyses of water in Table 5 give only the amount of dissolved mineral matter in the water and do not indicate the sanitary quality of the water, although a large amount of certain mineral constituents such as nitrate or chloride may indicate pollution. Water containing mineral matter that imparts an objectionable taste or odor may be free from harmful bacteria and safe for drinking. Conversely, water clear and pleasant to the taste may contain harmful bacteria. Great care should be taken to protect domestic and public water supplies from pollution. To guard against contamination of a ground-water supply, a well must be properly sealed in order to keep out dust, insects, vermin, debris, and surface water. Wells should not be placed where barnyards, privies, or cesspools are possible sources of pollution.
Suitability of Water for Irrigation
This discussion of the suitability of water for irrigation is based on methods outlined in Agriculture Handbook Number 60, U. S. Department of Agriculture (U. S. Salinity Laboratory Staff, 1954).
In areas of sufficient rainfall and ideal soil conditions, soluble salts originally present in the soil or added to the soil with water are carried downward by percolation and ultimately reach the water table. Soil that was originally nonsaline and nonalkali may become unproductive if excessive soluble salts or exchangeable sodium are allowed to accumulate owing to improper irrigation and soil management or inadequate drainage. If the amount of water applied to the soil is not in excess of the amount needed by plants, water will not percolate downward below the root zone, and an accumulation of mineral matter will form at that point. Likewise impermeable soil zones near the surface can retard the downward movement of water, resulting in water-logging of the soil and deposition of salts.
The characteristics of an irrigation water that seem to be most important in determining its suitability are the total concentration of soluble salts and the relative activity of sodium ions in exchange reactions. For diagnosis and classification the total concentration of soluble salts in irrigation water can be expressed in terms of electrical conductivity, which is a measure of the ability of the inorganic salts in solution to conduct an electrical current. The electrical conductivity can be determined accurately in the laboratory, or an approximation of the electrical conductivity can be obtained by multiplying the total equivalents per million of cations (calcium, magnesium, sodium, and potassium) by 100 or by dividing the total dissolved solids in parts per million by 0.64.
Salt-sensitive crops such as strawberries, green beans, and red clover may be affected adversely by irrigation water having an electrical conductivity exceeding 250 micromhos per centimeter, but waters having electrical-conductivity values below 750 micromhos per centimeter are generally satisfactory for irrigation insofar as salt content is concerned. Waters in the range of 750 to 2,250 micromhos per centimeter are widely used, and satisfactory crop growth is obtained under good management and favorable drainage conditions, but saline conditions will develop if leaching and drainage are inadequate. Use of waters having conductivities of more than 2,250 micromhos per centimeter is the exception, and few instances can be cited where such waters have been used successfully.
The sodium-adsorption ratio may be determined by the formula
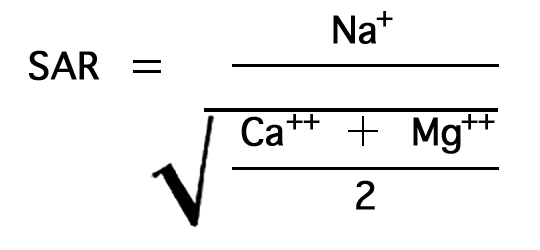
where the ionic concentrations are expressed in equivalents per million. The sodium-adsorption ratio may also be determined by use of the nomogram shown in Figure 15. In using the nomogram to determine the sodium-adsorption ratio of a water, the concentration of sodium expressed in equivalents per million is plotted on the left scale (A), and the concentration of calcium plus magnesium expressed in equivalents per million is plotted on the right scale (B). (In this report the concentrations of sodium and potassium are given together, as sodium, but the amount of potassium is negligible.) The point at which a line connecting these two points intersects the sodium-adsorption-ratio scale (C) determines the sodium- adsorption ratio of the water. Table 15 gives the well numbers for the analyses plotted on Figures 15 and 16, sodium-adsorption ratios, and approximate electrical conductivities.
Figure 15--Nomogram for determining the sodium-adsorption ratio of a water.
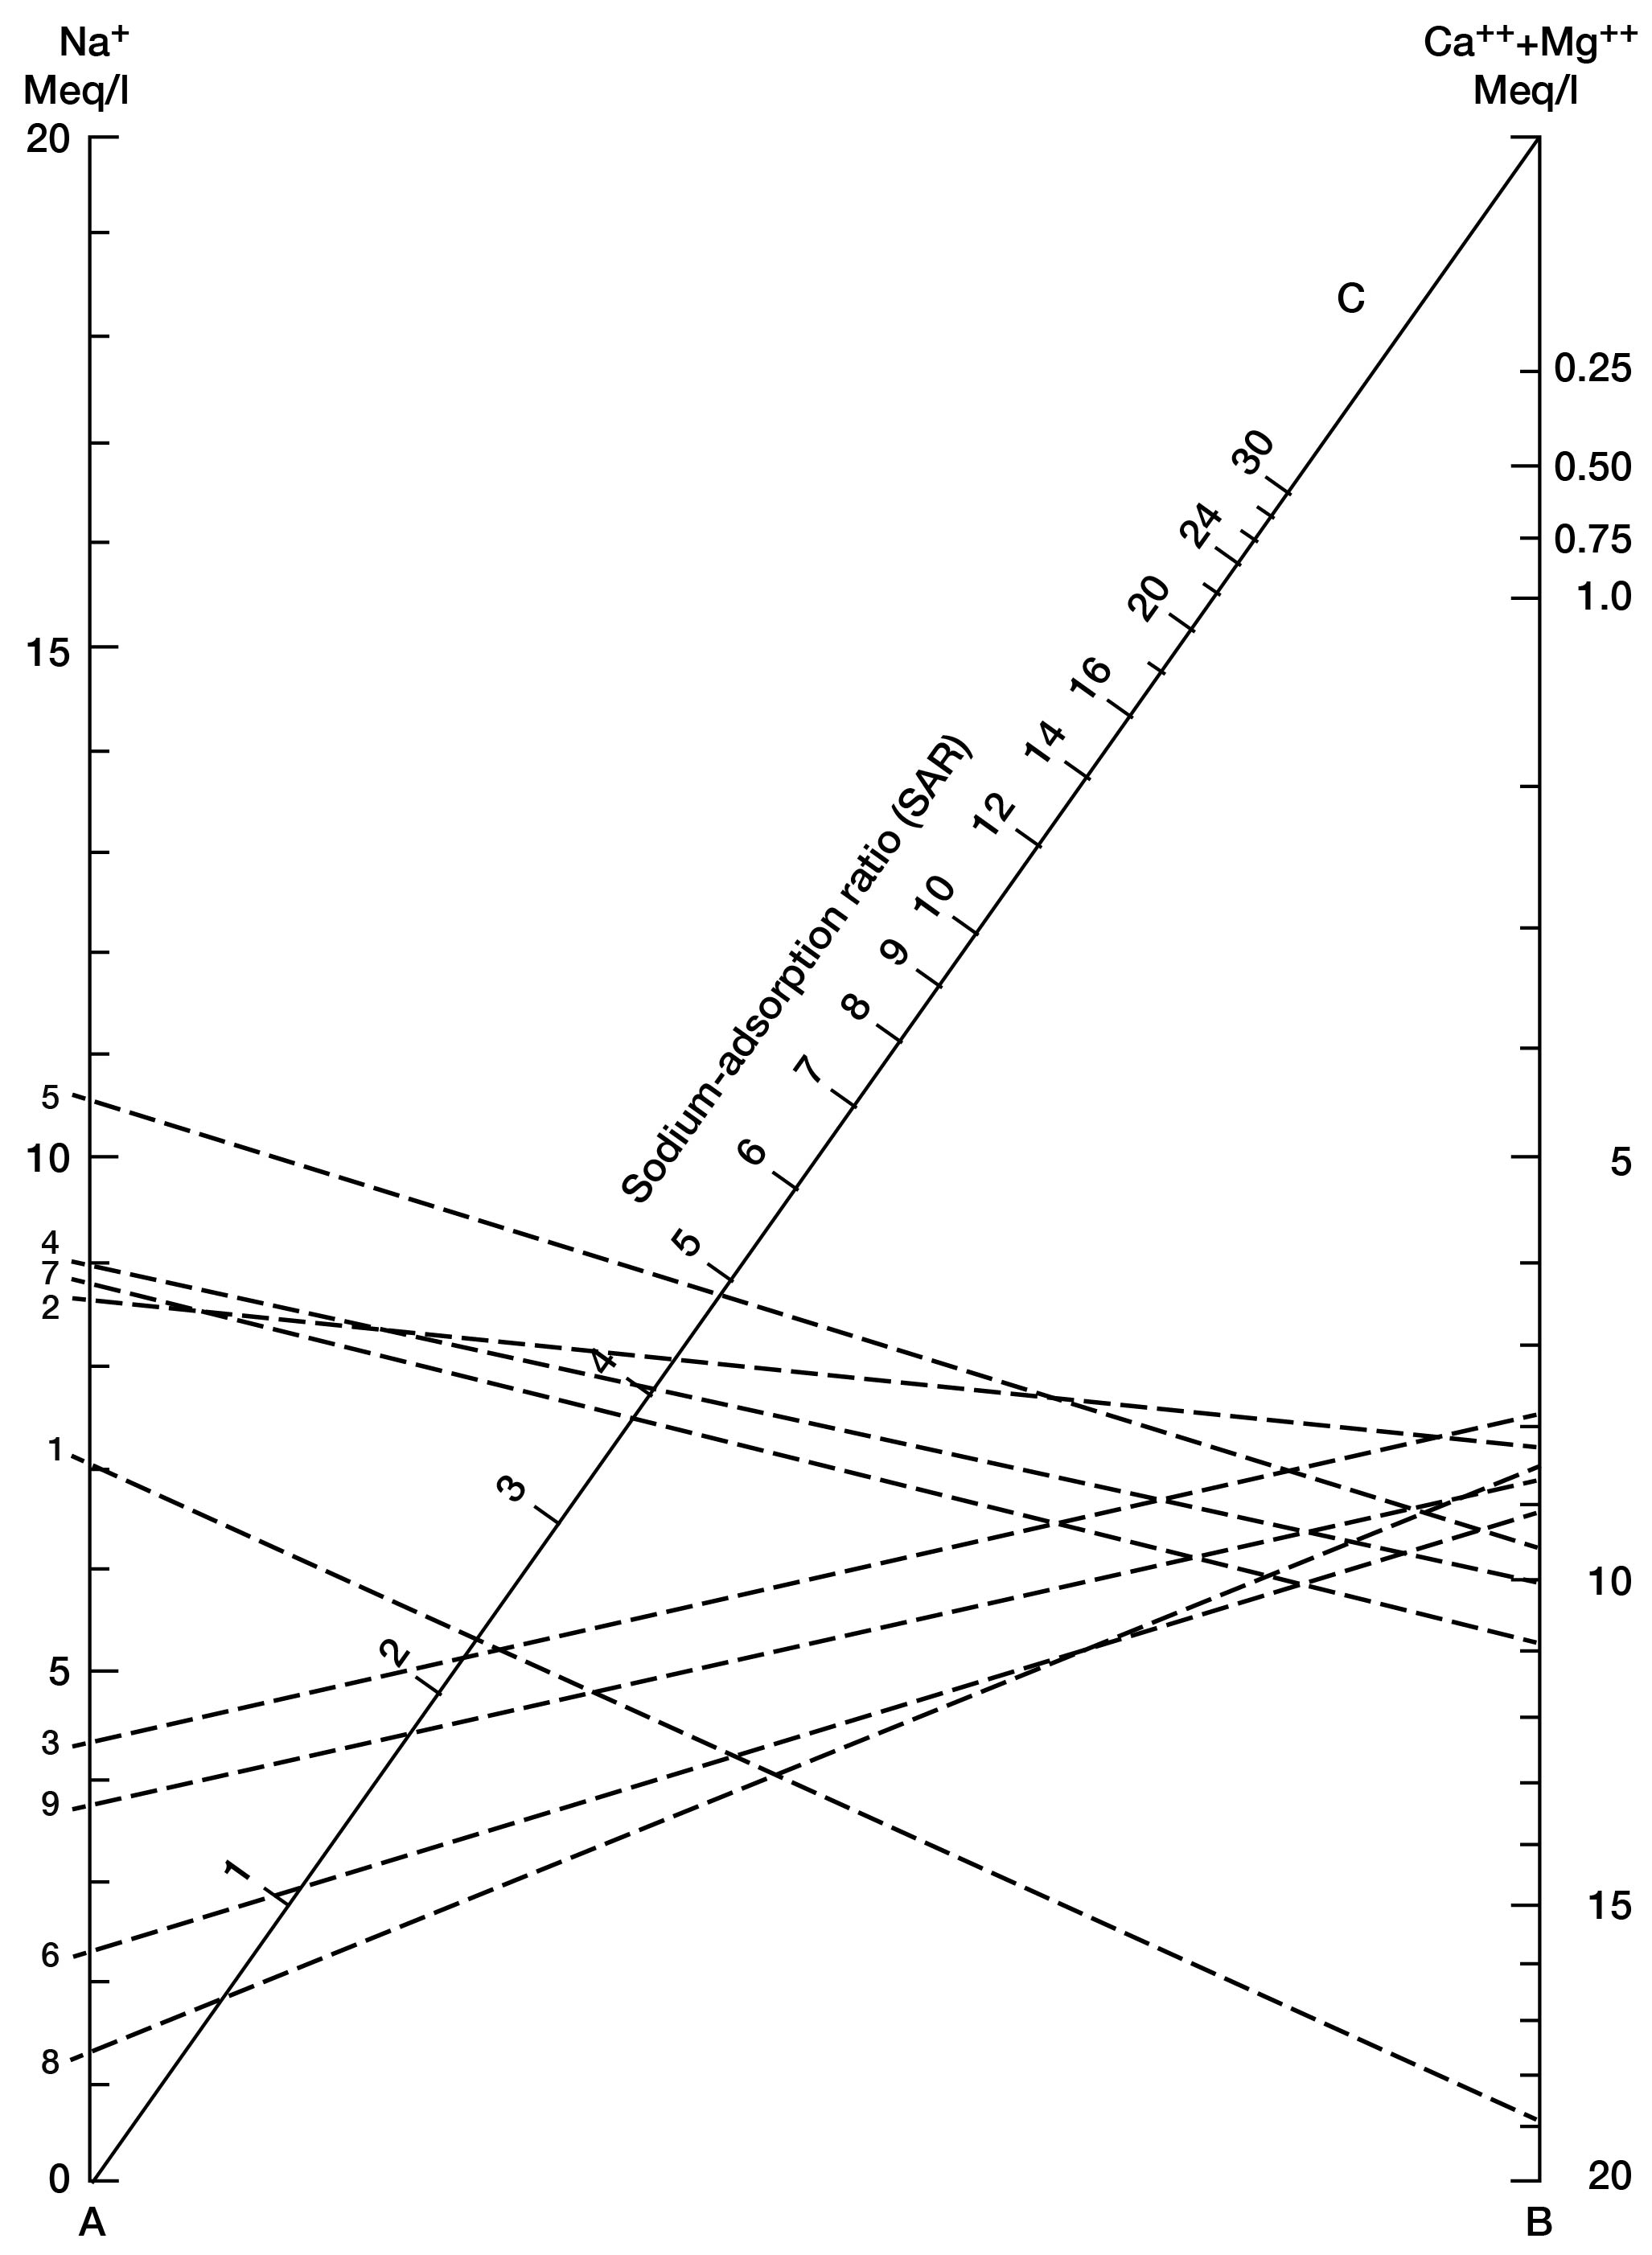
Figure 16--Classification of selected irrigation waters in Mitchell County.
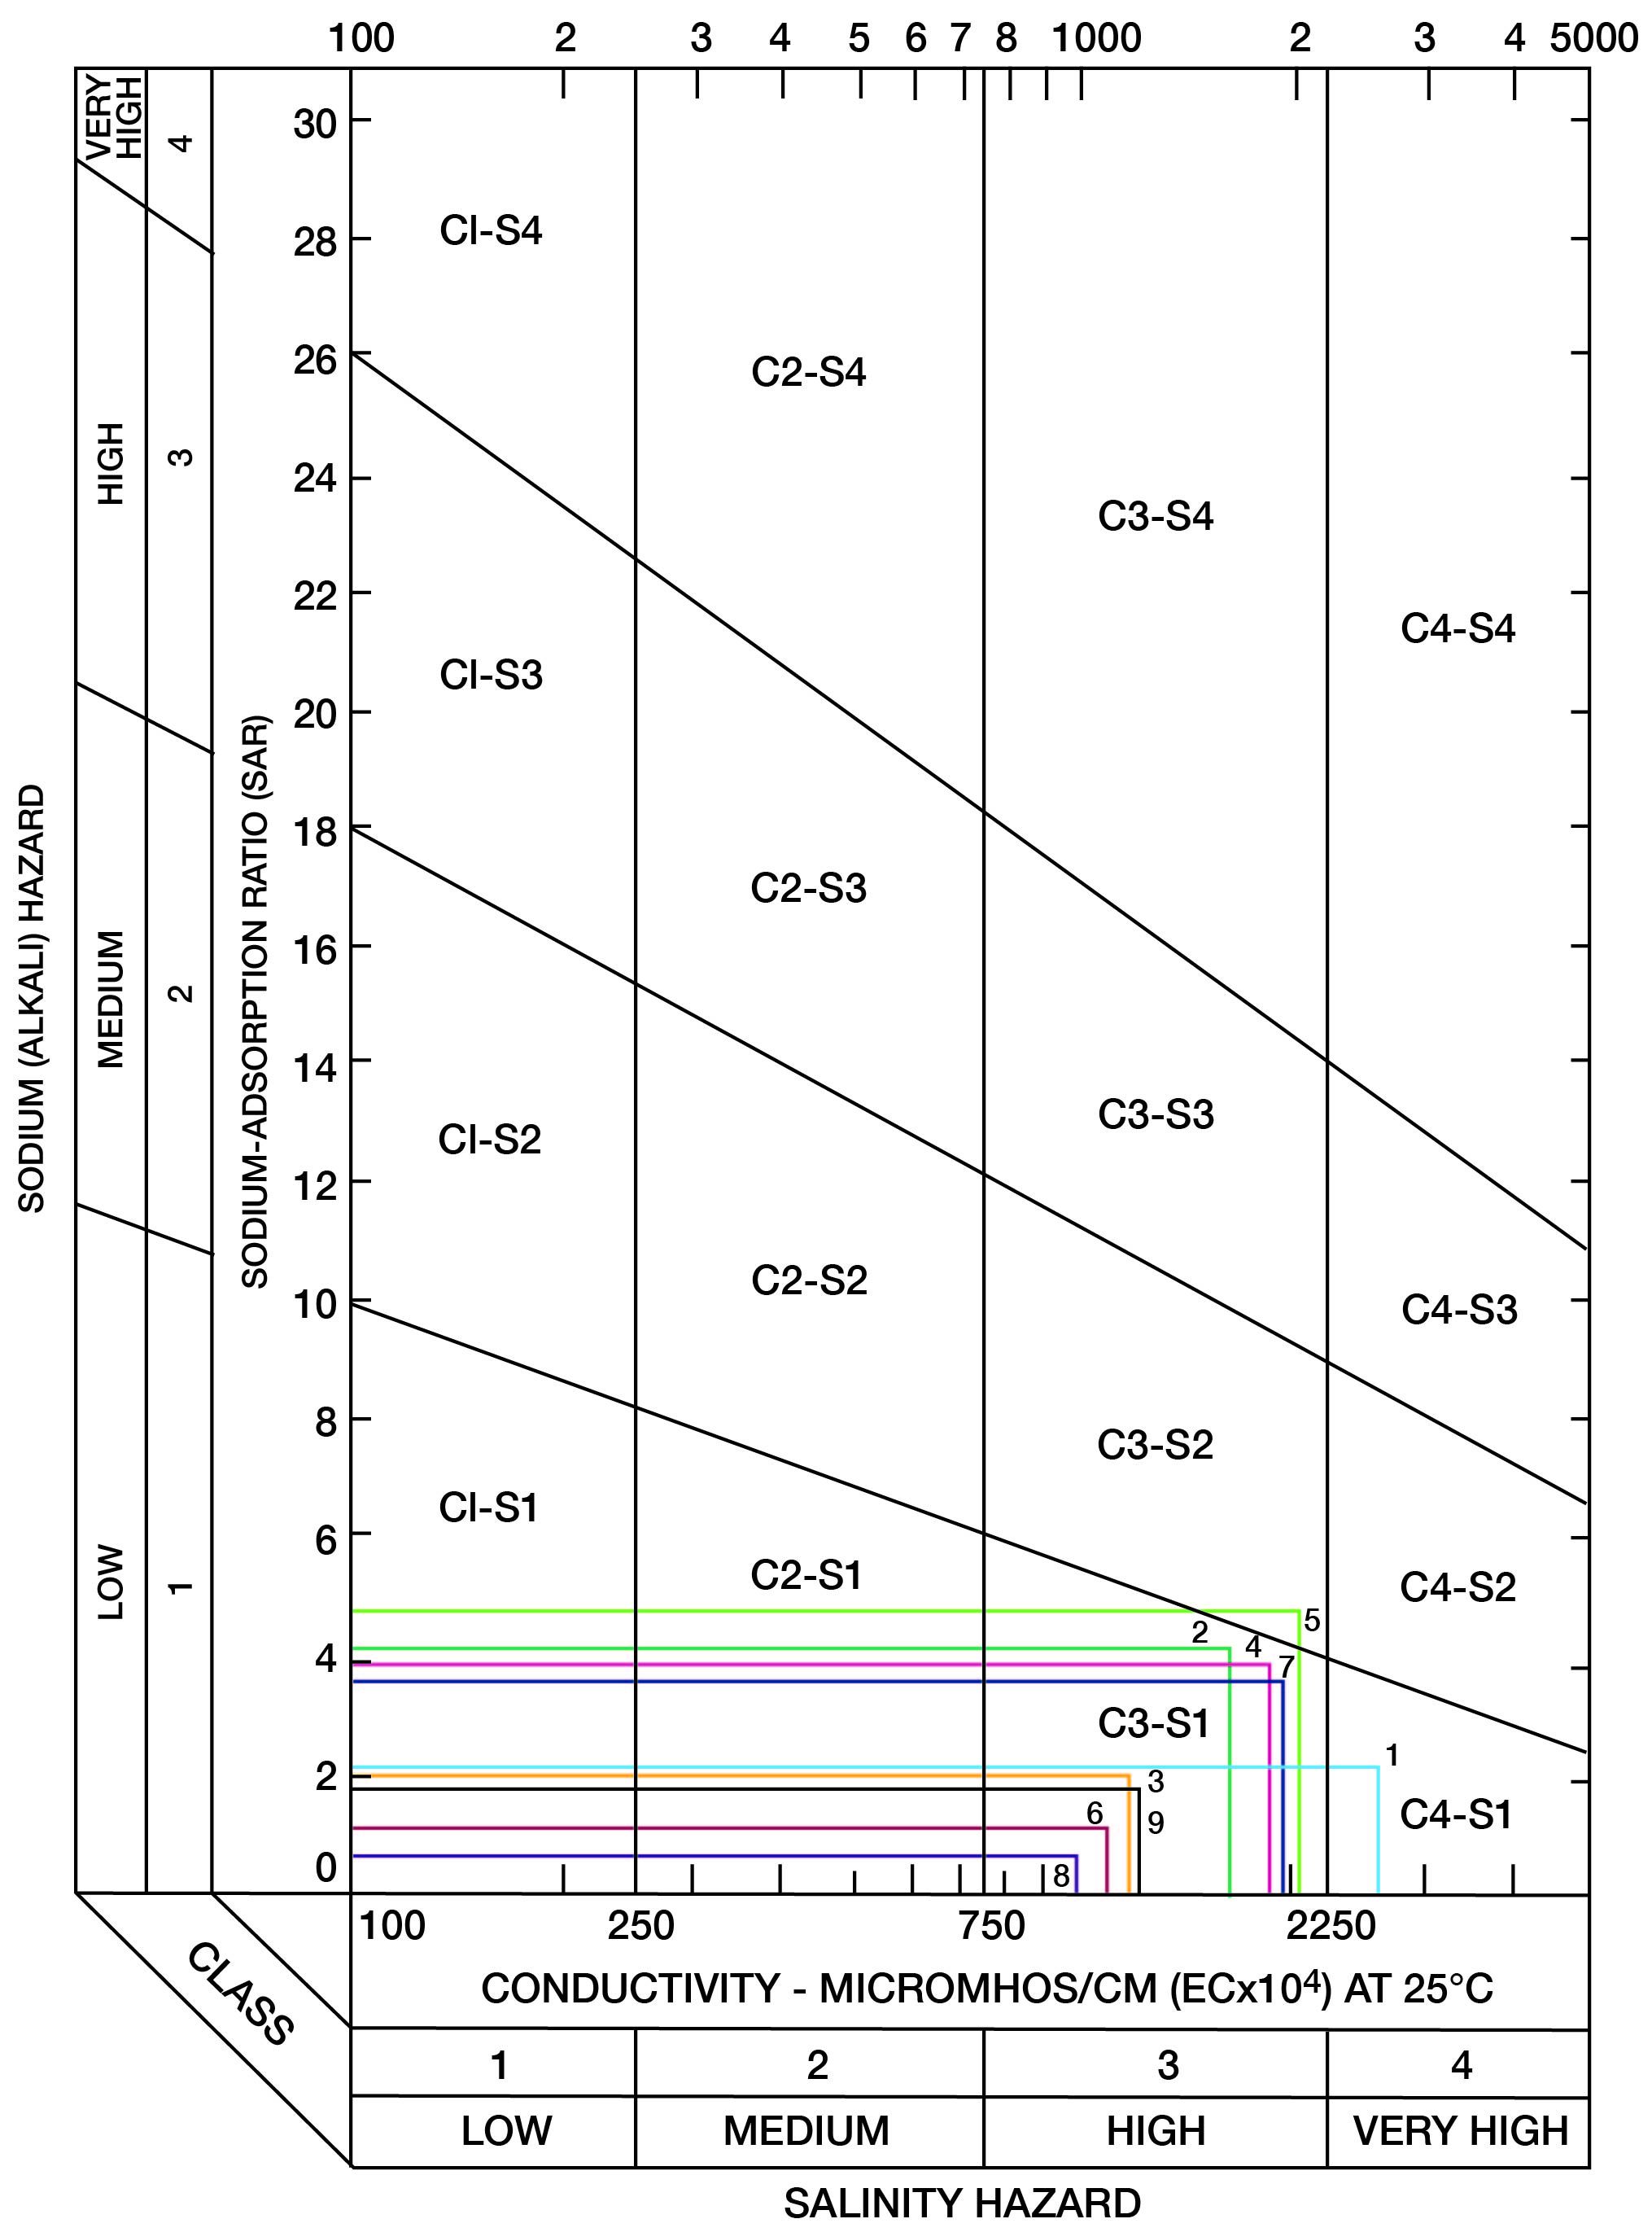
When the sodium-adsorption ratio and the electrical conductivity of a water are known, the suitability of the water for irrigation can be determined graphically by plotting these values on the diagram shown in Figure 16. Low-sodium water (S1) can be used for irrigation on almost all soils with little danger of the development of harmful levels of exchangeable sodium. Medium-sodium water (S2) may be used safely on coarse-textured or organic soils having good permeability, but S2 water will present an appreciable sodium hazard in certain fine-textured soils, especially under low-leaching conditions. High-sodium water (S3) may produce harmful levels of exchangeable sodium in most soils and will require special soil management such as good drainage, high leaching, and organic matter additions. Very high sodium water (S4) generally is unsatisfactory for irrigation unless special action is taken, such as addition of gypsum to the soil.
Low-salinity water (C1) can be used for irrigation of most crops on most soils with little likelihood that soil salinity will develop. Medium-salinity water (C2) can be used if a moderate amount of leaching occurs. Crops that tolerate moderate amounts of salt, such as potatoes, corn, wheat, oats, and alfalfa, can be irrigated with C2 water without special practices. High-salinity water (C3) cannot be used on soils having restricted drainage. Very high salinity water (C4) can be used only on certain crops and then only if special practices are followed.
Table 15--Analyses used in determining suitability of water for irrigation.
| Well number | Number used in Figures 16 and 17 |
Sodium-adsorption ratio, SAR |
Approximate conductivity |
|---|---|---|---|
| 6-8-32ccd | 1 | 2.25 | 2,550 |
| 6-9-30dab | 2 | 4.30 | 1,600 |
| 6-9-33acc | 3 | 2.15 | 1,150 |
| 7-6-20bdd | 4 | 4.00 | 1,825 |
| 7-6-32ddd | 5 | 4.85 | 1,950 |
| 7-6-36aab | 6 | 1.10 | 1,075 |
| 7-8-1adc2 | 7 | 3.75 | 1,875 |
| 7-10-3dda | 8 | 0.55 | 950 |
| 7-10-19add | 9 | 1.80 | 1,200 |
Prev Page--Ground water || Next Page--Geologic Formations
Kansas Geological Survey, Geology
Placed on web June 16, 2009; originally published April 1959.
Comments to webadmin@kgs.ku.edu
The URL for this page is http://www.kgs.ku.edu/General/Geology/Mitchell/05_gw2.html