Kansas Geological Survey, Chemical Quality Series 3, originally published in 1976
Originally published in 1976 as Kansas Geological Survey Chemical Quality Series 3. This publication is also available as an Acrobat PDF file (1 MB).
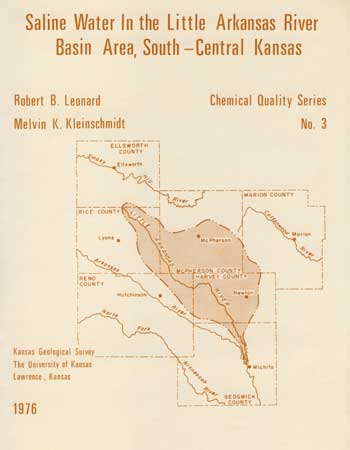
Ground water in unconsolidated deposits of Pleistocene age in part of the Little Arkansas River basin has been polluted by the influx of saline water. The source of the saline water generally is oil-field brine that leaked from disposal ponds on the land surface. Locally, pollution by saline water also has been caused by upwelling of oil-field brine injected under pressure into the "lost-circulation zone" of the Lower Permian Wellington Formation and, possibly, by leakage of brine from corroded or improperly cased disposal wells. Anomalously high concentrations of chloride ion in some reaches of the Little Arkansas River probably can be attributed to pollution by municipal wastes rather than from inflow of saline ground water.
Hydraulic connection exists between the "lost-circulation zone" and unconsolidated deposits, as evidenced by the continuing development of sinkholes, by the continuing discharge of saline water through springs and seeps along the Arkansas River south of the Little Arkansas River basin and by changes in the chloride concentration in water pumped from wells in the "lost-circulation zone."
The hydraulic head in the "lost-circulation zone" is below the base of the unconsolidated deposits, and much below the potentiometric surface of the aquifer in those deposits. Any movement of water, therefore, would be downward from the "fresh-water" aquifer to the saline "lost-circulation zone."
deposits of sand and gravel in the little arkansas river basin form one of the most productive aquifers in kansas. ground water from wells in the deposits is the principal water supply for all uses in the basin. withdrawals of ground water are expected to increase from about 88,000 acre-feet (110 hm3) in 1973 to about 210,000 acre-feet (260 hm3) in 2000 (kansas water resources board, unpub. data, 1972). the possibility that the reduction in hydraulic head associated with such a large increase in withdrawals might cause saline-water intrusion from underlying rocks of permian age is of concern to local water users and to state water-planning and management agencies. degradation in chemical quality of the fresh-water supply could inhibit continued economic growth in the area.
This study, made by the Kansas Geological Survey and the U.S. Geological Survey, analyzes available information and evaluates the potential for pollution of fresh water in the principal aquifer under the withdrawal pattern of the mid-1970's, especially in the area of the well field used by the city of Wichita for municipal water supply (fig. 1).
Figure 1--Location of Little Arkansas River basin and the well field used by the city of Wichita for municipal water supply.
The purpose of the study is to summarize information concerning the nature, areal distribution, and hydrology of permeable zones in the Permian rocks, and to analyze the hydraulic-head relation between the zones and the overlying alluvial aquifer. Data from chemical analyses of ground water and of low streamflow and data from water-level measurements in wells were evaluated to determine the hydraulic connection between aquifers.
In this report, water is classed generally in terms of dissolved-solids concentrations in mg/l (milligrams per liter). Fresh water is defined as having less than 1,000 mg/l dissolved solids, saline water is 1,000 to 35,000 mg/l, and brine is more than 35,000 mg/l.
The effects of saline-water intrusion from the underlying Permian rocks could be obscured by similar effects produced from other sources of saline water (table 1). For example, past practices for disposing of oil-field brine have introduced salts into the soil and alluvial aquifers, causing localized pollution of water supplies in the basin area. Therefore, it was necessary to draw pertinent information from an extensive body of published and unpublished data describing the geology; the recovery and storage of oil, gas, and salt; the disposal of municipal and industrial waste; and the quality, development, and use of water supplies.
Table 1--Potential sources of significant quantities of saline water, both natural and manmade, in the Little Arkansas River basin area.
Information was compiled from published comprehensive reports including those by Williams and Lohman (1949), Petri and others (1964), and a compendium of reports relating to the proposed storage of atomic wastes in the Kansas salt beds (Bayne and Brinkley, 1972). This information was supplemented by data obtained from published reports of limited scope and distribution; from files of government agencies and private industry; and from oral and written communications with individuals. Field data were collected only when required for interpretation of information from other sources. References to published information arc included in the comprehensive reports; therefore, duplication herein was deemed unnecessary.
Data from maps compiled by D. B. Richards (written commun., 1972) showing the configuration of the water table in the alluvial aquifers and of the underlying bedrock surface were used extensively for compilation and analysis of information. A generalized map showing the saturated thickness of Quaternary deposits also was compiled from data and maps by D. B. Richards (written commun., 1972) to expedite preparation of this report.
Acknowledgment of the efforts of each of many persons who have contributed information used in this report would be impractical. However, the authors are particularly grateful to Messrs. Ralph O'Connor and William Biegler, District Geologists for the Kansas Department of Health and Environment, for providing unpublished data, for suggesting potential sources of information, and for facilitating collection of additional basic data vital to the study. Their assistance in providing perspective that governed the selection and evaluation of pertinent data eliminated much fruitless and time-consuming research.
The system of numbering wells and test holes in this report is based on the U.S. Bureau of Land Management's system of land subdivision. The first number indicates the township; the second indicates the range west or east of the sixth principal meridian; and the third indicates the section in which the well is located. The first letter denotes the quarter section of 160-acre (65-hm2) tract; the second, the quarter-quarter section or 40-acre (16-hm2) tract; and the third, the quarter-quarter-quarter section or 10-acre (4-hm2) tract. The letters are designated a, b, c, and d in a counterclockwise direction beginning in the northeast quarter of the section. Where there is more than one well in a 10-acre (4-hm2) tract, consecutive numbers are added in the order which the wells are inventoried. For example 19-4W-34baa indicates a well in the northeast quarter of the northeast quarter of the northwest quarter of sec. 34, T.19 S., R. 4 W. (fig. 2).
Figure 2--Diagram showing the system of numbering wells and test holes in Kansas.
For those readers who are familiar with or are interested in the metric system, the English units of measurements given in this report also are given in equivalent metric units (in parentheses) using the following abbreviations and conversion factors:
| English unit | Multiply by | Metric unit |
|---|---|---|
| inch (in) | 2.540 | centimeter (cm) |
| foot (ft) | .3048 | meter (m) |
| mile (mi) | 1.609 | kilometer (km) |
| acre | .4047 | square hectometers (hm2) |
| square mile (mi2) | 2.590 | square kilometers (km2) |
| acre-feet (acre-ft) | 1.233 X 10⁻³ | cubic hectometers (hm3) |
| cubic feet per second (ft2/s) | .0283 | cubic meters per second (m3/s) |
| barrel (bbl) | .1590 | cubic meters (m3) |
Note: The classification and nomenclature of rock units used in this report are those of the Kansas Geological Survey and differ somewhat from those of the U.S. Geological Survey.
The relation of unconsolidated deposits to consolidated bedrock formations in the Little Arkansas River basin area is shown on the surficial-geologic map (pl. 1). Also shown are the locations of geologic sections that are pertinent to interpretation of subsurface geology.
In the vicinity of the Wichita well field (fig. 1), undifferentiated deposits of Pleistocene age (mostly alluvium) overlie bedrock units of Early Permian age. The alluvium consists primarily of heterogeneous, interfingered lenses of silt, clay, sand, and gravel; individual lenses do not extend over large areas. As much as 250 feet (76 m) of saturated alluvium occurs in a buried valley known as the McPherson channel and nearly 300 feet (91 m) of saturated alluvium occurs in an ancestral channel of the Arkansas River (pl. 2). Ground water in the alluvium is recharged by the infiltration of precipitation within the basin. Discharge of ground water from the alluvium is to streams, springs, wells, the underlying rocks of Permian age, and by evapotranspiration.
Ground-water movement in the alluvium of the basin generally is southeastward and southward toward the confluence of the Arkansas and Little Arkansas Rivers. Locally, water moves toward the channels of the Little Arkansas River and its major tributaries. In the southern part of the basin, water-level gradients adjacent to the major streams indicate that most of the streamflow during periods of little precipitation is contributed by inflow of ground water. At the northern end of the basin near McPherson, gradients indicate that some ground water moves northward into the Smoky Hill River drainage.
Rocks of Early Permian age that underlie the alluvium consist primarily of shale, gypsum, anhydrite, and salt; they represent (in ascending order) the Wellington Formation, Ninnescah Shale, and Stone Corral Formation of the Sumner Group. These rocks were deposited mostly under marine conditions when the sea was restricted in area and the climate was arid (Williams and Lohman, 1949, p. 78). Ground water in the Lower Permian rocks generally is highly saline water or brine occurring in solution channels and evaporite-solution breccias in the Wellington Formation. The water is recharged principally by leakage from the overlying alluvium and is discharged to streams and springs. Some recharge may be derived from precipitation on the outcrop area along the eastern margin of the basin and move down-gradient in the Permian rocks or laterally into the alluvium.
Locally, saline water is pumped from wells in the Wellington Formation for secondary recovery of oil and for displacement of liquified petroleum gas (LPG) stored in "jugs," or manmade solution cavities, constructed in salt beds in the Wellington.
In Reno County, the Wellington Formation can be divided in the subsurface into three members as shown by the type geophysical log in figure 3. The lowest part, termed the lower anhydrite member, consists of about 200 feet (61 m) of gray anhydrite and shale with several beds of dolomite. The middle part, the Hutchinson Salt Member, consists of about 350 feet (107 m) of salt with lesser amounts of shale and anhydrite. The uppermost part, termed the upper shale member, consists mainly of gray shale with thin beds of gypsum, anhydrite, dolomite, and siltstone. The upper shale member is reported to be about 250 feet (76 m) thick, but the upper contact may be questionable at some locations because the member contains red beds similar to those in the overlying Ninnescah Shale.
Figure 3--Part of type geophysical log for Reno County showing Sumner Group of Lower Permian Series, published by Kansas Geological Society, 1966.
Detailed logs and cores of the complete section of the Wellington Formation in Rice County, about 25 miles (40 km) west of McPherson, show the following ranges in thickness--lower anhydrite member, 137 to 168 feet (42 to 51 m); Hutchinson Salt Member, 269 to 281 feet (82 to 86 m); and upper shale member, 187 to 252 feet (57 to 77 m), although placement of the upper contact may be questionable. Abrupt truncation of the eastern edge of the salt, as shown by some authors (fig. 4), is ascribed to dissolution rather than to nondeposition or to facies change.
Figure 4--Location map and geologic section showing extent of area underlain by Hutchinson Salt Member of Wellington Formation (modified from Lee, 1956).
The Wellington Formation dips gently westward from the Little Arkansas River basin. If the thickness and composition of the formation had remained constant in the subsurface and the dip had extended uniformly, the Hutchinson Salt Member would have subcropped at the base of the unconsolidated aquifers and would have cropped out on the east side of the basin. Geologic section Y-Y', shown on figure 5, has been modified from Williams and Lohman (1949) to show the projected top of the Hutchinson Salt. The projected intersections with the bedrock surface are based on the assumption that the contact between the Wellington and overlying Ninnescah Shale, shown in published geologic sections, is correctly placed about 200 feet (61 m) above the salt. In the subsurface east of the McPherson channel and on the surface east of the basin, the salt is conspicuously absent.
Figure 5--Geologic section showing projected top of Hutchinson Salt Member of Wellington Formation (modified from section E-E', Williams and Lohman, 1949).
The primary porosity and permeability of the rocks of the Wellington Formation are characteristically low, but the included salt and anhydrite beds are soluble in fresh water. Where fresh water is in contact with evaporite beds, solution channels capable of transmitting large quantities of water can develop and grow as long as circulation is maintained.
Because wells drilled into the solution cavities generally result in a rapid loss of drilling fluids, local drillers and geologists use the term "lost-circulation zone." The term is used in this report to describe that interval within the Hutchinson Salt Member where the solution cavities commonly occur. The interval also has been called the "shallow disposal zone" owing to the large volumes of oil-field brines that formerly were discharged into the interval.
Test holes in the basin commonly penetrate shale and gypsum below the bedrock surface in the stratigraphic position where the Hutchinson Salt Member would be projected. North and west of the projected intersection of the Hutchinson Salt Member and the bedrock surface, shown on section Y-Y', dissolution and removal of the salt evidently was caused by ground-water circulation beneath the upper shale member of the Wellington.
Correlation of logs of oil wells (Lee, 1956) suggests that the shale settled on residual debris after dissolution and removal of all or part of the underlying salt and anhydrite, as shown on section W-W' in figure 6. This process of dissolution and collapse leads to formation of evaporite-solution breccias. Relatively thin, and probably discontinuous remnants of salt were reportedly identified beneath shale in the subsurface east of the McPherson channel on the basis of drillers' and geophysical logs according to Goebel (Bayne and Brinkley, 1972). The fine-grained residual debris that remains after partial dissolution of the salt may restrict the circulation of water and preserve the remainder of the salt.
Figure 6--Geologic section showing projected tops of Hutchinson Salt Member and lower anhydrite member of Wellington Formation (modified from Lee, 1956).
Drilling fluids commonly are lost in solution cavities at depths from about 350 to 550 feet (107 to 168 m) below land surface in or near the area of subsidence. This highly permeable interval or "lost-circulation zone" is of varying thickness and is observed at the stratigraphic position of the Hutchinson Salt Member.
The reported depth below land surface to the top of the "lost-circulation zone" generally increases southward from about 3.50 feet (107 m) near McPherson to about 550 feet (168 m) at the Arkansas River. The altitude of the top of the zone generally decreases from about 1,100 to 1,000 feet (335 to 305 m) above mean sea level, a difference of 100 feet (30 m), in the 3.5-mile (56-km) interval along the line of wells. The minimum altitude of the eroded surface of the Wellington Formation in the basin is about 1,160 feet (3.54 m) in the Wichita well field west of Halstead where the salt evidently has been removed (J. D. Winslow, written commun., 1971). Well records indicate that the "lost-circulation zone" does not intersect the bedrock surface anywhere in the basin.
Where the "lost-circulation zone" underlies oil fields, its limits are fairly well defined by the locations of shallow disposal wells; elsewhere the limits are questionable. According to oil-field workers, permeability in the Wellington Formation would be inadequate for disposal east of the county road between Burrton and McPherson. In a well drilled through the Wellington Formation into the underlying Chase Group about 1.5 miles (2.4 km) southeast of Burrton, the zone was reported to be absent. Logs of several wells drilled east of the existing disposal wells substantiate the reports. Solution evidently progressed until the remaining salt was unable to support the open structure, and the channels collapsed or were plugged with residual material that prevented the circulation of water.
Cursory examination of radioactivity logs of wells in the Burrton and Buhler oil fields revealed that the most permeable zones commonly appear near the top of the evaporite section, but these zones are not necessarily correlative from well to well. The top of the shallow disposal zone varied as much as 60 feet (18 m) among wells in the same mile-square section. Normally the disposal zone is overlain by about 200 feet (61 m) of fine-grained shale, which presumably is impermeable where the surface casings are set. Where part of the Wellington has been eroded, many of the logs indicate a layer of saturated shale or fine-grained residuum 60 to 100 feet (18 to 30 m) thick above the permeable zone.
North of the basin, supply wells in the "lost-circulation zone" withdraw as much as 1,000 barrels (158 m") of brine per day for repressurization of the deeper oil-producing zones in the Smolen-Salemburg field in Saline County. However, the total quantity of brine disposed into the zone before May 1970 exceeds the quantity subsequently withdrawn. In the Lindsborg field in McPherson County, about 5.5 million barrels (0.9 X 10⁶ m3) of brine had been injected into the zone by 1970 (W. Biegler, oral commun., 1973).
Brine also is withdrawn from wells in the "lost-circulation zone" to displace liquid hydrocarbons stored in manmade cavities, or "jugs," in salt sections (W. Biegler, oral commun., 1973). Near Conway, on the west side of the McPherson channel, more than 7 million barrels (1.1 X 10⁶ m3) of brine per year have been withdrawn for this purpose. Subsequent disposal of the brines has been by injection into rocks of the Arbuckle Group of Late Cambrian and Early Ordovician age at great depths below the "lost-circulation zone."
South of the basin, near Clearwater in Sedgwick County, large quantities of natural brine were withdrawn from wells in the "lost-circulation zone" for feedstock in a chemical plant that was producing chlorine and caustic soda. In about 1965, brine containing less impurities (calcium and magnesium) was obtained at less expense by solution-mining of the intact salt section west of the zone. The analysis of a sample of the natural brine from one of the wells near Clearwater is remarkably similar to the analysis of the brine from a water well near Conway about 70 miles (about 113 km) northwest (table 2). The natural brine wells near Clearwater were used as disposal wells until they became plugged with slurry containing carbonates and hydroxides of calcium and magnesium.
Table 2--Chemical analyses of brine from "lost-circulation zone" and of fresh water in the overlying unconsolidated aquifer west of McPherson. [Dissolved constituents and hardness given in milligrams per liter.]
| Well name and location |
Date of collection |
Temp. (°C) |
Dissolved silica (SiO2) |
Dissolved iron (Fe) |
Dissolved manganese (Mn) |
Dissolved calcium (Ca++) |
Dissolved magnesium (Mg++) |
Dissolved sodium (Na+) |
Dissolved potassium (K+) |
Carbonate (CO3--) |
Bicarbonate (HCO3-) |
Dissolved sulfate (SO4--) |
Dissolved chloride (Cl+) |
Dissolved fluoride (Fl-) |
Dissolved nitrate (NO3-) |
Dissolved solids (residue at 180°C) |
Hardness as CaCO3 | Specific conductance (micromhos/cm at 25°C) |
pH | Ratio of sodium to chloride |
|
|---|---|---|---|---|---|---|---|---|---|---|---|---|---|---|---|---|---|---|---|---|---|
| Total | Noncarbonate | ||||||||||||||||||||
| North Brine Well 2C near Clearwater 29-2W-261 |
6-18-57 | 27.9 | 0.05 | 3.5 | 985 | 1,250 | 122,000 | 80 | 6,660 | 188,000 | 319,000 | 6.1 | 0.65 | ||||||||
| Salt-Water Well 1 near Conway 29-4W-272 |
3-21-73 | 7.4 | 1,550 | 360 | 116,000 | 100 | 0.0 | 240 | 4,380 | 181,000 | 304,000 | 5,350 | 5,150 | 6.4 | .64 | ||||||
| Fresh-Water Well 2 near Conway 19-4W-342 |
3-21-73 | 15.0 | 20 | 3.0 | 0.08 | 114 | 29 | 47 | 3.4 | 0.0 | 415 | 120 | 290 | 0.2 | 0.2 | 566 | 404 | 64 | 890 | 7.3 | .16 |
| 1 H. V. Coates, Jr., Vulcan Materials Co., Oatville Kans., oral commun., 1973; (Specific gravity 1.205 @ 27.9°C). 2 Kansas Department of Health and Environment. |
|||||||||||||||||||||
Owing to the apparent lack of continuity between solution cavities within the Hutchinson Salt Member, it would be implausible to determine the direction of ground-water movement on the basis of well data. It is evident, however, that fresh water has moved downward from the alluvium through a permeable system, probably faults or fractures in the Wellington Formation, to cause dissolution of the salt. In the past, large quantities of the resulting brines probably moved out of the basin through similar permeable systems so that the weakened beds collapsed.
South of the Little Arkansas River basin, the Arkansas River and its tributaries have deeply eroded the Wellington Formation so that the confining layers over the "lost-circulation zone" appear to have been breached. High concentrations of chloride are contained in water from the alluvium along the Arkansas River. Saline-water springs issue from the Wellington Formation in Sumner County near Belle Plaine, Adamsville, and Geuda Springs (Walters, 1961). Highly mineralized water containing more than 32,000 mg/l of chloride from flowing wells in the NE of sec. 27, T.33 S., R.2 E. is believed to originate in the salt zone (R. E. O'Connor, oral commun., 1973). This area and the channel of the Arkansas River adjacent to it may represent the discharge area for water in the "lost-circulation zone" in the Little Arkansas River basin.
Upward movement of saline water from the "lost-circulation zone" into the alluvial aquifer could occur only if the hydraulic head in the zone is higher than the head in the overlying aquifer. Nearly simultaneous measurements of water levels in wells in the "lost-circulation zone" (locally termed salt-water wells) and in wells in the overlying alluvium (fresh-water wells) were compared at three sites in the basin during March and May 1973 (fig. 7). Measurements in the Burrton and Buhler fields were facilitated by Mr. Harold Millard of Tomlinson Oil Company, Wichita, who acidized the wells and altered the well-head fittings. Water levels in wells of Security Underground Storage, Inc., near Conway, are based on pressure readings in air tubes obtained with the assistance of Messrs. L. D. Stephenson, General Manager, and Jack O'Neill, Plant Superintendent. Records of measurements in wells located near Clearwater (29- 2W-2), were provided by Mr. H. V. Coates, Manager of Technical Process Engineering, Vulcan Materials Co., Oatville.
Figure 7--Measured and calculated water levels near Burrton, Buhler, and Conway.
At all the sites, the altitudes of water levels in the "lost-circulation zone" were higher than the reported top of the zone, but were lower than the bedrock surface and lower than water levels in the overlying alluvium (table 3). The configuration of the water table in the alluvium in the Little Arkansas River basin area is shown on plate 3.
Table 3--Water levels in wells penetrating the "lost-circulation zone" and the overlying unconsolidated aquifer at sites 1, 2, and 3.
| Location | Well1 | Altitude of land surface2 (feet) | Depth to top of "lost- circulation zone"3 (feet) | Altitude of top of "lost-circulation zone" (feet) | Depth to water level, "lost-circulation zone" (feet) | Altitude of water level "lost- circulation zone" (feet) | Highest water level of record, "lost-circulation zone" (feet) | Depth to fresh water (feet) | Altitude of fresh water level (feet) | Date of water-level measurements | Altitude of bedrock4 (feet) | Remarks |
|---|---|---|---|---|---|---|---|---|---|---|---|---|
| Site I near Burrton | Havry 1 23-4W-1BCA2 |
1460 | 470 | 990 | 190 | 1270 | 14 | 1446 | 3-21-73 | 1275 | Kansas Corporation Commission No. C-6034, injection depth 470 ft (143 m). Surface pipe cemented at 293 ft (89 m), injection string cemented to 465 ft (142 m). Well not used for 48 hours prior to measurement. Water well 5-inch (13-cm) casing about 100 feet (30 m) to south. | |
| Site 2 near Buhler | Mary Dodge 1A 22-5W-25ACA |
1520 | 500 | 1020 | 108 | 1412 | 23 | 1497 | 5-23-73 | 1430 | Injection depth 500 ft (152 m), surface pipe cemented at 135 ft (41 m). Water well (windmill) in 23-5W-24CDB. | |
| Site 3 near Conway | Oberst | 1492 | 354 | 1138 | 154 | 1338 | 1370 | 3-10-73 | All wells in site 3 are in well field for Security Underground Storage, Inc., near Conway. | |||
| Williams | 1488 | 360 | 1128 | 146 | 1342 | 3-10-73 | ||||||
| S1 | 1486 | 325 | 1161 | 3-10-73 | ||||||||
| S2 | 1486 | 359 | 1127 | 1115 | 13755 | 3-10-73 | ||||||
| S3 | 1488 | 350 | 1138 | 186 | 1302 | 3-10-73 | ||||||
| S4 | 1490 | 420? | 75 | 1415 | 3-10-73 | |||||||
| S5 | 1486 | 365 | 1121 | 173 | 1313 | 1349 | 72 | 1414 | 3-10-73 | 1394 | ||
| S6 | 1486 | 78 | 1408 | 3-10-73 | 1389 | |||||||
| S7 | 1482 | 359 | 1123 | 3-10-73 | ||||||||
| F1 | 1487 | 3-10-73 | ||||||||||
| F2 | 1487 | 3-10-73 | ||||||||||
| F3 | 1487 | 3-10-73 | ||||||||||
| 1 S, Salt-water supply well No. 1, etc.; F, = Fresh-water supply well No. 1, and so forth. 2 Altitudes determined from USGS 7 1/2-minute topographic maps. 3 Kansas Department of Health and Environment. 4 W. D. Winslow, written commun., 1972. 5 Static at drilling. |
||||||||||||
At site 1 in the Burrton field, the computed height of the potentiometric surface of the brine (hs) above the top of the "lost-circulation zone" in the salt-water well was 280 feet (85 m); the computed height of the water level in a fresh-water well in the alluvial aquifer (hf) was 456 feet (139 m) above the top of the zone; and the difference in hydraulic head (Δh) was 176 feet (54 m). Similarly, the differences in head were computed to be 85 feet (26 m) at site 2 in the Buhler field and 99 feet (30 m) at site 3 near Conway. In 1961, the static level of the brine in the well in sec. 26, T. 29 S., R. 2 W., south of the basin near Clearwater, was reportedly about 60 feet (18 m) lower than the water level in the overlying fresh-water aquifer and about 10 feet (3 m) below the bedrock surface (H. V. Coates, oral commun., 1973).
Where hydraulic connection exists between the fresh-water aquifer and the "lost-circulation zone," as indicated by the area of numerous sinkholes and surface depressions shown on plate 2, fresh water would move downward toward the zone with the lower hydraulic head. The measured water levels suggest that local drawdowns in the alluvium of at least 80 feet (24 m) or an equivalent increase in head in the "lost-circulation zone" would be necessary to induce saline water to flow upward into the fresh-water aquifers. If the head of brine in the "lost-circulation zone" is converted to that of fresh water based on the density of saturated salt water, however, the amount of drawdown or equivalent increase in head needed to induce intrusion would be smaller.
If it is assumed that water in the "lost-circulation zone" is saturated with salt and that water in the overlying rocks is fresh, the calculated difference in head between the zone and the fresh-water aquifer (Δhd) would be less than that computed in wells (Δh) having fluids of different densities. The specific gravity of water saturated with salt (NaCl) is about 1.17. Therefore, the calculated height of an equivalent column of fresh water (Δfc) above the zone would be 1.17 times greater than the computed height of a column of salt water.
Measurements at site 1 in the Burrton field show that the altitude of fresh water in the shallow aquifer was 1,446 feet (441 m). If the top of the "lost-circulation zone" at an altitude of 990 feet (302 m) is chosen as datum, the hydraulic head of the brine (hs) at an altitude of 1,270 feet (387 m) is 280 feet (85 m). Thus, the head in the fresh-water aquifer is 176 feet (54 m) higher than the head of the brine (Δh) in the zone. The calculated head (hfc) of a fresh-water column above the zone at this site is given by:
hfc = 1.17 hs
= 1.17 X 280
328 feet (100 m)
The measured fresh-water level (hf) in the shallow aquifer was about 4.56 feet (139 m) above datum, which is 128 feet (39 m) higher than the calculated head of a fresh-water column (hfc) above the "lost-circulation zone." The residual difference (Δhd) is the part of the total difference (Δh) not accounted for by density differences and probably represents head loss across the intervening beds. If there had been no recent disposal in the zone, the difference might have been larger.
Results of similar computations using measurements at site 2, in the Buhler field, show that the measured altitude of the fresh water in the alluvial aquifer was only about 18 feet (5 m) higher than the head of the equivalent fresh-water column above the "lost-circulation zone" calculated from density differences. By allowing for errors in assumptions regarding the depth to the permeable zone, the specific gravity of the waters, and continuity of water movement through fractured Permian rock, the system actually could be in static equilibrium in some parts of the basin. If the top of the "lost-circulation zone" is at an altitude of 912 feet (278 m) instead of the reported 1,020 feet (311 m), density differences alone could account for the difference in water level and hydraulic head of the two zones. In that case, a relatively small decrease in water level in the fresh-water aquifers or a small increase in head in the "lost-circulation zone" could reverse the apparent hydraulic gradient.
Active subsidence of the land surface along the west side of the McPherson channel from a point northeast of Conway southward to Colwich is cited by several authors as evidence for continued solution along the truncated eastern margin of the salt. Sinkholes and undrained depressions that are readily apparent on topographic maps and aerial photographs roughly delineate the extent of the solution zone in the subsurface (pl. 2). Abrupt northeastward deflections of the generally southeastward courses of the Little Arkansas River and other streams where they cross the solution zone (pl. 2) probably are not coincidental. These topographic features, which imply circulation of water within a permeable and porous evaporite sequence and continuing subsidence, began to form long before widespread pumpage of water and oil began. Many of the depressions pre-date historical record, but new sinks appear each year. Thousands of dollars have been spent in Saline, McPherson, Reno, Harvey, and Sedgwick Counties to realign roads, railroads, bridges, and pipelines offset by subsidence along the salt front (F. W. Wilson, Kansas Geological Survey, written commun., 1973).
Continued subsidence of the land surface implies circulation of ground water and consequent dissolution and transportation of large volumes of salt and gypsum. A minor part of the subsidence may represent washing of fine-grained material into the interstices of underlying channel sand and gravel, but most was initiated by solution. Data from oil wells revealed extensive development of secondary porosity and permeability in the evaporites in the subsurface near the truncated margin of the salt.
Most of the former disposal wells north of Burrton are near the center or on the steep west bank of the McPherson channel (pl. 2). South of the Little Arkansas River, the trend of these wells diverges southwestward across a saddle in the bedrock surface between Burrton and the Arkansas River. This saddle may reflect subsidence of the bedrock surface over the "lost-circulation zone." Although no disposal wells are known east of the trend, their absence may only reflect the absence of oil production. Sinkholes and larger undrained depressions there suggest active solution in the subsurface; therefore, additional study of available subsurface data to define the presence or absence of the "lost-circulation zone" between the line of disposal wells and the Wichita well field is warranted.
Site 3 is near the southern edge of a topographic depression (Big Basin) that encompasses more than 4 square miles (10 km2) as shown in figure 8. The depression probably was formed by subsidence resulting from dissolution of the underlying salt. Active subsidence suggests hydraulic connection between the unconsolidated deposits and the "lost-circulation zone," but chemical analyses of samples collected from fresh-water well 2 and salt-water well 1 in March 1973 (table 2) indicate no mixing of the fresh water with the brine. Instead, the head relations and topography suggest that the overlying fresh-water aquifers are a local source of recharge to the "lost-circulation zone."
Figure 8--Location of salt-water and fresh-water wells near Conway (Security Underground Storage, Inc.).
Changes in the salt content of water from wells in the "lost-circulation zone" suggest localized connection with the overlying fresh-water aquifers. When pumping begins, water from the wells is about 85 percent saturated with salt. With continued pumping it soon becomes saturated. The chemical analyses and hydrometer readings show that the assumed value for specific gravity of 1.17 used for calculation is valid. Lateral movement of salt water into the well bore evidently far exceeds the rate of local infiltration of fresh water into the aquifer. A thin layer of infiltrated fresh water probably overlies salt water in the "lost-circulation zone" until stratification is destroyed by turbulent mixing during pumping.
The ratio of sodium to chloride concentrations in the sample from salt-water well 1 was 0.64 (concentrations in mg/l), which is typical of water from the Permian rocks; it indicates that the water is unaffected by oil-field brine. Sodium-to-chloride ratios in oil-field brines normally are less than 0.50 (Leonard, 1964). Wells that previously discharged brine into the "lost-circulation zone" are located about 4 miles (6 km) south and about 10 miles (16 km) north of the well field.
More than 45 wells are known to have been used for shallow disposal of oil-field brine in the basin (pl. 2); most of them were drilled specifically for that purpose. Some abandoned oil wells were converted to disposal wells by perforation of the casing opposite permeable zones. In 1936, about 22,500 barrels (3,600 m3) of brine per day containing about 60,000 mg/l of chloride were discharged by 15 shallow disposal wells in the part of the Burrton field that is in the Little Arkansas River basin. However, none of the shallow disposal wells in the basin are in operation at present (1975), because State regulations require a minimum depth of 1,000 feet (305 m) for disposal of oil-field brine in this area.
The fluid column above the injection zone in the Wellington normally provided adequate head for gravity disposal of large volumes of brine into the formation. However, well-head pressure was applied in the Burrton area. Localized pollution of potable water in the overlying unconsolidated aquifers by upwelling of salt water around the casings of some wells was recognized in the late 1930's. At that time, the State ordered the use of pressure to be discontinued on wells injecting into the shallow zone. Pollution effects from this previous method of disposal apparently persist in the Burrton area.
Subsequently, most of the oil-field brine that was separated from oil produced in the basin was returned to the deep producing formations, but the use of a few shallow disposal wells continued until recent years. The shallow wells were checked periodically with vacuum gages to ascertain that the injection zone was accepting brine under gravity conditions. Negative readings of 15 to 30 inches (38 to 76 cm) of mercury during injection were common (R. E. O'Connor, written commun., 1973). Oil production in the basin is declining. As the casings became clogged with deposits of manganese and iron sulfides, the shallow disposal wells that could not be rejuvenated by acidification generally were abandoned and plugged. Use of several disposal wells was discontinued because solution of salt by injected brine or by leakage of ground water from the overlying aquifers apparently caused sinkholes at the sites. Some subsidence in the basin undoubtedly resulted from one or both of these causes, but a relatively infinitesimal part of the total subsidence above the solution zone seems to be man-induced.
Results of more than 4,500 chemical analyses of samples of ground water were compiled from private and public files to describe the areal, vertical, and chronological distribution of the ions. The data were recorded on digital tapes and punch cards to facilitate analysis and interpretation. Preliminary evaluation of the data, utilizing computer programs developed by D. V. Maddy and J. M.McNellis, reveals that a comprehensive description of water quality in the basin would be extremely difficult because of the manner in which water samples were collected for analysis.
With the exception of the Wichita area, where systematic sampling began in 1940, analyses are erratically distributed in time and space. Methods of collection and analysis of the samples varied widely, many sampling locations are poorly or inaccurately recorded, and the depth of the zones sampled commonly are poorly defined. Some of the most useful information consists of analyses of samples from municipal wells which were provided by the Kansas Department of Health and Environment (G. A. Stoltenberg, written commun., 1973). However, the samples were labeled according to local numbering systems that were not necessarily consistent from year to year. Even after organization and evaluation of the data, the locations where many of the samples were collected are questionable.
The natural waters from the unconsolidated aquifers in the basin normally contain less than 100 mg/l of chloride ion; therefore, higher concentrations commonly indicate the presence of oil-field brine or other pollutants. Calcium and bicarbonate are the principal ions in unpolluted water; high concentrations of sodium and chloride generally indicate pollution with oil-field brine. The concentration of chloride in samples from most of the municipal-supply wells in the basin was less than 50 mg/l. Notable exceptions include samples from Galva and Burrton where excessive concentrations of dissolved solids, mainly sodium and chloride, have caused abandonment of several wells. As late as 1972, the city of Burrton found it necessary to construct a new supply well about 2 miles (3.2 km) north of the original well field. At both Galva and Burrton the source of saline water appears to be oil-field brine introduced into the aquifers through surface ponds or shallow disposal wells several decades before stringent legislation regulating brine disposal had been enacted. Problems with excessive hardness, iron, and manganese have caused several other cities to seek new sources of ground water; however, low concentrations of chloride suggest that these problems are unrelated to intrusion from the "lost-circulation zone" or to pollution from oil-field brine.
The configuration and position of the regional water table in the unconsolidated aquifers (pl. 3) suggest that water containing high concentrations of dissolved solids west of the Wichita well field in the vicinity of Burrton might move into the supply wells. To evaluate that possibility, the city of Wichita established outpost wells upgradient from the well field. Chemical analyses by city personnel of samples collected periodically from the outpost wells and the city wells (D. Withrow, written commun., 1972) show that the concentration of chloride in samples from some wells in and adjacent to the western part of the field fluctuated widely and varied with depth.
Maximum concentrations of chloride measured during various periods since 1935 and the trend of changes in concentration from 1966-72 are shown with reported sampling depths in plate 4. Most of the samples from municipal wells probably represent a mixture of waters from various zones. In general, the concentration of chloride increased with depth in the unconsolidated aquifer. The relation could be caused by upward movement of saline water through natural fractures in the bedrock or through wells. However, stratification due to the infiltration of dilutant rainfall and to the greater density of saline water than that of fresh water is more probable. In the vicinity of disposal ponds, the highest concentrations of chloride normally occur near the surface (Williams and Lohman, 1949). Because of the inhomogeneity of the unconsolidated deposits, high concentrations of saline water in the affected aquifers can occur anywhere in the saturated section.
In the area adjacent to the western part of the well field (fig. 9) relatively high concentrations of chloride (100 to 500 mg/l) are increasing with time as a result of lateral migration of saline water from the vicinity of the Burrton field and from the Arkansas River valley. However, in the areas of greatest drawdown in the Wichita field (1940-72), the maximum concentrations of chloride did not increase appreciably. In some parts of the field, such as northwest of Bentley, the concentrations have decreased slightly.
Figure 9--Water-level changes in Wichita well field, 1940-72, and maximum chloride concentrations during 1938-45 and 1965-72.
The geologic section shown in figure 10 is approximately parallel to the direction of maximum slope of the water table in the fresh-water aquifer. The location map (fig. 11) shows the relation of disposal wells, active sinkholes, the approximate boundary of the salt (according to Kulstad, 1959), and the apparent eastward movement of the isochlor representing 200 mg/l of chloride. Also shown are locations of five recommended sites for test holes to further sample the "lost-circulation zone." High concentrations of chloride in samples collected from wells over the depression in the bedrock surface west of Burrton may represent saline water from the underlying "lost-circulation zone" that intruded the fresh-water aquifers when brine reportedly was injected under pressure several decades ago.
Figure 10--Geologic sectionn through Burrton and Wichita well field showing relation of water table to potentiometric surface of "lost-circulation zone" (modified from Stramel, 1967).
Figure 11--Location and relation of disposal wells, sinkholes, approximate boundary of salt, and eastward movement of chloride along section X-X'.
Unless the level of water in the "lost-circulation zone" is appreciably lower in the line of the section (fig. 10) than where it was measured about 3 miles (4.8 km) to the north, it is higher than the bedrock surface in the depression west of Burrton and higher than the bedrock surface of the Wichita well field. However, since 1940 at least, the altitude of the water table in the fresh-water aquifers apparently remained well above the measured potentiometric surface of water in the "lost-circulation zone." Oil-field brine introduced into the aquifer by discontinued disposal practices probably accumulated in the depression as a result of the density difference between brine and fresh water. Reports of lack of permeability in the section penetrated by salt-water disposal well (SWD-1) and nearby test holes indicate that the "lost-circulation zone" is absent under the Wichita well field east of the boundary shown in figure 11. Even if the zone were present beneath the well field, maximum drawdowns probably would have been insufficient to reverse the hydraulic gradient and induce intrusion of significant quantities of saline water.
Movement of saline water down the natural ground-water gradient probably was accelerated toward the well field along the steeper gradients that resulted from pumpage in 1940-72. However, the maximum drawdown shown in figure 10 for January 1955, during a period of drought, represented only a small part of the thickness of the saturated section. Recharge from precipitation on the expanding area influenced by pumping appears to have been adequate to dilute the saline water and prevent significant deterioration of water quality. Low concentrations of chloride in the areas of maximum drawdown substantiate Stramel's (1967) suggestion that withdrawals from storage represent only a small part of the total water withdrawn by wells.
Low streamflow of the Little Arkansas River and its tributaries consists mainly of effluent ground water, presumably from the upper part of the fresh-water aquifers. Results of nine seepage-salinity surveys made during 1960-72 by the U.S. Geological Survey and various State agencies show that the concentrations of chloride at many stations along the river exceeded 250 mg/l, the maximum concentration recommended for drinking water by the Kansas Department of Health and Environment. Discharge measurements were made and water samples were collected during the surveys at the sites shown on plate 5. To relate the quantity and quality of inflow to natural and manmade sources of saline water, the data were compiled and prepared for analysis using a computer program (Seepsal) developed by Leonard and Morgan (1970).
Natural waters in the well-leached unconsolidated aquifers in the Little Arkansas River basin generally contain less than 500 mg/l dissolved solids, of which calcium and bicarbonate are the predominant ions. High concentrations of chloride, a change from calcium bicarbonate to sodium chloride type water, and a gain in the chloride discharge in or immediately downstream from the reach underlain by the "lost-circulation zone" would suggest contributions of salt water from the zone. Conversely, losses of chloride discharge in the reach might suggest infiltration of river water into the zone.
Figure 12 shows that although the concentrations of chloride varied widely from survey to survey, the highest concentrations generally were in the vicinity of the reach between river miles 60 and 80, presumably underlain by the "lost-circulation zone" (pl. 2). Figures 13 and 14 show that sodium and chloride were predominant ions in the same reaches. Although the stations were too widely separated to define the precise reaches in which changes occurred, the maximum concentrations apparently occur upstream from the "lost-circulation zone," near the mouths of tributaries draining old oil fields.
Figure 12--Concentrations of chloride at stations along Little Arkansas River during seepage-salinity surveys, 1960-72.
Figure 13--Percentage cations at stations along Little Arkansas River during seepage-salinity surveys, 1969-72.
Figure 14--Percentage anions at stations along Little Arkansas River during seepage-salinity surveys, 1969-72.
Profiles showing the measured water discharge at the stations as percentages of the water discharge at Valley Center (station 17.5) were relatively parallel from survey to survey (fig. 15). There is no evidence of a significant increase or decrease where the river crossed the "lost-circulation zone." Similar profiles for the chloride discharge or load (fig. 16) differed greatly as a result of the variable concentrations and variable inflow showing no localized increase or decrease near the zone. The concentration of chloride in the river generally decreased downstream from Buhler (river mile 68.1) as a result of dilutant inflow, but the chloride discharge generally continued to increase in a downstream direction to Halstead (river mile 41.6). The sources of chloride in the stream evidently are diverse.
Figure 15--Water discharge at stations along Little Arkansas River as percentage of discharge at station 17.5 (Valley Center) during seepage-salinity surveys, 1960-72.
Figure 16--Chloride discharge at stations along Little Arkansas River as percentage of chloride discharge at station 17.5 (Valley Center) during seepage-salinity surveys, 1960-72.
Although the water discharge increased between river miles 41.6 and 35.2, the chloride discharge (load) decreased in the reach during five of the surveys (fig. 16). Because chloride is a relatively inert ion under the conditions encountered during the surveys, the concomitant gains of water discharge and losses of chloride discharge suggest that river water could have been withdrawn from the channel in the reach and replaced by a large quantity of tributary inflow containing a small chloride load. The ground-water gradient, however, indicates that pumpage in the adjacent Wichita well field may greatly reduce the amount of inflow from the west so that most of the gain in water discharge was from tributary inflow.
To evaluate the relative pollutive effects from the various drainage areas during each survey, the percentage of chloride discharge contributed at each station was divided by the percentage of drainage area of that station, and both percentages are referred to similar quantities describing the station on the river at Valley Center (17.5). The quotient is a dimensionless number termed the chloride-yield index (Leonard, 1972).
Yield indexes greater or less than 1 indicate that the corresponding drainage areas contributed a greater or lesser amount of chloride load per unit area than the average chloride load for the basin, as represented by the station at Valley Center. The maximum yield indexes of chloride computed from the 1960-72 seepage-salinity surveys are shown on plate 5. The chemical quality and chloride load in water discharged from the basin during the surveys are indicated by the analyses of samples from the river at Valley Center (table 4).
Table 4--Chemical analyses of water samples from the Little Arkansas River at Valley Center during seepage-salinity surveys. [Dissolved constituents given in milligrams per liter. Analyses by Kansas Department of Health and Environment.]
| Date of collection |
Discharge (cfs) |
Temp. (° C) |
Dissolved solids (residue at 180° C) |
Dissolved silica (SiO2) |
Dissolved calcium (Ca) |
Dissolved magnesium (Mg) |
Dissolved sodium (Na) |
Dissolved potassium (K) |
Bicarbonate (HCO3) |
Dissolved sulfate (SO4) |
Dissolved chloride (Cl) |
Dissolved fluoride (F) |
Dissolved nitrate (NO3) |
Dissolved phosphate (PO4) |
Specific conductance (micromhos/ cm at 25° C) |
pH units |
Chloride load (tons/day) |
|---|---|---|---|---|---|---|---|---|---|---|---|---|---|---|---|---|---|
| 9-21-60 | 79 | ---- | 482 | 17 | 87 | 17 | 66 | ---- | 293 | 52 | 93 | 0.3 | 5.3 | ---- | 880 | 7.6 | 19.8 |
| 11-21-68 | 84 | 8.0 | 528 | 22 | 98 | 15 | 64 | 6.0 | 288 | 67 | 95 | .3 | 4.9 | 2.2 | 860 | 7.7 | 21.5 |
| 11-13-69 | 55 | 9.0 | 648 | 18 | 100 | 17 | 97 | 7.6 | 307 | 62 | 160 | .4 | 4.0 | 4.0 | 1070 | 7.9 | 23.8 |
| 9- 3-70 | 19 | ---- | 445 | 14 | 81 | 16 | 56 | 4.8 | 320 | 43 | 56 | .4 | 2.7 | 1.8 | 720 | 7.8 | 2.9 |
| 4-15-71 | 46 | 13.5 | 728 | 10 | 110 | 21 | 130 | 6.7 | 307 | 60 | 220 | .4 | 1.8 | 1.8 | 1230 | 7.9 | 27.3 |
| 10- 1-71 | 24 | 20.5 | 450 | 18 | 77 | 12 | 61 | 6.2 | 278 | 51 | 69 | .3 | 1.8 | 3.0 | 710 | 7.6 | 4.5 |
| 12- 7-71 | 61 | 5.5 | 592 | 30 | 96 | 17 | 80 | 6.8 | 273 | 62 | 140 | .4 | 7.5 | 2.8 | 960 | 7.8 | 23.1 |
| 10- 6-72 | 25 | 15.0 | 640 | 20 | 100 | is | 94 | 5.8 | 315 | 60 | 160 | .4 | 1.8 | 6.7 | 1080 | 7.7 | 10.8 |
| 11- 7-72 | 53 | 6.0 | 371 | 16 | 64 | 10 | 45 | 7.8 | 188 | 38 | 73 | .5 | 5.3 | 1.9 | 620 | 7.2 | 10.4 |
Drainage areas contributing a disproportionate part of the chloride load to the river (yield index greater than 1) generally include oil fields or municipal sewage plants. In general, high chloride-yield indexes were coincident with a similarly high water-yield index where municipal effluent appreciably affected the quantity of streamflow. The highest chloride-yield index, ranging from about 20 to 40, was computed for Sand Creek (Rice County). This stream, which drains an area known to have been highly polluted with oil-field brine, probably is the source of the high chloride concentrations measured in the river near Buhler.
In the adjacent Walnut River basin, the ratio of the concentration of sodium plus potassium to the concentration of chloride (both concentrations in milligrams per liter) in most oil-field brines was about 0..5 (Leonard, 1964). Excluding potassium, the ratio would have been slightly lower. In brines from the "lost-circulation zone" the ratios are about 0.6 (table 2), and in sewage effluent they are normally even larger. Ranges for sodium-to-chloride ratios are shown with the corresponding yield indexes on plate 5. Abnormally high ratios at stations below McPherson and Newton suggest municipal effluent. Ratios of less than 0.5 that correspond with yield indexes greater than 2 are indicative of oil-field brine. There is slight evidence from the seepage-salinity surveys that the "lost-circulation zone" is contributing significant quantities of saline water to the river. If so, the effects of the zone are obscured by an influx of larger quantities of residual salts from oil-field brine or of effluent from other sources. If the sites had been more closely spaced, if data had been collected at the same sites during consecutive surveys, and if the surveys had been made only during periods of stable base flow, the value of the surveys would have been greatly enhanced.
Bayne, C. K., 1956, Geology and ground-water resources of Reno County, Kansas: Kansas Geol. Survey, Bull. 120, 130 p. [available online]
Bayne, C. K., and Brinkley, Dwight, 1972, Geology, hydrology, thickness and quality of salt at three alternate sites for disposal of radioactive waste in Kansas: University of Kansas Center for Research, Inc., Lawrence, Kansas, 63 p.
Fader, Stuart W., and Morton, Robert B., 1975, Ground water in the Middle Arkansas River basin, Kansas and Oklahoma: U.S. Geol. Survey open-file report.
Fent, O. S., 1950, Geology and ground-water resources of Rice County, Kansas: Kansas Geol. Survey, Bull. 85, 142 p. [available online]
Kulstad, R. O., 1959, Thickness and salt percentage of the Hutchinson salt; in, Symposium on geophysics in Kansas, W. W. Hambleton, ed.: Kansas Geol. Survey, Bull. 137, p. 241-247. [Available online]
Lee, Wallace, 1949, Subsurface geologic cross section from Barber County to Saline County, Kansas: Kansas Geol. Survey, Oil and Gas Invest. No. 8, 16 p.
Lee, Wallace, 1956, Stratigraphy and structural development of the Salina basin area: Kansas Geol. Survey, Bull. 121, 167 p. [available online]
Leonard, R. B., 1964, A method for evaluating oil-field brine pollution of the Walnut River in Kansas: U.S. Geol. Survey, Prof. Paper 501-B, p. B173-B176.
Leonard, R. B., 1972, Chemical quality of water in the Walnut River basin, south-central Kansas: U.S. Geol. Survey, Water-Supply Paper 1982, 113 p. [Available online]
Leonard, R. B., and Morgan, C. O., 1970, Application of computer techniques to seepage-salinity surveys in Kansas: Kansas Geol. Survey, Spec. Distrib. Pub. 47, 44 p.
Petri, L. R., Lane, C. W., and Furness, L. W., 1964, Water resources of the Wichita area, Kansas: U.S. Geol. Survey, Water-Supply Paper 1499-I, 69 p. [Available online]
Stramel, G. J., 1967, Progress report on the ground-water hydrology of the Equus-beds area, Kansas--1966: Kansas Geol. Survey, Bull. 187, pt. 2, 27 p. [Available online]
Walters, K. L., 1961, Geology and ground-water resources of Sumner County, Kansas: Kansas Geol. Survey, Bull. 151, 198 p. [available online]
Williams, C. C., and Lohman, S. W., 1949, Geology and ground-water resources of a part of south-central Kansas, with special reference to the Wichita municipal water supply: Kansas Geol. Survey, Bull. 79, 455 p. [available online]
Kansas Geological Survey
Placed on web Oct. 12, 2012; originally published in 1976.
Comments to webadmin@kgs.ku.edu
The URL for this page is http://www.kgs.ku.edu/Publications/Bulletins/CQS3/index.html