| Original published in W.W. Hambleton, ed., 1959, Symposium on Geophysics in Kansas: Kansas Geological Survey, Bulletin 137, pp. 241-247 | ||
State Geological Survey of Kansas
The complete article is available as an Acrobat PDF file, with Plate 1 available separately.
This paper includes a thickness and salt-percentage map of the Hutchinson salt member of the Wellington formation (Permian). Isopachous lines are on a 50-foot contour interval; salt percentage is shown on a 20 percent interval. The various kinds of well logs that served as sources of data for compilation of the map are discussed and compared.
Salt presents the seismologist with one of the most vexing problems he may encounter in seismic studies in Kansas. It has a much greater seismic velocity than most other sedimentary rocks, and its density and thickness may change abruptly from one shot point to the next. In areas underlain by salt, conventional seismic maps on horizons below the salt may be in error because of these changes. Glover (1953), in a summary of the problems of reflection seismograph work in Kansas, discussed the use of time-interval maps as a partial solution to the problem of change in thickness and velocity in the Wellington salt.
For a large area in the central part of the state the Hutchinson salt member of the Wellington formation (Permian) is the only subsurface bed of salt. It has long been recognized that a map showing thickness of the salt would be invaluable to the seismologist. A thickness and salt-percentage map. of the Wellington salt member (Plate 1) was prepared, therefore, as a eontribution to geophysical investigations. A more extensive study of the Wellington salt is in progress.
It should be recognized that there are salt beds above the Hutchinson salt member in the Sumner and Nippewalla Groups of southwestern Kansas, particularly in the Hugoton Embayment. Widess (1952) has discussed the problem of lateral variation in seismic velocity of the Blaine and Cimmaron (Stone Corral) salts in the Hugoton Embayment. In areas where there are other salt beds above the Wellington, the map cannot be used for determination of total salt in the section and hence is less useful for solution of seismic problems in such areas.
Because salt is very soluble, the Hutchinson salt is found only in the subsurface. Therefore, studies must be based on subsurface information from mines and drill holes. Mines are important because there the salt can be observed in place, but only three mines are in operation at present, and they are located near the eastern margin of the salt body. Thousands of holes have been drilled through the Hutchinson salt in the search for oil, however. The usefulness of drill-hole data for salt study depends upon the method of drilling and the types of investigation made in the drilled hole. Cable-tool and rotary samples, drillers logs, and "electric" logs are the principal sources of hole information.
The cable-tool drill is a percussion tool, which produces rock chips as it penetrates rock. These rock chips, which are bailed from the hole, are the well samples used in geologic studies. Where the cable tool encounters salt, water at the bottom of the hole becomes salt saturated, and the salt chips are not dissolved. Thus, many cable-tool holes have yielded good samples of Hutchinson salt.
A rotary drill penetrates rock by the grinding action of a rotating bit. The bit is lubricated and cooled by drilling mud, which is pumped from the surface to the bottom of the hole and back to the surface, carrying the chips of rock formed during the drilling process. Where the rotary drill encounters salt, most of the salt is dissolved because the drilling mud circulates and does not become saturated. It is unlikely that any undissolved salt chips would survive a long wait in a wet sample bag or the washing necessary for subsequent examinations and storage.
Rotary drilling generally does not yield salt samples, but may be a valuable source of salt information because anhydrite occurs within the salt and survives the drilling process. The highest occurrence of anhydrite particles, which have been deposited contemporaneously with halite (shown by crinkly appearance), marks the top of the salt bed. The base of the salt cannot be determined because the drilling mud is recirculated and some of the anhydrite particles are mixed with well cuttings from below the salt. Sample logs were used by Kulstad, Fairchild, and McGregor (1956, p. 47) to establish the stratigraphic relation of Hutchinson salt and underlying anhydrite beds.
Drillers logs from cable-tool wells may be as good as sample logs in determining the thickness and position of salt in the hole. Salt can be recognized easily by the driller both in the sample and from the manner in which his cable-tool drill operates. Drillers logs from rotary wells are, on the whole, poor sources of salt information.
"Electric" logs of holes are made by measuring and recording certain physical properties of the rocks through which the hole has been drilled. They are useful in identifying salt and in differentiating salt from shale, anhydrite, and limestone. The identification of salt on electric logs is based on the assumption that the hole diameter is enlarged where the hole passes through salt. For the most part, cable-tool drilling requires that the hole be cased as drilling proceeds; consequently; electric logs of cable-tool holes are useless for salt investigations. On the other hand, rotary holes usually do not require casing While the hole is drilled except near the surface, and the electric logs provide valuable information.
A caliper tool measures and records hole diameter and the depth at which the measurement took place. The position of salt is shown by enlargement of the hole; the lithology of associated rocks is not indicated. Tapper (1950, p. 439) gives additional information on the caliper log.
These logs show the electrical resistivity of rocks very close to the hole. They are said to have shallow lateral penetration. Where the hole has been enlarged by solution of the salt bed, the walls of the hole are beyond the depth of penetration of the measuring apparatus; consequently, the very low resistance of the drilling mud records the position of the salt. Further description of the microlog and microlaterolog is given by Tixier (1956, p. 43-66). Micrologs and microlaterologs are run in uncased holes.
The natural radioactivity of the rocks through which the hole has been drilled is recorded by gamma ray logs. Salt, anhydrite, and limestone have relatively low natural radioactivity and can not be differentiated by a gamma ray log alone. Shale, on the other hand, has a relatively high natural radioactivity and may be identified on a gamma ray log. Further discussion of the gamma ray log can be found in Mercier (1950, p. 419).
These logs measure the induced radioactivity of the rocks through which the hole has been drilled. The rocks in the hole are bombarded with a stream of neutrons; induced secondary gamma radiation is measured by a detector, which follows the neutron source up the hole. The hydrogen ion, and therefore water, acts as an absorber of the neutrons and diminishes induced radioactivity. Thus, where the hole is enlarged, owing to salt solution, the additional drilling mud necessary to fill the hole serves as a neutron absorber and the position of the salt is indicated by diminished induced radioactivity, but most shale, which also contains entrapped or connate water, is a neutron absorber; hence shale and salt may not be differentiated on a neutron-gamma log. Anhydrite and limestone show high induced radioactivity and may be identified from a neutron-gamma log (Mercier, 1950, p. 419-439).
Like micrologs and microlaterologs, the laterolog records the electrical resistivity of the rocks in the hole. Laterologs, however, have deep penetration; hence change in hole size has little effect upon the log. Both anhydrite and salt show extremely high electrical resistivity on these logs. Shale shows relatively low electrical resistivity and can be differentiated from salt. Further discussion of laterologs can be found in Martin (1956, p. 73-76).
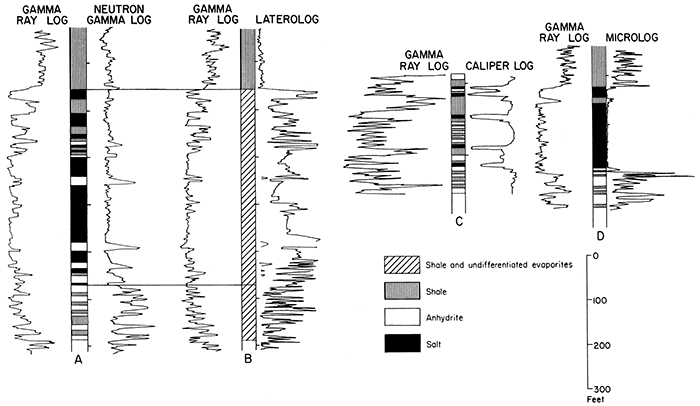
Nearly all "electric" log investigations utilize more than one type of log from the same hole. Most commonly the following combinations of logs, which will detect salt, are used in Kansas: (1) microlaterologs or micrologs, gamma ray logs, and caliper logs; (2) neutron-gamma logs and gamma ray logs; and (3) laterologs and gamma ray logs. Micrologs, microlaterologs, and caliper logs can be used separately for determination of the position of salt beds (Fig. 1, c and d). The combination of neutron-gamma and gamma ray logs (Fig. 1, a) will distinguish salt, shale, anhydrite, and carbonate rocks, but the resolution of anhydrite and the carbonate rocks is not good. Laterologs in combination with gamma ray logs (Fig. 1, b) will distinguish shale, carbonate rocks, and evaporites, but do not differentiate anhydrite from salt. They may be used, nevertheless, to correlate to those logs on which salt can be identified directly. Furthermore, laterolog curves break more sharply than either gamma ray or neutron-gamma log curves; thus they aid in the exact determination of the position of the salt beds in the hole.
Figure 1--A. Gamma ray-neutron gamma log showing position of salt by simultaneous kicks to the left on both traces. B. Gamma ray-Iaterolog showing position of top and bottom of salt by correlation to log of a nearby hole in which position of the salt can be determined by direct interpretation. Correlation is made to log in (A). C. Gamma ray--caliper log showing position of salt by measurement of hole diameter. Beds of salt are indicated by enlargement of hole or kick to the left on caliper log trace. (This type of well survey is usually accompanied by mierolog, which has been deleted here for illustrative purposes.) D. Gamma ray-microlog showing position of salt by kick to the left on microlog trace as well as on gamma ray trace.
It should be emphasized that "electric" logs measure only the physical properties of the rocks. Consequently, different rocks having the same physical properties could not be distinguished on the log that recorded the property. For example, potash salts exhibit a high natural radioactivity and a solubility of the magnitude of sodium chloride. A rock containing potash salts should show high natural radioactivity on a gamma ray log and low induced radioactivity on a neutron-gamma log because of hole enlargement and therefore could not be differentiated from shale.
The use of "electric" logs also is predicated on rock homogeneity. No allowance is made, for example, for a rock that may be partly salt and partly shale. Sample studies show that mixed rocks of this type are common.
It is unfortunate that no "electric" log can distinguish salt from all other rock types in cable-tool wells, for such a log would permit direct comparison with well samples. Nevertheless, the same water solubility of rock salt that causes destruction of the well sample is responsible for the "electric" log record, and in the writer's opinion, makes the "electric" logs the more accurate source of information.
The thickness and salt percentage map (Pl. 1) is a compilation of measurements from the uppermost to lowermost beds of salt judged to be in the Wellington formation. Salt thickness is contoured on 50-foot interval. Salt percentage is shown by pattern on a 20 percent interval.
The Hutchinson salt in some places seems to be one solid bed of salt. In other areas, salt interfingers with beds of other composition above and below thick salt beds. In still other localities, shale or anhydrite beds occur in the middle of the salt. The isopachous lines at some places show an exaggerated change in salt thickness from one area to the next because stringers of salt above and below solid salt are found in one well but are absent in an adjacent well. Percentage measurements were made from micrologs, microlaterologs, and combination neutron-gamma gamma ray logs only.
It is the writer's opinion that smaller isopachous and salt percentage intervals might be more revealing, but that these refinements could exceed the limits of accuracy of log interpretation.
Glover, R. H. (1953) Seismograph pays off in Kansas: World Oil, v. 137, no. 4, p.109-110, 112, 114, 116.
Kulstad, R. O., Fairchild, Paul, and McGregor, Duncan (1956) Gypsum in Kansas: Kansas Geological Survey Bull. 113. [available online]
Martin, Maurice (1956) Resistivity measuring devices using focusing systems, in Fundamentals of logging, Petroleum Engineering Conf., Univ. Kansas, April 2-3, 1956.
Mercier, V. J. (1950) Radioactivity well logging, in Subsurface geologic methods, 2d ed., L. W. Leroy, ed.; Colorado School of Mines, p. 419-439.
Tapper, Wilfred (1950) Caliper and temperature logging; in, Subsurface geologic methods, 2d ed., L. W. Leroy, ed.; Colorado School of Mines, p. 439-449.
Tixier, M. P. (1956) Microlog and Microlaterolog; in, Fundamentals of logging, Petroleum Engineering Conf., Univ. Kansas, April 2-3, 1956.
Widess, M. B. (1952) Salt solution, a seismic velocity problem in western Anadarko basin Kansas-Oklahoma-Texas: Geophysics, v. 17, no. 3, p. 481-504.
Kansas Geological Survey
Comments to webadmin@kgs.ku.edu
Web version Dec. 3, 2013. Original publication date 1959.
URL=http://www.kgs.ku.edu/Publications/Bulletins/137/Kulstad/index.html