![]()
Prev Page--Utilization of Water || Next Page--Ground-water Conditions
Potential Perennial Yield of the Wichita Well-field Area
It is evident that during recent geologic time the average rate of natural discharge from the aquifers in this area, as in others, in general has been equal to the rate of recharge. Comparatively small changes in the quantity of water in an aquifer, with accompanying changes in water level, may occur as the result of temporary unbalance between discharge by natural processes and recharge, but such fluctuations balance each other over a period of years and, under natural conditions, aquifers are in a state of approximate dynamic equilibrium. Discharge by wells is thus a new discharge superimposed upon a previously stable system, and it must be balanced by an increase in the recharge to the aquifer, by a decrease in natural discharge, by a reduction of storage in the aquifer, or by a combination of these. It is necessary to recognize this principle in studying the development of large ground-water supplies. Pumping from wells may divert ground water to more beneficial use than would otherwise result; on the other hand, reduction in discharge by transpiration as a result of pumping may deprive useful plants of needed water.
It is desirable for users of large quantities of ground water to know the quantity of water that may be derived from the aquifer for a long period of time in the area of withdrawal. One purpose of the study made of this area has been to qualify, if possible, estimates of the perennial potential yield of the aquifer which were made at the time of construction of the new Wichita city-supply wells. The present study, therefore, is an attempt to utilize the data which have become available since observations began in 1938 and especially since pumping began in the well field on September 1, 1940, and to evaluate these data insofar as they relate to the perennial yield of the aquifer.
Definition of Potential Perennial Yield
The perennial yield of the aquifer underlying an area of ground-water development, as the term is used in this study, has been regarded as the maximum rate at which water can be salvaged from the natural discharge or added to the recharge, or both. If that rate is exceeded, the water levels in and around the pumped area will continue to fall and some of the wells eventually may be abandoned (Morgan, 1938, p. 64).
The potential perennial yield of a water-bearing formation may be either greater or less than the rate of natural recharge or discharge (Meinzer, 1932, p. 119). It may be less because the natural discharge cannot be completely diverted to the wells and it may be greater because of artificial increase in recharge. In some reports the economical pumping lift has been considered to be a factor in this definition; however, the economics of recovery seem to be irrelevant to the determination of the quantity of water which an aquifer will yield and so are not considered here.
Summary of Data Availible for Studying Perennial Yield
The study of the perennial yield of the water-bearing material in the Wichita well-field area is implemented by methods based on the change in storage in the ground-water reservoir, which is revealed by periodic measurements of water levels in many wells. The data available for study have been presented in several sections above; they are: (1) records of water-level fluctuations in 10 observation wells in the general well-field area, selected from a large number of observation wells after study of the water-table fluctuations revealed that they are representative of that part of the well-field area not in the immediate area of pumping influence (Fig. 16); (2) records of water-level fluctuations in six observation wells about half a mile from the pumped wells (Figs. 24 and 25), in 25 wells 500 feet from the pumped wells (Fig. 25), and in 25 wells 100 feet from the pumped wells (Fig. 25), which were chosen as being representative of fluctuations of the water table in the area of pumping influence; (3) pumpage data obtained from readings made from meters at the municipal supply wells (Table 34, and Figs. 24 and 25); (4) values for the specific yield of the water-bearing materials obtained from tests made in the hydrologic laboratory of the United States Geological Survey in Washington, D.C., and in the laboratory at Lawrence, Kansas (Table 7); (5) rainfall data obtained from published records of the United States Weather Bureau (Figs. 2-8) ; and (6) determinations of permeability and transmissibility made by several methods and summarized in Table 35.
Table 35--Calculation of movement of water across the boundary of the new Wichita well field.
| Wells between which calculations apply | Distance between wells (miles) | Distance between wells corrected parallel to water-table contours (miles) | Average transmissibility for interval | Average hydraulic gradient (feet per mile) | Quantity of water crossing well-field boundary (gallons a day) |
|---|---|---|---|---|---|
| 255-314 | 0.57 | 0.47 | 49,400 | 10 | 232,000 |
| 314-322 | 0.42 | 0.42 | 55,800 | 9.3 | 217,000 |
| 322-330 | 0.57 | 0.57 | 63,000 | 7.5 | 269,000 |
| 330-333 | 0.41 | 0.34 | 104,700 | 6.7 | 238,000 |
| 333-415 | 0.52 | 0.50 | 107,000 | 5 | 267,000 |
| 415-423 | 0.49 | 0.46 | 90,100 | 4.6 | 192,000 |
| 423-429 | 0.45 | 0.43 | 150,200 | 5.5 | 359,000 |
| 429-459 | 0.75 | 0.32 | 183,600 | 5.3 | 308,000 |
| 459-455 | 0.70 | 0.35 | 251,600 | 6.4 | 562,000 |
| 455-465 | 1.95 | 0.83 | 198,800 | 7.5 | 1,238,000 |
| 465-476 | 1.43 | 0.70 | 129,700 | 7.5 | 680,000 |
| 476-487 | 0.61 | 0.44 | 316,900 | 7.5 | 441,000 |
| 487-494 | 0.72 | 0.43 | 106,800 | 6.8 | 313,000 |
| 5,316,000 |
In addition to the data presented above, water-table contour maps of the well-field area have been prepared, based on periodic water-level measurements in about 190 wells (Pl. 33). The first of these maps was prepared from measurements made in June 1940, before pumping began. Other water-table contour maps were prepared after pumping began on September 1, 1940 from measurements made on the following dates: April 15, 1941; July 10, 1941; November 10, 1941; April 1, 1942; July 10, 1942; October 1, 1942; April 1, 1943; July 5, 1943; October 7, 1943; April 1, 1944; July 7, 1944; and October 1, 1944. Maps showing lines of equal change in water level (Pl. 34) were prepared by comparing water-table contour maps prepared for each period after pumping began with the water-table contour map prepared from measurements made before pumping began.
Plate 33, 34 in pocket.
Specific yield.--As noted above in the section on physical properties of the water-bearing materials, the average specific yield of 13 samples collected from the zone of water-table fluctuation in the Wichita well-field area was found to be 25.2 percent. The specific yield ranged from 8 to 38 percent by volume and the average specific yield of all the samples studied from this area, both from above and below the water table, was 26.8 percent. The average computed value of specific yield has been assumed to be nearly correct and 25 percent has been used in calculation of recharge, discharge, and the changes in storage presented below. However, it is noted that the apparent specific yield in the Wichita well-field area probably increased from about 15 percent when pumping began to about 25 percent, or about the real specific yield at the end of four years of pumping.
Transmissibility.--The coefficient of transmissibility at each of the Wichita city-supply wells was computed by the recovery method. The transmissibility ranged from 46,000 at well 311 to 330,000 at well 455. The average coefficient of transmissibility was computed to be 124,500.
Using the coefficients of transmissibility given in Table 35, and the natural gradient of the water table taken from Plate 1, the quantity of water moving across the boundary of the Wichita well field under non-pumping conditions was calculated. The area for which this calculation was made is shown on Plate 33 and the calculation is summarized in Table 35. The total quantity of water that moved across the line connecting the wells given in Table 35, under non-pumping conditions, is believed to have been about 5,300,000 gallons per day.
The authors are aware of the limitations of the recovery method of determining transmissibility of fine-grained materials under water-table conditions. As noted above, observation wells are located 100 feet and 500 feet, respectively, from each pumped well, and water levels in these observation wells were measured periodically during the pumping test at each well. The observation wells do not penetrate the entire aquifer and are screened at the bottom only. For these and other reasons the application of the Thiem method for determining transmissibility was not considered advisable. However, using data shown on Figure 25, the difference in average drawdown in the wells 500 and 100 feet from the 25 pumping wells at the end of 1944, and the average pumping rate in 1944, the average transmissibility as defined above was calculated to be about 250,000 using the Thiem method. Comparison shows that this value is about twice that obtained by the recovery method. The authors believe that (1) the Thiem method probably is not applicable to the data available in the Wichita well-field area; and (2) the results obtained using the recovery method may be in error, and if so, probably indicate too small a quantity of water moving into the well field.
Recharge.--Normal annual precipitation at Sedgwick, the United States Weather Bureau station nearest to the Wichita well-field, is 29.47 inches. The greatest annual precipitation of record at Sedgwick was 42.85 inches in 1927 and the least recorded annual precipitation was 16.93 inches in 1936. The average annual precipitation at Sedgwick for the 6-year period, from 1939 to 1944 inclusive, was 34.32 inches.
In the section of this report in which recharge is considered, many data are presented showing that water derived from precipitation is added to the aquifer periodically. Study of the hydrographs for well 557 and for the average of the water levels in 10 wells in the part of the well-field area not affected by pumping indicates that in years of normal precipitation the average annual net recharge is equivalent to about 20 percent of the precipitation. It should be emphasized that this estimate is based on the possibly optimistic assumption that the proportion of the precipitation that reaches the water table is as large during years of normal precipitation as during the period of record, when the precipitation was above normal. However, any error that may result from this assumption is compensated by the fact that the figure of 20 percent for the period of record does not take into account the fact that discharge of ground water was occurring while the rises in water level on which the 20-percent figure is based were being measured; thus, if this discharge had not been occurring the rises in water level would have been greater and the total recharge would have been shown to be equivalent to more than 20 percent of the precipitation.
Discharge.--Ground water is discharged from the Wichita well-field area by natural processes including evaporation, transpiration, and ground-water runoff; in addition, large quantities of water are discharged by pumping.
Some measure of natural discharge of ground water may be gained by examination of Figure 16. This curve represents the average water level in 10 observation wells in the well-field area not affected by pumping. The declines in water level are caused by excess of discharge over concurrent recharge. The quantity of annual recharge during years of normal precipitation has been estimated to be about 20 percent of the precipitation at Sedgwick or about 6 inches of water per year, or about 320 acre-feet per square mile each year in the well-field area. Over a complete hydrologic cycle, recharge and natural discharge are approximately equal.
Superimposed upon natural discharge in this area is the discharge occasioned by pumping from the supply wells in the Wichita well field, and by pumping from all other wells in the well-field area which, however, is very small compared to the amount pumped from the city supply wells. In summary, the quantity pumped from the Wichita supply wells from September 1, 1940 to January 1, 1945 was 23,284 million gallons or an average of about 15 million gallons a day. Several hydrographs showing the effect of pumping on water levels in the well field are presented above in Figures 24, 25, and 26, and indicate that water levels in much of the area affected by pumping apparently had become stabilized at the end of 1944.
Changes in Storage
Whenever precipitation reaches the water table as recharge, such water represents, temporarily, an addition to the quantity of water in storage in the aquifer. Similarly, whenever ground water is discharged from the aquifer by natural or artificial processes such discharge is a removal of water that was in transient storage in the aquifer. Change in storage, as used here, means the net addition of water to or net withdrawal of water from the aquifer. If at the end of a given period of time the water levels in observation wells are lower than they were at the beginning of the period, it is concluded that ground-water discharge exceeded recharge and that there has been a net withdrawal of water from storage.
Natural changes in storage.--Natural changes in ground-water storage are those changes in the quantity of water in storage in the aquifer caused by natural processes as distinct from changes in storage caused by pumping. Natural changes in storage for any given period of time are measurable by comparing the water levels in wells not affected by pumping at the beginning and end of the period. If recharge exceeded natural discharge, then there was a net addition to storage; if natural discharge exceeded recharge, there was a net loss of water from storage during the period.
The fluctuations of the water levels in 10 wells, discussed at length above, are believed representative of the fluctuations in water level in that part of the well-field area not affected by pumping, and form the basis for calculation of natural changes in storage in the well-field area. Figure 16 shows the monthly changes in storage for six years as measured in these observation wells. The greatest monthly natural addition to storage occurred in April 1944 when an average net rise in water level of 2.7 feet occurred, and the greatest monthly natural discharge was in July 1942 and June 1944 when the average water levels declined 0.8 and 0.9 foot, respectively.
Changes in storage caused by pumping.--The monthly changes in storage caused by pumping may be observed by comparison of Figures 16 and 24. Figure 24 shows the trend of water levels affected by pumping and indicates withdrawal of water from storage by pumping. Figure 26 shows the relationship since pumping began between water levels in wells not affected by pumping and those in wells affected by pumping. These graphs indicate that water levels in the well field ceased declining at the end of 1944 and that an equilibrium gradient may be nearly established toward the pumped wells for the present average rate of pumping, and under current climatic conditions.
In order to determine the magnitude of the withdrawal of ground water from storage, 13 water-table contour maps of the well-field area were prepared. These maps represent hydrologic conditions before pumping began and at several dates since pumping began (Pl. 33). The water-table contour maps were originally prepared at a scale of 2 inches to a mile with a contour interval of 5 feet. These intervals were later divided into five equal parts and contour lines having an interval of 1 foot were interpolated. By superimposing each map prepared after pumping began upon the map prepared before pumping began and by connecting points of contour crossings, lines of equal change in water level, here called isometahydral lines, were drawn. The resulting 12 maps (Pl. 34) afford a measure of the magnitude of change in ground-water storage for each of the periods between the several water-table contour maps.
An area of 85.3 square miles bounded by the heavy line and the Little Arkansas River shown on Plate 28 was selected after study of the geologic map (Pl. 1), logs of test holes, records of observation wells, and the water-table contour maps (Pl. 33) as being about the maximum area which may be affected by pumping in the well field. Not all of this area had been affected by pumping at the end of 1944. The areas between successive lines showing increases and decreases in ground-water storage were measured with a planimeter and multiplied by the average rise or lowering depicted by the lines, and by this method the net increase or net decrease in storage within the area was determined. Because each succeeding water-table contour map was compared with the first one, which was constructed before pumping began, all of the maps show a net decrease in storage.
Summary of changes in storage.--The maps on Plate 34 show the cumulative effects of pumping on water levels in the well-field area for several dates since pumping began, superimposed upon natural changes in water level. The data relevant to and obtained from each map are given in Table 36, and parts of the data are shown graphically on Figure 31.
Table 36--Data relative to changes in storage in the Wichita well-field area.
| Map (Plate 39) |
Date from June 1, 1940, to: | (1) | (2) | (3) | (4) | (5) | (6) |
|---|---|---|---|---|---|---|---|
| Net rise in water level in 10 wells not affected by pumping (Fig. 3) (feet) |
Area affected by pumping (square miles) | Net reduction in storage (acre-feet) | Net natural recharge (acre-feet) | Quantity of water discharged by pumping (acre-feet) | Quantity of water unaccounted for. Col. 6 = Col. 5 − (Col. 3 + Col. 4) (acre-feet) | ||
| A | 15-Apr-41 | −1.25 | 44.6 | 28,450 | −17,060 | 6,860 | −4,530 |
| B | 10-Jul-41 | 0.57 | 57.0 | 10,530 | 7,780 | 1,080 | −8,230 |
| C | 10-Nov-41 | 1.03 | 44.4 | 8,460 | 14,060 | 15,310 | −7,210 |
| D | 01-Apr-42 | 0.66 | 58.7 | 20,060 | 9,010 | 20,100 | −8,970 |
| E | 10-Jul-42 | 1.95 | 54.1 | 10,580 | 26,610 | 24,210 | −12,980 |
| F | 01-Oct-42 | 2.10 | 65.8 | 12,910 | 28,660 | 28,470 | −13,100 |
| G | 01-Apr-43 | 1.79 | 55.7 | 19,570 | 24,430 | 35,950 | −8,050 |
| H | 05-Jul-43 | 1.15 | 51.5 | 17,810 | 15,700 | 41,250 | +7,740 |
| I | 07-Oct-43 | 0.23 | 55.2 | 29,940 | 3,140 | 46,750 | +13,670 |
| J | 01-Apr-44 | 1.05 | 56.0 | 28,030 | 14,330 | 55,900 | +13,540 |
| K | 07-Jul-44 | 2.19 | 68.8 | 22,290 | 29,890 | 61,450 | +9,270 |
| L | 01-Oct-44 | 1.46 | 64.5 | 24,640 | 19,930 | 66,850 | +22,280 |
Figure 31--Graphs of data given in Table 36: (A) column 4 of Table 36; (B, and the shaded area between B and the datum line) column 6 of Table 36; (C) column 3 of Table 36; and (D) column 5 of Table 36.
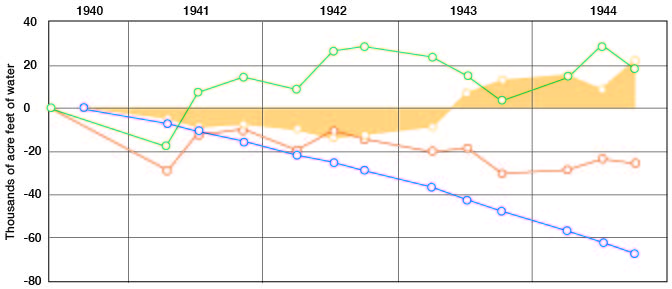
The net rise or net decline in water level from June 1, 1940, before pumping began, to the end of each map period in 10 observation wells not affected by pumping is given in column 1 of Table 36. Study of the fluctuations of water levels in many wells indicates that the fluctuations in the 10 wells chosen are representative of the behavior of the water table in the well-field area under natural conditions during the period of record. These wells are discussed above and the hydrograph is shown on Figure 16. The areas affected by pumping during each period (column 2), which were measured directly from large-scale maps, are the areas in which the water table lowered more than, or did not rise as much as, the average water level in the 10 wells not affected by pumping.
The area between each line of change in the base area (Pl. 28) was measured directly from each map and the net volume of water-bearing material unwatered during the map period was calculated. The net volume of water withdrawn from storage in the base area (column 3) was obtained by applying the factor for specific yield to the volume of the aquifer unwatered. The net natural recharge or net natural discharge which would have been measurable in the base area if pumping had not occurred is given in column 4. The magnitude of this quantity of water was calculated for each period from the observed average net rise or average net decline in 10 wells not affected by pumping (column 1). The quantity of water pumped during each period is given in column 5. The quantity of water needed to balance columns 3, 4, and 5 is given in column 6. Some of the reasons for and the significance of this lack of balance are discussed below.
Calculations made from the several maps (Pl. 34) indicate that the greatest measured net change in storage in the well-field area since pumping began occurred in October 1943 when about 30,000 acre-feet of water is calculated to have been removed from storage. The least measured net change in storage was in November 1941 when about 8,500 acre-feet was removed from storage. After four years and one month of pumping, measurements indicate that the change in storage in the base area has been about 24,600 acre-feet.
Hydrologic Implications
Change in specific yield.--During the first pumping period studied the net reduction in storage in the base area was calculated to have been 28,450 acre-feet. The net reduction in storage in this area would have been about 17,060 acre-feet if pumping had not occurred. The quantity of water withdrawn by pumping during this period was 6,860 acre-feet. These measured and calculated volumes do not balance by 4,530 acre-feet (column 6). Study of the fluctuations of water levels shown on Figure 16 indicates that no appreciable rises of the water table occurred during this period, and that the quantity of recharge probably was small. The factor which may account for the lack of balance, however, is the specific yield. Theoretical and empirical determinations of this hydrologic factor indicate that the true value is obtained only after the saturated material has been drained for a long period of time. If incomplete drainage during the first map period is assumed and the value for specific yield is changed from 25 percent to 15 percent in the computations, the several columns in Table 36 balance. Similarly, if a sliding scale of values for specific yield ranging from 15 percent to about 30 percent is used for the other map periods, the measured and calculated volumes balance. It is believed that the laboratory determinations of specific yield, discussed above, are nearly correct and that the apparent specific yield increased from about 15 percent at the end of the first period studied to near the real or determined value of 25 percent in later periods. The value for specific yield was probably about 19 percent at the end of the second year of pumping and probably reached the real value sometime during the third year of pumping.
Reduction of natural discharge into the Little Arkansas River.--Measurements made from the water-table contour maps shown on Plate 33 indicate no decrease in the average gradient along the Little Arkansas River from the time pumping began until the last part of the third year after pumping began. Measurements made from map 9 show a decrease in average gradient of 1.8 feet per mile near the Little Arkansas River, map 10 shows a decrease of 2.1 feet per mile, and map 13 shows a decrease of 2.6 feet per mile. There is no measurable difference between the gradients at the west side of the well-field area on maps 1 and 13. It is concluded, therefore, that there was no measurable change in the quantity of water entering and leaving the well field by percolation through the aquifer until about July 1943. At this time about 8 percent of the quantity of water formerly being discharged into the Little Arkansas River was intercepted; by October 1943 it seems that about 10 percent of the total flow of the river derived from ground water from this area was being intercepted; and on October 1, 1944, about 12 percent of this quantity was diverted toward the well field.
On the basis of data pertaining to the physical properties of the aquifer, the slope of the water table, and the location of the well field relative to the Little Arkansas River, it is calculated that the water table in the well field must be lowered about 40 feet below the initial level before all of the water percolating toward the river in this section of its course can be intercepted and the gradient reversed toward the well field from the river. Measurements made from map L (Pl. 34), prepared after four years' pumping from the well field, indicate that in the area northwest of Halstead the water table has been lowered 18 feet below the initial level. At the point of greatest lowering the water table must be lowered 10 feet farther before the water level near the wells is at the same level as the water surface in the Little Arkansas River due east, and must be lowered at least 20 feet below present level to cause any significant flow from the river toward the wells. Southwest of Halstead, north of Kisiwa Creek the water table has been lowered 16 feet in one small area. At this place the water table must be lowered an additional 22 feet to be at the same level as a comparable point on the Little Arkansas River. South of Kisiwa Creek, in the southern part of the well field, the water table has been lowered about 5 feet and must be lowered an additional 25 feet to be at the same level as the river, and still farther to reverse the flow from the river. It is calculated that a quantity of water of the order of magnitude of 200,000 acre-feet must be removed from storage in the well field before hydrologic conditions are such that water can percolate from the Little Arkansas River toward the wells.
Source of the water pumped.--The amount of precipitation on the well-field base area since pumping began was 52.47 inches at the end of the first year of pumping (June 1, 1940 to Nov. 10, 1941) 90.31 inches at the end of the second year, and 124.22 and 160.41 inches at the end of the third and fourth years, respectively. The quantity of recharge in this area, shown above to be about 20 percent of the precipitation, at the end of each year since pumping began was about 47,750 acre-feet, 82,200 acre-feet, 113,000 acre-feet, and 146,000 acre-feet, respectively.
Data given in Table 36 indicate that the water pumped from the municipal supply wells during the first and second years of pumping came from water in storage, including part of the water which would have been added to storage if no pumping had occurred. There was no apparent reduction in natural discharge during these years. At the end of the third year, 46,750 acre-feet of water had been pumped, of which about 33,000 acre-feet was pumped from storage and about 14,000 acre-feet was derived from the reduction of natural ground-water discharge. Under natural conditions, had no pumping occurred, 110,000 acre-feet would have been discharged. Thus about 13 percent of the quantity of ground water normally discharged was salvaged by pumping. Similarly, computations based on hydrologic data available at the end of the fourth year of pumping indicate that of the 66,850 acre-feet of water pumped during the four years, about 44,600 acre-feet was derived from storage and about 22,200 acre-feet was derived from the reduction of natural discharge. The quantity of ground water which would have been naturally discharged from the area during the four years is calculated to be 127,000 acre-feet and the quantity salvaged is about 15 percent of the total. Measurements made from map L (Pl. 34) indicate that the area affected by pumping at the end of the fourth year was about 65 square miles.
Summary
On the basis of data presented above, it is concluded that the potential perennial yield of the aquifer in the Wichita well-field area had not been reached at the end of 1944 for the following reasons: (1) the water levels in wells affected by pumping in the well-field area seemingly had ceased declining at the pumping rate prevailing at that time; (2) only a part of the natural discharge in the area of pumping influence was being salvaged; and (3) the Little Arkansas River remains a gaining stream, but is a potential source of increased recharge in this area.
The conclusion that the safe yield, as determined by recharge during the period of record, had not been reached at the end of 1944 does not in itself define this quantity. An estimate of the safe yield with the present arrangement of wells may be made, however, from data presented above. If the maximum area of influence of the present well field is about 85 square miles, it is believed that recharge in years of normal precipitation will be about 27,000 acre-feet. When the water table is lowered to a depth sufficient that all natural discharge may be salvaged, percolation into the area, including influent seepage from the Little Arkansas River, will be at least 13,000 acre-feet a year. Thus the potential yield of the present well-field area during a period of normal precipitation is estimated to be about 40,000 acre-feet a year, or about twice the present annual pumpage. Before a quantity of water equal to this yield can be added to the aquifer each year, about 200,000 acre-feet must be removed from storage. This quantity is equal to that which would be pumped in 10 years at the present rate of pumping assuming that there would be no replenishment from precipitation. Any expansion of the present well field will involve a larger area of influence and the potential safe yield will be correspondingly larger.
Prev Page--Utilization of Water || Next Page--Ground-water Conditions
Kansas Geological Survey, South-central Kansas
Comments to webadmin@kgs.ku.edu
Web version April 2005. Original publication date July 1949.
URL=http://www.kgs.ku.edu/Publications/Bulletins/79/16_potent.html