![]()
Prev Page--Ground-water Discharge || Next Page--Utilization of Water
Quality of Water
The chemical character of the ground waters in this area is shown by analyses of 231 samples of water collected from test holes and wells. The results of the analyses are given in Table 13. Only partial analyses or chloride determinations were made of many samples collected from wells in the oil-field areas (Pl. 29). The analyses, which were made by R. H. Hess and others in the Water and Sewage laboratory of the Kansas State Board of Health and by Margaret D. Foster and others in the laboratory of the Quality of Water Division of the U.S. Geological Survey in Washington, show only the dissolved mineral content of the waters and do not indicate the sanitary condition of the waters. Total and excess alkalinities of waters for which analyses are given in Table 13 are listed in Table 14. The excess alkalinity is the amount of alkalinity equivalent to sodium and potassium as CaCO3 and is computed by subtracting the equivalents of calcium and magnesium from the total alkalinity.
Table 14--Total and excess alkalinities of waters for which analyses are given in Table 13, in parts per million.
| Well or sample number | Total Alkalinity | Excess Alkalinity |
|---|---|---|
| B | 290 | 2 |
| C | 312 | 34 |
| 213 | 320 | 2 |
| 220 | 314 | 61 |
| O | 354 | 86 |
| R | 176 | 31 |
| 291 | 154 | 5 |
| V | 189 | 19 |
| W | 180 | 12 |
| X | 162 | 24 |
| 299 | 204 | 60 |
| 300 | 168 | 23 |
| 300a | 154 | 27 |
| 300b | 156 | 24 |
| 300c | 190 | 12 |
| Z | 162 | 35 |
| AA | 160 | 34 |
| BB | 153 | 35 |
| CC | 98 | 1 |
| 309 | 154 | 31 |
| 310 | 148 | 15 |
| 311 | 147 | 29 |
| 314 | 144 | 23 |
| 317 | 150 | 19 |
| 322 | 154 | 29 |
| 327 | 112 | 20 |
| 328 | 98 | 12 |
| 328a | 99 | 9 |
| 329 | 147 | 29 |
| 329a | 172 | 44 |
| 329b | 171 | 24 |
| 330 | 184 | 41 |
| 333 | 148 | 33 |
| 339 | 196 | 50 |
| 355 | 194 | 45 |
| 355a | 69 | 6 |
| 371 | 180 | 20 |
| 375 | 106 | 4 |
| MM | 140 | 9 |
| NN | 170 | 18 |
| 400 | 212 | 41 |
| 400a | 224 | 58 |
| 401 | 146 | 13 |
| 401a | 150 | 8 |
| 401b | 144 | 20 |
| 403 | 186 | 26 |
| 403a | 232 | 51 |
| 412 | 170 | 22 |
| 412a | 158 | 21 |
| 415 | 168 | 39 |
| 419 | 164 | 27 |
| RR | 108 | 16 |
| 423 | 213 | 54 |
| 426 | 194 | 49 |
| 429 | 218 | 53 |
| 433 | 186 | 62 |
| 436 | 188 | 46 |
| 440 | 193 | 65 |
| 448 | 192 | 32 |
| 448a | 204 | 53 |
| 449 | 226 | 80 |
| 449a | 222 | 83 |
| 450 | 166 | 37 |
| 452 | 213 | 70 |
| 455 | 222 | 46 |
| 459 | 212 | 55 |
| 462 | 234 | 26 |
| 462a | 226 | 34 |
| 463 | 246 | 60 |
| 463a | 232 | 83 |
| 463b | 222 | 80 |
| SS | 258 | 42 |
| 465 | 266 | 61 |
| 471 | 262 | 57 |
| 472 | 266 | 67 |
| 473 | 268 | 39 |
| 476 | 270 | 41 |
| 479 | 255 | 63 |
| 486 | 116 | 12 |
| 486a | 240 | 32 |
| 487 | 264 | 7 |
| 491 | 230 | 28 |
| 494 | 260 | 15 |
| 496 | 136 | 10 |
| 497 | 236 | 76 |
| 497a | 222 | 62 |
| TT | 170 | 39 |
| FFF | 256 | 32 |
| GGG | 270 | 11 |
| 572c | 274 | 10 |
| 572e | 248 | 7 |
| III | 214 | 21 |
| 589 | 288 | 46 |
| 589a | 284 | 39 |
| 589b | 298 | 53 |
| 594 | 320 | 43 |
| NNN | 320 | 37 |
| OOO | 310 | 41 |
Chemical Constituents In Relation To Use
The following discussion of the chemical constituents of ground water has been adapted, in part, from publications of the United States Geological Survey.
Dissolved solids.--The residue left after a natural water has evaporated consists of rock minerals, with which may be included some organic material and some water of crystallization. Waters containing less than 500 parts per million of dissolved solids are generally satisfactory for domestic use, except for the difficulties resulting from their hardness and, in some areas, excessive corrosiveness. Waters having more than 1,000 parts per million are generally not satisfactory, for they are likely to contain enough of certain constituents to produce a noticeable taste or to make the water unsuitable in some other respects.
The ground waters from more than half the wells sampled contained between 200 and 500 parts per million of total dissolved solids and 13 percent contained less than 200 parts per million (Table 15). Total dissolved solids ranged from 81 to 60,246 parts per million, the most highly mineralized water representing contamination by oil-field brines. About 18 percent of the waters sampled ranged in dissolved solids between 500 and 1,000 parts per million, and 13 percent ranged between 1,000 and 10,000 parts. These waters generally are unfit for ordinary use. Ground waters containing the least dissolved solids occur in the sand-dune areas.
Table 15--Total dissolved solids in water samples from wells in south-central Kansas.
| Total dissolved solids (parts per million) |
Number of samples |
Percent of total |
|---|---|---|
| Less than 200 | 30 | 13 |
| 201-500 | 127 | 55 |
| 501-1,000 | 41 | 18 |
| 1,001-10,000 | 31 | 13 |
| More than 10,000 | 2 | 1 |
Hardness.--The hardness of water, which is the property that generally receives the most attention, is most commonly recognized by its effects when soap is used with the water in washing. Calcium and magnesium cause virtually all the hardness of ordinary waters. These constituents are also the active agents in the formation of the greater part of the scale formed in steam boilers and in other vessels in which water is heated or evaporated.
In addition to the total hardness, the table of analyses shows the carbonate hardness and the noncarbonate hardness. The carbonate hardness is that due to the presence of calcium and magnesium bicarbonates. It is almost completely removed by boiling. In some reports this type of hardness is called temporary hardness. The noncarbonate hardness is due to the presence of sulfates or chlorides of calcium and magnesium, it cannot be removed by boiling, and it has sometimes been called permanent hardness. With reference to use with soaps, there is no difference between the carbonate and noncarbonate hardness. In general, the noncarbonate hardness forms harder scale in steam boilers.
Water having a hardness of less than 50 parts per million is generally rated as soft, and its treatment for the removal of hardness under ordinary circumstances is not necessary. Hardness between 50 and 150 parts per million does not seriously interfere with the use of water for most purposes, but it does slightly increase the consumption of soap, and its removal by a softening process is profitable for laundries or other industries using large quantities of soap. Waters in the upper part of this range of hardness will cause considerable scale on steam boilers. Hardness above 150 parts per million can be noticed by anyone and if the hardness is 200 or 300 parts per million, it is common practice to provide a municipal water softening plant. Where municipal water supplies are softened, an attempt generally is made to reduce the hardness to about 60 or 80 parts per million. The additional improvement resulting from further softening of a whole public supply usually is not deemed worth the increase in cost.
Water samples collected from wells in this area ranged in hardness from 45 to 12,668 parts per million. Fifty-nine percent of the samples had a hardness between 100 and 300 parts per million (Table 16). Six percent had less than 100 parts per million of hardness, 5 percent had a hardness between 500 and 1,000 parts, and 5 percent had a hardness greater than 1,000 parts.
Table 16--Hardness of water samples from wells in south-central Kansas.
| Total hardness (parts per million) |
Number of samples |
Percent of total |
|---|---|---|
| Less than 100 | 13 | 6 |
| 101-200 | 83 | 36 |
| 201-300 | 53 | 23 |
| 301-500 | 59 | 25 |
| 501-1,000 | 12 | 5 |
| More than 1,000 | 11 | 5 |
Iron.--Next to hardness, iron is the constituents of natural waters that, in general, receives the most attention. The quantity of iron in ground waters may differ greatly from place to place, even though the waters are derived from the same formation. If a water contains much more than 0.1 part per million of iron, the excess may be precipitated as a reddish sediment. Iron, which may be present in sufficient quantity to give a disagreeable taste and to stain cooking utensils, may be removed from most waters by simple aeration and filtration, but a few waters require the addition of lime or some other substance.
Iron in the samples of water collected ranged from 0 to 400 parts per million. Forty-three percent of the samples collected contained less than 0.15 part per million (Table 17), and 7 percent contained more than 4 parts per million. In general, the highest iron content was found in waters contaminated by oil-field brine and in the sand-dunes area.
Table 17--Iron in water samples from wells in south-central Kansas.
| Iron (parts per million) |
Number of samples |
Percent of total |
|---|---|---|
| Less than 0.15 | 101 | 43 |
| 0.15-1.0 | 70 | 30 |
| 1.1-2.0 | 32 | 14 |
| 2.1-3.0 | 9 | 4 |
| 3.1-4.0 | 4 | 2 |
| More than 4.0 | 15 | 7 |
Fluoride.--Although determinable quantities of fluoride are not so common as fairly large quantities of the other constituents of natural water, it is desirable to know the amount of fluoride present in water that is likely to be used by children. Fluoride in water has been shown to be associated with the dental defect known as mottled enamel, which may appear on the teeth of children who, during the period of formation of the permanent teeth, drink water containing fluoride. It has been stated that waters containing more than 1.5 parts per million of fluoride are likely to produce mottled enamel. If the water contains as much as 4 parts per million of fluoride, 90 percent of the children drinking water are likely to have mottled enamel, and 35 percent or more of the cases will be classified as moderate or worse. Recent investigations indicate that small amounts of fluoride in drinking water, up to one part per million, may have a beneficial effect in the way of inhibiting decay of teeth.
The amount of fluoride in the water samples collected ranged from 0 to 1.7 parts per million. All but two of the samples contained less than one part per million of fluoride.
Chloride.--Chloride is widely distributed in nature; it is an abundant constituent of sea water and oil-field brines and is dissolved from most rock materials. Chloride has little effect on the suitability of water for ordinary use, unless there is enough present to impart a salty taste and render the water unpalatable. Waters high in chloride content may be corrosive if used in steam boilers. Chlorides of calcium and magnesium contribute to the hardness of water in a manner similar to the sulfates and carbonates of these elements. The removal of chloride from water supplies is difficult and expensive.
The chloride content of ground waters in this area varies widely and is shown graphically on Plate 29. The highest concentration of chloride is found in ground water in the oil fields near Burrton, Canton, Galva, and the area south of McPherson. As is pointed out on succeeding pages, ground water near the Arkansas River is high in chloride, which was one of the principal reasons for changing the source of the Wichita municipal water supply. Ground water in many parts of the area contains very little chloride.
Saltwater Intrusion
The intrusion of saltwater into streams or formations carrying freshwater is a serious matter in many parts of Kansas including parts of the area described in this report. The three principal sources of saltwater that endanger freshwater supplies in Kansas are: (1) oil-field brines; (2) natural salt springs and salt marshes; and (3) industrial wastes. In this area oil-field brines are believed to be the principal sources of saltwater intrusion, but the other sources listed are important just upstream from this area; hence saltwater from these sources is carried into this area--principally by the Arkansas River but in part by moving ground waters and by other surface streams.
Intrusion from Streams
Above Great Bend the Arkansas River carries freshwater having a relatively low chloride content. Below Sterling and particularly below Hutchinson, however, the river water contains sufficient chloride at normal or lower stages to be classed as brackish or salty. A large part of this salt is believed to come from salt marshes along Rattlesnake Creek in Stafford and Reno counties and from industrial wastes which enter Cow Creek in Barton and Rice counties. The areas embraced by these marshes are underlain principally by unconsolidated Pleistocene sediments which in turn are underlain by Cretaceous sandstone and shale and by Permian rocks. Thick salt beds in the Permian rocks underlie the area westward from Hutchinson and formerly extended somewhat farther eastward. These salt beds are mined commercially at Hutchinson, Lyons, and other points west of this area, and together with oil-field waste waters disposed of in this drainage area seem to be the most likely original source of the saltwater. The Cretaceous sandstones, however, are known to contain salt water farther west and may supply some of the salt marshes.
During the winter of 1934-35 the chloride content of several streams was determined by Wilhelm, Tome, and Pryor (1936, p. 17-19) in a cooperative investigation by the U.S. Bureau of Mines and the Kansas State Board of Health. The results are given in Tables 18, 19, and 20.
Table 18--Chloride content of the Arkansas River (parts per million).
| Sampling point |
First survey (a) |
Second survey (b) |
|---|---|---|
| At Great Bend | 102 | 65 |
| At Ellinwood above Ellinwood field | 98 | 72 |
| Below Ellinwood field and above Silica | 108 | 82 |
| Below Silica and above Raymond field | 194 | 90 |
| Below Raymond field and above mouth of Rattlesnake Creek | 214 | 142 |
| Below mouth of Rattlesnake Creek | 460 | 392 |
| Two miles west of Hutchinson | 460 | 392 |
| Two miles southeast of Hutchinson below sewage outlet | 1,895 | 750 |
| (a) Discharge zero at Larned; 1 cubic foot per second at Wichita | ||
| (b) Discharge 135 cubic feet per second at Wichita | ||
Table 19--Chloride content of Rattlesnake Creek (parts per million).
| Sampling point | First survey | Second survey |
|---|---|---|
| Approximately 10 miles west of Richardson field | 27 | 23 |
| Two miles above Richardson field | 1,180 | 700 |
| Three miles below Richardson field | 1,295 | 740 |
| One mile upstream from confluence with Arkansas River | 6,520 | 1,750 |
Table 20--Chloride content of Cow Creek (parts per million).
| Sampling point | First survey |
Second survey |
|---|---|---|
| T. 19 S., R. 11 W., above oil production | 428 | 610 |
| Above Chase field | 388 | 430 |
| Below Chase field | 340 | 275 |
| Below drainage from Lyons | 1400 | |
| Two miles southeast of Hutchinson | 620 |
It is evident from the analyses that most of the saltwater in Rattlesnake Creek comes from the salt marshes and not from the oil fields through which the stream flows, and the same is true for Cow Creek, which actually declines in chloride content before reaching Lyons, owing to dilution from freshwater tributaries. The effect of Rattlesnake Creek on the Arkansas River is indicated by the increase in chloride content from 214 to 460 parts per million in the first survey and a comparable increase in the second survey. It is also evident, however, that the chloride content of Cow Creek increases below Lyons and that the chloride content of the Arkansas River increases markedly below the sewage outlet at Hutchinson. The water discharged from large salt mines situated at each of these cities probably is largely responsible for these increases. Occasional unlawful discharges of brines directly into the Arkansas and Little Arkansas rivers from the Burrton oil field also has contributed temporarily to the salinity of those streams below the oil field.
During the course of the present investigation chloride determinations were made on several hundred samples of water from wells and from a few of the streams in the area, and were analyzed by Robert H. Hess in the Water and Sewage Laboratory of the State Board of Health. These and other chloride determinations of ground waters taken from the complete analyses (Table 13) are shown on Plate 29.
***Plate 29 in pocket
At low water stages during the fall of 1937 the chloride content of the Arkansas River between Hutchinson and Wichita was as high as 1,400 parts per million and generally was more than 1,000 parts. As shown on Plate 29 the chloride content of the ground water in this part of the Arkansas River valley ranges from several hundred parts per million to as much as 1,200 parts in wells within about a mile of the Arkansas River, but, excepting the high concentration encountered in some of the oil fields, the chloride content is progressively lower in wells situated farther from the river. This seems to indicate that some saltwater intrusion takes place from the river into the alluvium, even though the river normally is in essential equilibrium with the water table (Pl. 1). The chloride content of the ground waters becomes progressively less eastward from the Arkansas River toward the Little Arkansas River, which is in the same direction as the movement of ground water (Pl. 1), indicating that this reduction in chloride content is due to gradual dilution of the ground water by recharge from rainfall. The old well field that formerly supplied the City of Wichita lies within the belt of salty water bordering the Arkansas River; hence the water contained considerable chloride. In selecting the site for me new well field an effort was made to stay as far as practicable from the Arkansas River and other sources high in chloride.
Field studies by the Bureau of Mines, the Geological Survey, and the Kansas State Board of Health have indicated that some of the smaller streams in the area have been contaminated more or less temporarily by oil-field brines or industrial wastes, notably Turkey and Running Turkey creeks, tributaries of the Little Arkansas River in McPherson County (Wilhelm and Schmidt, 1935, p. 7). Although in general such contamination has not been considered serious, some ground-water supplies near such streams have been affected. Ground waters in the northern industrial area of Wichita were affected adversely by the spread of oil-field brines formerly carried by the Wichita drainage canal until a pipeline was installed for carrying the saltwater safely through the city (Jones, 1938). In planning the locations of the 25 new Wichita supply wells (Pl. 28) a wider spacing of wells was used where Kisiwa Creek crosses the well field in order to safeguard the water supply from possible intrusion of saltwater that might be carried in the future by that creek from the Burrton oil field.
***Plate 28 in pocket
Intrusion of Oil-field Brines
In the oil fields of the area considerable brine is produced with the crude petroleum, although the relative amounts of oil and salt water produced vary widely in different wells and in wells from different producing formation, and depend in part on the age of the oil field. Typical oil-field brines from this area contain from about 14,000 to about 145,000 parts per million of chloride (Schoewe, 1943, pp. 52-59).
Schmidt and Devine (1929, p. 8) list the following means by which the disposal of oil-field brines may be effected: (1) "evaporation" ponds, (2) evaporation for recovery of dissolved constituents, (3) diversion into surface streams, and (4) return to subsurface formations. In this area, as in most other parts of Kansas, oil-field brines have been disposed of mainly by methods (1) and (4), as method (2) generally is not practicable unless a sufficient quantity of rare salts can be recovered, and method (3) is prohibited by law.
The disposal pond or so-called "evaporation" pond was the most commonly used means of handling saltwater in the oil fields of the area until relatively recently, owing to the comparatively low initial and operating costs (Pl. 30). Such pits commonly have an area of from 500 to 10,000 square feet and a depth of from 1 to 15 feet (Pl. 31). In most parts of the area where such ponds are used, however, most of the brine escapes by seepage into the pervious surficial materials and thence into the ground-water reservoirs or the streams or both. The intrusion of saltwater from "evaporation" ponds into ground-water reservoirs has been proven in many places by analyzing samples of water from nearby wells or test holes, and by experiments indicating that the rate of disappearance of the water is several times as great as it should be, based on an approximate average rate of evaporation for Kansas. Thus Wilhelm and Schmidt (1935, p. 18) computed that of the average daily production of 16,000 barrels of brine put into "evaporation" ponds in the Ritz-Canton oil field, in McPherson County, probably only about 1,720 barrels a day were evaporated, leaving about 14,280 barrels of saltwater a day that either entered the freshwater formations or the surface streams. Some of the resulting contamination of ground waters in the Ritz-Canton area is shown on Plate 29, and has been described in detail by Wilhelm and Schmidt (1935).
Plate 30--Aerial photograph showing disposal ponds and other installations in an oil field in McPherson County. Note the extreme flatness of this area.
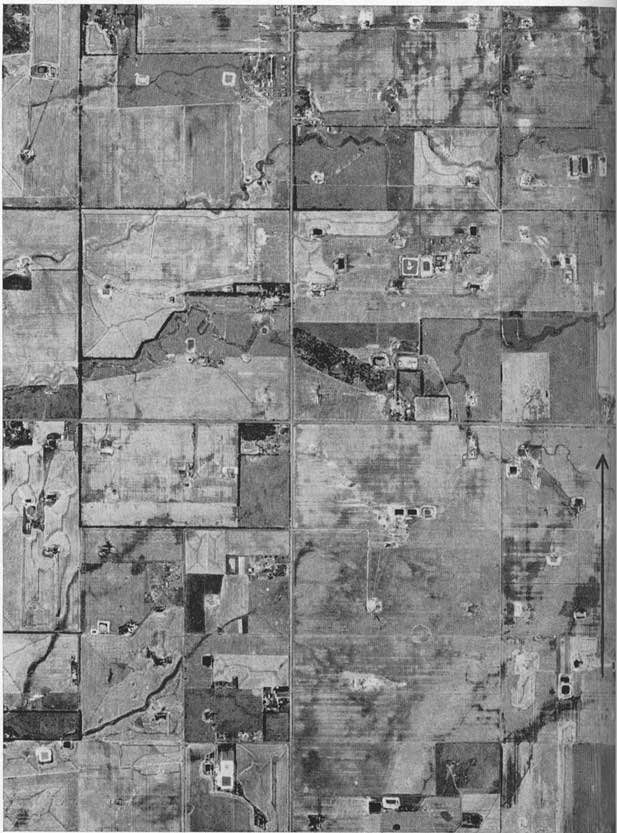
Plate 31--Contamination of ground-water reservoirs by oil-field brines. A, B, Brine-disposal ponds. C, Brine from nearby oil wells allowed to flow along road ditch. Photographs A and C by S. W. Lohman, B by C. C. Williams.
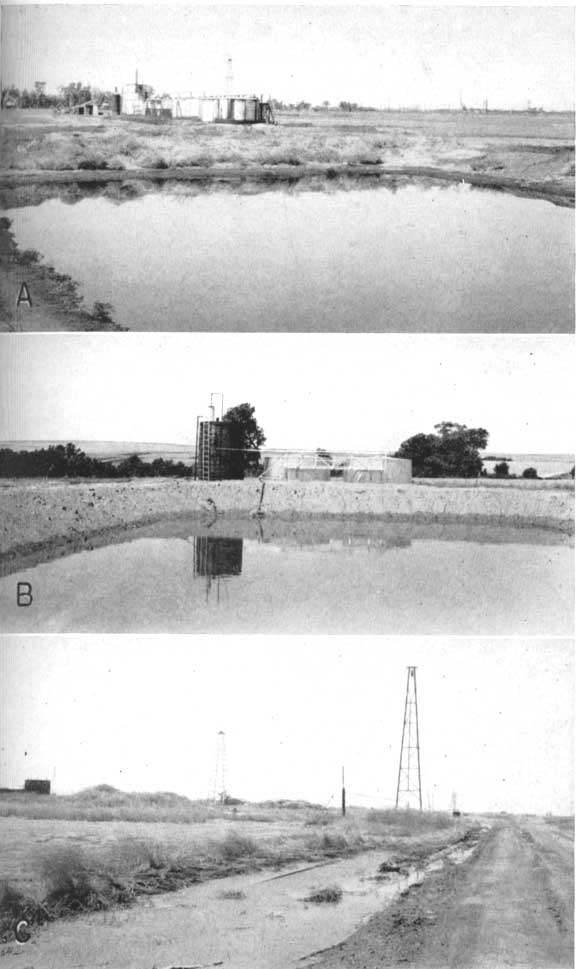
Through the efforts of the Kansas State Board of Health, most ponds are being replaced by safer means of disposal but large quantities of brine already have been allowed to enter bodies of fresh ground water through disposal ponds, by careless spilling of brine on pervious surficial materials (Pl. 31C), from leaky oil-well or disposal-well casings, or from improperly plugged holes. The most satisfactory means of disposal yet devised for inland areas is the return of brines to deep subsurface formations, either through abandoned oil wells, "dry" holes, or wells put down especially for disposal (Jones, 1945).
Intrusion of oil-field brine in the Burrton oil field.--The Burrton oil field, one of the most productive in the state, occupies a large area in the Arkansas River valley in eastern Reno County, and extends about 1 1/2 miles into western Harvey County. The field is underlain by beds of sand, gravel, silt, and clay to depth of 100 to more than 250 feet, which in turn rest upon shale of Permian age. The alluvium contains a large supply of ground water that is fresh except near the Arkansas River, as described above, and where local saltwater intrusion from oil-field brines has taken place. Saltwater intrusion in this field is a potential hazard to the new well field of the City of Wichita situated 6 miles downstream and for this reason it has been given special attention by the State Board of Health and by the State and Federal Geological Surveys.
The Burrton oil field was discovered in February 1931 before the widespread development of brine-disposal wells; hence for many years all the oil-field brine produced in this field was run into so-called evaporation ponds. Chloride surveys made by the State Board of Health indicated that saltwater intrusion was taking place, and that farm wells near the ponds yielded water high in chloride. Through the efforts of the State Board of Health the producers were encouraged to return the brine to subsurface formations by means of disposal wells. According to Ogden S. Jones, Geologist in Charge of the Oil-Field Section of the Division of Sanitation of the State Board of Health, of an average of 44,047 barrels of brine produced daily in 1939, 34.7 percent was handled by deep disposal wells, 27.5 percent by disposal wells of shallow or intermediate depth, and 37.8 percent by brine ponds. Shallow disposal wells into the Wellington salt proved to be unsatisfactory, as the high pressure under which the brine was forced down these wells caused brine to escape to the surface around the casings of nearby wells, and thereafter efforts were made to eliminate the use of shallow disposal wells. According to Mr. Jones, the completion of additional deep disposal wells in this field by late 1944 allowed the return of about 95 percent of the brine through deep disposal wells, about 3 percent through disposal wells of intermediate depth, and only about 2 percent to brine ponds. As soon as possible, it is hoped that all brine can be conducted to deep disposal wells. When this goal is reached, saltwater intrusion in this field should virtually cease, except for occasional leaks in brine lines and disposal wells. During the years in which many evaporation ponds were in use, however, a large quantity of brine found its way into the ground-water reservoir.
Studies made in the Burrton oil field by the State Board of Health have included periodic sampling of representative ground and surface waters; determinations of direction of ground-water movement using fluorescein; construction of maps showing the locations of all brine ponds, brine tanks, and pipe lines, and re-pressuring and disposal wells; and the sinking of auger holes adjacent to brine ponds in order to determine the chloride content of the ground water.
Additional studies of saltwater intrusion were made in this field in 1938 by the State and Federal Geological Surveys in cooperation with the State Board of Health and the City of Wichita. In the course of this work 35 driven wells were put down in order to study the lateral and vertical migrations of oil-field brines. The wells were driven at selected points on the downstream sides of disposal ponds, and the water samples were taken at vertical intervals of 5 feet, using a pitcher pump. The chloride content of the waters sampled was determined in a portable laboratory mounted on a truck (Pl. 4). It was found in general that the brine, being heavier than freshwater, sinks with surprisingly little diffusion or dilution until it encounters an impervious stratum. It then flows laterally in a relatively thin layer on top of this impervious stratum. In material containing discontinuous lenses or beds of impervious clay and silt, the brine may follow a "stair-step" course from one impervious bed to another, moving gradually downward and laterally.
The results of surveys at two typical areas in the Burrton oil field that have suffered saltwater intrusion are given in Table 21, and the locations of the test wells are shown in Figures 27 and 28. In both areas tested the ground water moves in a general southwesterly direction (Pl. 1).
Figure 27--Map of an area in the Burrton oil field showing location of test wells and brine-disposal ponds in survey A. Upper number corresponds to number of test well in Table 21; lower number is maximum chloride content of water, in parts per million.
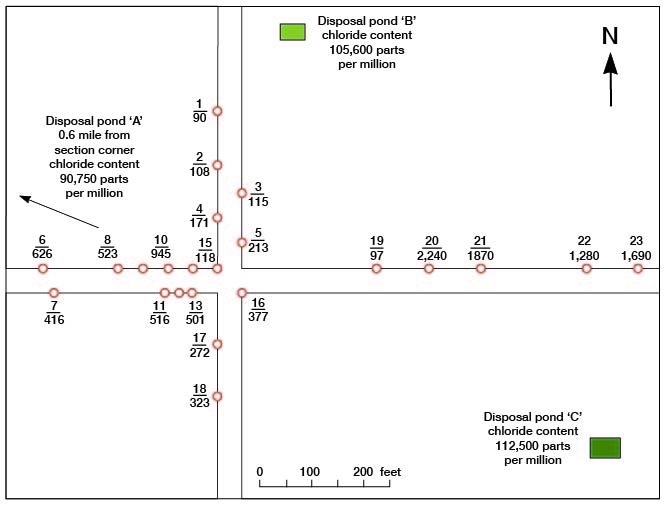
Figure 28--Map of an area in the Burrton oil field showing location of test wells and brine-disposal ponds in survey B. Upper number corresponds to number of test well in Table 21; lower number is maximum chloride content of water encountered, in parts per million.
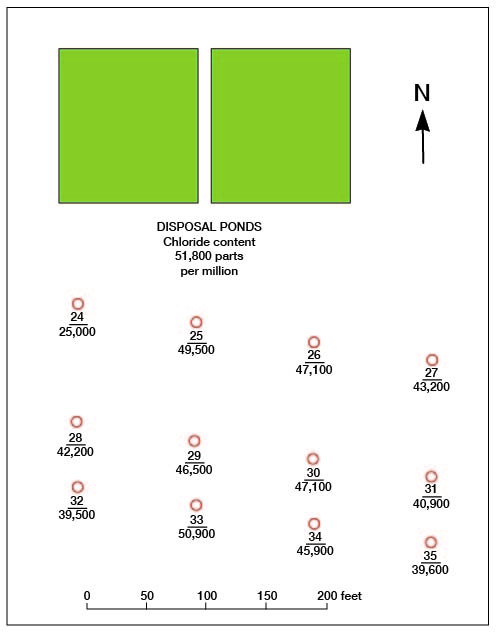
Table 21--Chloride content at given depths in test wells, in parts per million.
| Depth (feet) | Chloride content |
|---|---|
| (Survey A) | |
| Test well 1 | |
| 8-10 | 74 |
| 13-15 | 90 |
| 18-20 | 74 |
| 23-25 | 69 |
| 28-30 | 68 |
| 33-35 | 71 |
| 38-40 | 71 |
| 43-45 | 71 |
| 48-50 | 69 |
| 50-52 | 67 |
| 52- | (a) |
| Test well 2 | |
| 9-11 | 108 |
| 14-16 | 74 |
| 19-21 | 68 |
| 24-26 | 68 |
| 29-31 | 71 |
| 30.5-32.5 | 71 |
| 32.5- | (a) |
| Test well 3 | |
| 11-13 | 74 |
| 16-18 | 69 |
| 21-23 | 68 |
| 26-28 | 69 |
| 31-33 | 72 |
| 36-38 | 97 |
| 41-43 | 115 |
| 46-48 | 105 |
| 48- | (a) |
| Test well 4 | |
| 15-17 | 54 |
| 20-22 | 55 |
| 25-27 | 59 |
| 30-32 | 66 |
| 35-37 | 160 |
| 40-42 | 128 |
| 42-44 | 136 |
| 47-49 | 171 |
| 52-62 | (a) |
| 62-64 | 55 |
| 64.5-66.5 | 53 |
| Test well 5 | |
| 10-12 | 41 |
| 15-17 | 40 |
| 20-22 | 69 |
| 25-27 | 80 |
| 30-32 | 123 |
| 34-36 | 213 |
| 39-46 | (b) |
| Test well 6 | |
| 21-23 | 58 |
| 26-28 | 57 |
| 31-33 | 63 |
| 36-38 | 121 |
| 41-43 | 342 |
| 46-48 | 626 |
| 50.5-52.5 | 398 |
| 52.5- | (b) |
| Test well 7 | |
| 12-14 | 56 |
| 17-19 | (a) |
| 22-24 | 49 |
| 27-29 | 60 |
| 32-34 | 65 |
| 37-39 | (a) |
| 40-42 | 216 |
| 42-44 | 416 |
| 44-46 | (b) |
| Test well 8 | |
| 15-17 | 136 |
| 20-22 | 156 |
| 25-27 | 101 |
| 30-32 | 180 |
| 35-37 | 272 |
| 40-42 | 476 |
| 45-47 | 523 |
| 47-49 | (b) |
| Test well 9 | |
| 9-11 | 107 |
| 14-31 | (a) |
| 34-36(c) | 252 |
| 36-38(c) | 307 |
| Test well 10 | |
| 9-11 | 382 |
| 14-16 | 63 |
| 19-21 | 72 |
| 24-26 | 130 |
| 29-31 | 173 |
| 34-36 | 302 |
| 39-41 | 481 |
| 44-46 | 653 |
| 49-51 | 664 |
| 53-55 | 945 |
| 55- | (b) |
| Test well 11 | |
| 16-18 | 107 |
| 21-23 | 92 |
| 26-28 | 137 |
| 31-33 | 152 |
| 36-38 | 272 |
| 41-43 | 516 |
| 46-48 | 470 |
| 48- | (b) |
| Test well 12 | |
| 23-25 | 97 |
| 28-30 | 142 |
| 33-35 | 177 |
| 38-40 | 362 |
| 43-45 | 591 |
| 48-50 | 691 |
| 50-52 | (b) |
| Test well 13 | |
| 28-30 | 152 |
| 33-35 | 182 |
| 38-40 | 446 |
| 40-42 | 501 |
| 42- | (b) |
| Test well 14 | |
| 12-14 | 51 |
| 17-19 | 62 |
| 22-24 | 93 |
| 27-29 | 130 |
| 32-34 | 232 |
| 37-39 | 441 |
| 40.6-42.6 | 486 |
| 42.6- | (b) |
| Test well 15 | |
| 11-13 | 70 |
| 14-16 | 31 |
| 19-21 | (a) |
| 24-26 | 63 |
| 29-31 | 79 |
| 34-36 | 118 |
| 39-61 | (a) |
| 61-63 | 53 |
| 65-67 | 55 |
| 67- | (d) |
| Test well 16 | |
| 28-30 | 116 |
| 33-35 | 247 |
| 37.5-39.5 (c) | 377 |
| Test well 17 | |
| 24-26 | 84 |
| 29-31 | 86 |
| 34-36 | 255 |
| 39-41 | 272 |
| 44-46 | 142 |
| 48-50 | 216 |
| 50-51 | (b) |
| Test well 18 | |
| 28-30 | 70 |
| 33-35 | 81 |
| 38-40 | (a) |
| 40-42 | 323 |
| 43-45 | 292 |
| 46-48 | 107 |
| 48-49 | (b) |
| Test well 19 | |
| 20-22 | 71 |
| 25-27 | 71 |
| 30-32 | 83 |
| 35-37 | 97 |
| 40-42 | 91 |
| 42-44 | 85 |
| 44- | (d) |
| Test well 20 | |
| 28-30 | 69 |
| 33-35 | 69 |
| 38-40 | 71 |
| 43-45 | 70 |
| 47-49 | 2,240 |
| 49-50 | (b) |
| Test well 21 | |
| 22-24 | 72 |
| 27-29 | 70 |
| 32-34 | 69 |
| 37-39 | 68 |
| 42-44 | 67 |
| 47-49 | 571 |
| 52-54 | 1,870 |
| 54-56 | 1,720 |
| 55.5-57.5 | 1,620 |
| 57.5 | (b) |
| Test well 22 | |
| 26-28 | 68 |
| 31-33 | 69 |
| 36-38 | 109 |
| 41-43 | 235 |
| 46-48 | 820 |
| 51-53 | 1,280 |
| 52-54 | 1,170 |
| (SURVEY B) | |
| Test well 23 | |
| 18-20 | 77 |
| 23-25 | 75 |
| 28-30 | 69 |
| 33-35 | 84 |
| 38-40 | 203 |
| 43-45 | 342 |
| 48-50 | 701 |
| 50-52 | 741 |
| 53-55 | 1,430 |
| 56-58 | 1,690 |
| 57-59 | (b) |
| Test well 24 | |
| 14-16 | 1,790 |
| 19-21 | 6,930 |
| 24-26 | 7,800 |
| 29-31 | 18,900 |
| 31-33 | 25,000 |
| 33-34 | (b) |
| Test well 25 | |
| 24-26 | 21,500 |
| 29-31 | 43,400 |
| 34-36 | 41,500 |
| 36-38 | 49,000 |
| 38-39 | (b) |
| Test well 26 | |
| 22-24 | 42,800 |
| 27-29 | 41,500 |
| 29-31 | 47,100 |
| 31-60 | (b) |
| 60- | (d) |
| Test well 27 | |
| 14-16 | 1,800 |
| 19-21 | (a) |
| 23-25 | 24,800 |
| 28-30 | 43,200 |
| 30-33 | (b) |
| Test well 28 | |
| 14-16 | 630 |
| 19-31 | (a) |
| 33-35 | 17,900 |
| 38-40 | 42,200 |
| 40-42 | (b) |
| Test well 29 | |
| 24-26 | 2,550 |
| 29-31 | 25,000 |
| 34-36 | 44,600 |
| 39-41 | 46,500 |
| 41-42 | (b) |
| Test well 30 | |
| 26-28 | 28,400 |
| 31-33 | 46,500 |
| 35-37 | 47,100 |
| 37-38 | (b) |
| Test well 31 | |
| 12-14 | 267 |
| 17-19 | 1,530 |
| 22-24 | 7,800 |
| 27-29 | 32,000 |
| 32-34 | 40,900 |
| Test well 32 | |
| 32-34 | 14,200 |
| 37-39 | 39,500 |
| 39-40 | (b) |
| Test well 33 | |
| 23-25 | 1,900 |
| 28-30 | 6,800 |
| 33-35 | 39,000 |
| 38-40 | 50,300 |
| 41-43 | 50,900 |
| 43-44 | (b) |
| Test well 34 | |
| 22-24 | 1,920 |
| 27-29 | 8,500 |
| 32-34 | 37,000 |
| 37-39 | 45,900 |
| 39-40 | (b) |
| Test well 35 | |
| 19-21 | 1,100 |
| 24-26 | 7,820 |
| 29-31 | 36,500 |
| 34-36 | 39,600 |
| 36-37 | (b) |
| (a) No water obtained; probably clay or silt | |
| (b) Drove hard, no water obtained; probably hard clay or silt | |
| (c) Drove hard, probably hard silty or clayey sand | |
| (d) Could not drive deeper | |
It will be noted that there has been very little dilution of the brine within the distances sampled in survey B (Fig. 28) but considerable dilution has taken place at most of the points tested in survey A (Fig. 27), although the moving brine seems to have followed certain "pipes" or "veins" of more permeable material rather than having diffused uniformly. Thus the movement of brine from disposal pond B in Figure 27 seems to have been more directly toward test well 20, but in a general way toward test wells 20-23.
The results given in Table 21 indicate that in most of the test wells the maximum concentration of chloride is found just above a relatively impervious stratum - generally one through which it was difficult to drive the well point. In some test wells, however, impervious strata served to separate relatively fresher water above from salty water below as in no. 7 at 37-39 feet, no. 9 at 14-31 feet, no. 18 at 38-40 feet, no. 27 at 19-21 feet, and no. 28 at 19-31 feet. In a few test wells, such as no. 4, the maximum chloride content was found just above an impervious stratum and fresher water was encountered just below this bed, suggesting that the salty water was unable to reach the lower water-bearing bed. In some test wells, such as no. 20, there was a surprisingly sharp separation between layers of fresh and salt waters, but in others, such as nos. 6, 21, 22, and 23, the chloride concentration increased gradually with increase in depth.
Two of the test wells (4 and 23) put down in survey A were left cased so that further observations could be made; the rest of the test holes put down in the two surveys were filled, pulled, and plugged. The pipe in test well 4 was pulled back from an initial depth of 66.5 feet to 13 feet, but the pipe in test well 23 was left at the original depth of 59 feet. The periodic measurements of water levels and chloride determinations in these test wells through January 9, 1945 are given in Table 22. A rather gradual but noticeable increase in the chloride content took place in test well 23 throughout most of the period of record, but in test well 4 the significant increase did not occur until April 14, 1942 and later. As indicated in Table 22, the chloride content at a depth of 49 feet in test well 4 was 171 parts per million so that doubtless the chloride content at this depth by January 9, 1945 was considerably higher than 2,380 parts per million - the value for a depth of only 13 feet.
Table 22--Water level and chloride content of water in test wells 4 and 23 from 1938 through 1944.
| Date | Test well 4 (Depth 13 feet) |
Test well 23 (Depth 59 feet) | ||
|---|---|---|---|---|
| Depth to water level (feet) |
Chloride content (parts per million) |
Depth to water level (feet) |
Chloride content (parts per million) | |
| 22-Nov-38 | 8.89 | 53 | ||
| 23-Dec-38 | 10.63 | 1,690 | ||
| 17-Jul-39 | 9.29 | 69 | 10.86 | 1,930 |
| 14-May-40 | 9.52 | 67 | 11.11 | 2,680 |
| 05-Dec-40 | 10.35 | 72 | 11.92 | 1,770 |
| 08-Apr-41 | 10.03 | 70 | 11.65 | 2,430 |
| 16-Jul-41 | 8.36 | 73 | 10.06 | 2,350 |
| 20-Oct-41 | 9.25 | 86 | 10.90 | 2,510 |
| 14-Apr-42 | 8.57 | 550 | 10.25 | 2,390 |
| 13-Jul-42 | 7.69 | 890 | 9.42 | 3,060 |
| 07-Oct-42 | 4.80 | 1,170 | 6.59 | 3,400 |
| 08-Apr-43 | 6.13 | 1,480 | 7.79 | 3,440 |
| 24-Jul-43 | 6.04 | 1,700 | 7.66 | 3,520 |
| 12-Oct-43 | 8.47 | 1,870 | 10.05 | 3,900 |
| 05-Apr-44 | 7.32 | 2,380 | 9.01 | 3,970 |
| 11-Jul-44 | 7.27 | 3,640 | ||
| 26-Sep-44 | 7.00 | 2,370 | 8.55 | 3,880 |
| 09-Jan-45 | 7.57 | 2,380 | 5.14 | 4,070 |
Quality Of Water In Relation To Stratigraphy
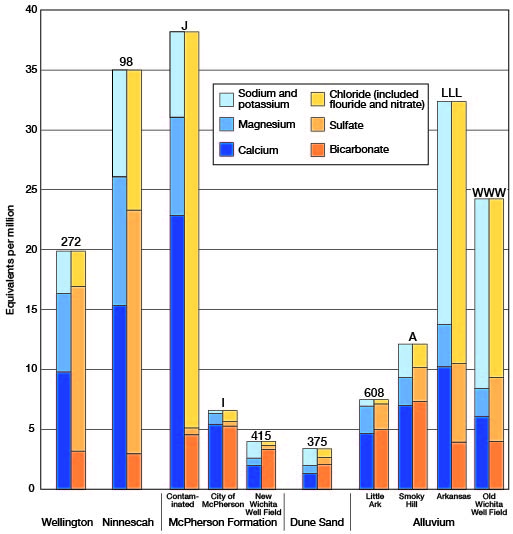
The chemical quality of the water in the principal water-bearing formations of this area has been discussed above for each formation separately. Analyses of water representative of the several formations are shown graphically on Figure 29. The graphs afford a comparison of the different waters, show variations in quality within the McPherson formation and alluvium, and indicate the effect of contamination.
Figure 29--Analyses of waters from principal water-bearing formations in south-central Kansas.
Sanitary Considerations
The analyses of water given in Table 13 show only the amounts of dissolved mineral matter in the water and do not indicate the sanitary quality of the water. An abnormal amount of certain mineral matter, such as nitrate, however, may indicate pollution of the water.
A large part of the population of this area is supplied with water from carefully constructed city-supply wells which meet the requirements of and are periodically inspected by the Division of Sanitation of the Kansas State Board of Health. However, much of the population is dependent upon private water supplies from wells, and every precaution should be taken to protect these supplies from pollution. A well should not be located where there are possible sources of pollution, such as points just downstream from barnyards, privies, and cesspools, and every well should be tightly sealed down to a level somewhat below that of the water table. As a general rule, dug wells are more subject to contamination from surface water than are drilled wells, chiefly because they generally are not effectively cased or sealed at the surface. Drilled wells generally are well protected by the casing, although many are poorly sealed at the top.
Prev Page--Ground-water Discharge || Next Page--Utilization of Water
Kansas Geological Survey, South-central Kansas
Comments to webadmin@kgs.ku.edu
Web version April 2005. Original publication date July 1949.
URL=http://www.kgs.ku.edu/Publications/Bulletins/79/14_qual.html