![]()
Prev Page--Water-bearing Materials || Next Page--Disposal
Ground Water
Principles of Occurrence
The following discussion on the occurrence of ground water has been adopted from Meinzer (1923, pp. 2-102), and the reader is referred to his report for a more complete discussion of the subject. A summary of ground-water conditions in Kansas has been made by Moore (1940) and published by the State Geological Survey of Kansas.
Ground water, or underground water, is the water that supplies springs and wells. The rocks that form the outer crust of the earth are at very few places solid throughout, but contain numerous open spaces called voids or interstices. These open spaces are the receptacles that hold the water that is found below the surface of the land and is recovered in part through wells and springs. There are many kinds of rocks and they differ greatly in the number, size, shape, and arrangement of their interstices and hence in their ability to hold and transmit water. Therefore, the character, distribution, and structure of the rocks of any region determine the occurrence of ground water.
The amount of water that can be stored in any rock depends upon the volume of the rock that is occupied by open spaces, that is, the porosity of the rock. The porosity is expressed as the percentage of the total volume of the rock that is occupied by interstices. A rock is said to be saturated when all its interstices are filled with water. The porosity of a sedimentary rock is controlled by (1) the shape and arrangement of the constituent particles, (2) the degree of assortment of its particles, (3) the cementation and compaction to which it has been subjected since its deposition, (4) the removal of mineral matter through solution by percolating waters, and (5) the fracturing of the rocks, resulting in joints and other openings. Well-sorted deposits of unconsolidated silt, sand, or gravel have a high porosity, but poorly sorted deposits have a much lower porosity because the small grains fill the voids between the large grains, thus reducing the amount of open space. The pore space in some well-sorted deposits of sand or gravel may gradually be filled with cementing material, thus reducing the porosity.
The capacity of a rock to hold water is determined by its porosity, but its capacity to yield water is determined by its permeability. The permeability of a rock may be defined as its capacity for transmitting water under pressure, and is measured by the rate at which it will transmit water through a given cross section under a given difference of head per unit of distance. Rocks that will not transmit water may be said to be impermeable. Some deposits, such as well-sorted silt or clay, may have a high porosity but because of the minute size of the pores will transmit water very slowly. Other deposits, such as well-sorted gravel containing large openings that communicate freely with one another, will transmit water very readily. Part of the water in any deposit is not available to wells because it is held against the force of gravity by molecular attraction-that is, by the cohesion of the water itself and by its adhesion to the walls of the pores.
Below a certain level, which in this area ranges from less than 10 feet to more than 100 feet below the surface, the permeable rocks are saturated with water. These saturated rocks are said to be in the zone of saturation, and the upper surface of this zone is called the water table. Wells dug or drilled into the zone of saturation will become filled with ground water to the level of the water table.
The permeable rocks that lie above the zone of saturation are said to be in the zone of aeration. As water from the surface percolates slowly downward to the zone of saturation, part of it is held in the zone of aeration by molecular attraction. In fine-grained material there is a moist belt in the zone of aeration just above the water table which is known as the capillary fringe. Although water in the zone of aeration is not available to wells, much of the water in the upper part of the zone may be withdrawn and discharged into the atmosphere by the transpiration of plants and by evaporation from the soil.
The Water Table
Shape and Slope
The water table is defined as the upper surface of the zone of saturation except where that surface is formed by an impermeable body (Meinzer, 1923a, p. 32). It may also be regarded as the boundary between the zone of saturation and the zone of aeration. The water table is not a static, level surface, but rather it is generally a sloping surface which shows many irregularities caused by differences in permeability of the water-bearing materials or by unequal additions of water to the ground-water reservoir at different places.
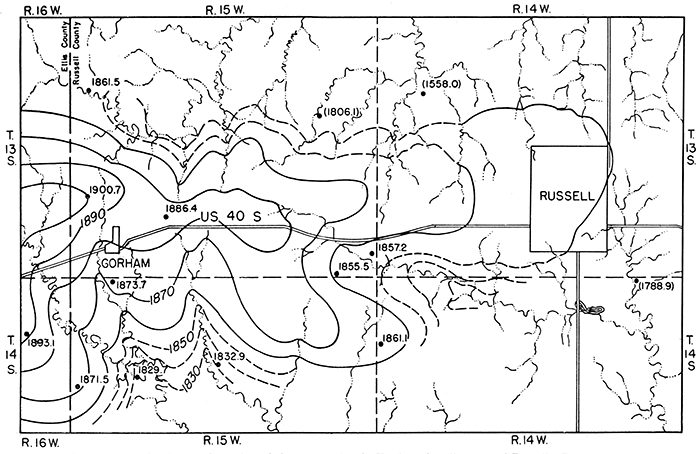
The shape and slope of the water table in west-central Russell County are shown in figure 4. Water here occurs in Tertiary sediments that mantle the upland. The shape of the water table is largely controlled by the topography. Water moves outward from the divide area, at tight angles to the contours, and is discharged along the sides of valleys as seeps in places where the base of the Tertiary deposits is exposed. In some places water probably moves out of the Tertiary deposits directly into alluvium which partly fills these small valleys, and thence through the alluvium to the valleys of Smoky Hill and Saline rivers. Water occurs under similar conditions in the Pleistocene terrace deposits along the major stream valleys and in alluvium, but in these areas data are lacking for the construction of contour maps.
Fluctuations
The water table does not remain in a stationary position, but fluctuates up and down much like the water in a surface reservoir. If the inflow to the underground reservoir exceeds the draft, the water table will rise; conversely, if the draft exceeds the inflow the water table will decline. Thus the rate and magnitude of fluctuations of the water table depend in large part upon the rate at which the underground reservoir is replenished or depleted.
Figure 4--Contour map showing configuration of the water table in Tertiary deposits west of Russell. Dots represent locations of wells; figures are altitudes of the water levels, in feet. Figures enclosed in parentheses indicate wells that. end in alluvium. Contour interval 10 feet. A larger PDF version of this figure is available.
The principal factor controlling the rise or decline of the water table in the Tertiary deposits in this area is the amount of precipitation within the area that passes through the soil and descends to the water table. The fluctuations of the water table in the Tertiary deposits are also dependent upon the amount of water that percolates into them laterally from higher areas west of this area. The fluctuations of the water table in the Pleistocene terrace deposits and alluvium are controlled largely by local precipitation plus recharge from small streams and additions of water by percolation through these deposits from outside this area. All of these factors depend on precipitation either in or near this area. The relation between the amount of precipitation and the level at which the water stands in wells is complicated by several factors, however. After a long dry period, the soil moisture becomes depleted through evaporation and transpiration and when a rain does occur the soil moisture must be replenished before any water can descend to the water table. During the winter when the ground is frozen the water falling on the surface is hindered from reaching the water table, and during the hot summer months some of the water that falls as rain is lost directly into the air by evaporation. Where the water table stands comparatively far below the surface it generally fluctuates less in response to precipitation than it does where it is comparatively shallow.
The factors controlling the decline of the water table are the amount of water pumped from wells, the amount of water absorbed directly from the water table by plants (transpiration), the amount of water lost from the ground-water reservoir by direct evaporation, the loss of water from springs, and the amount of ground water passing beneath the surface into adjacent areas. All of these factors are important in Ellis and Russell counties, although the effect of pumpage from wells is slight.
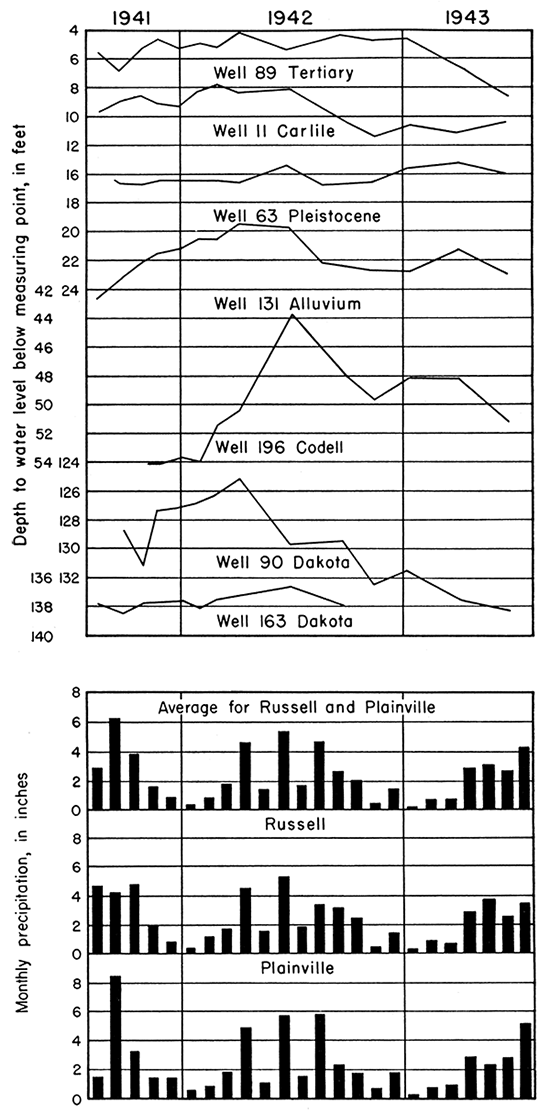
Changes in the water levels in wells record the fluctuations of the water table or piezometric surface, which in turn record the recharge and discharge of the ground-water reservoir. In order to determine the character and magnitude of water-level fluctuations in this area, several wells were selected in both Ellis and Russell counties for observation, and periodic measurements of the depth to water level in them were begun in August, 1941. The wells were observed monthly through March, 1942, and thereafter were observed once every two or three months. Measurements were made by Gordon Shaffer from August, 1941, to May, 1942, and after that date by John McFarland. Complete records of these wells are published annually by the Federal Geological Survey, beginning in Water-Supply Paper 938 (Meinzer and Wenzel, 1943, pp. 59, 60, 130-132). The numbers of the observation wells previously published and the numbers used in this report are given in table 9.
Table 9--Observation wells in Ellis and Russell counties.| Well No. in this report |
County | Well No. in Water-Supply Paper 938 |
|---|---|---|
| 11 | Russell County | 95 |
| 33 | Russell County | 126 |
| 39 | Russell County | 117 |
| 61 | Russell County | 152 |
| 62 | Russell County | 151 |
| 63 | Russell County | 146 |
| 70 | Russell County | 148 |
| 83 | Russell County | 149 |
| 89 | Russell County | 80 |
| 90 | Russell County | 81 |
| 38 | Russell County | 116 |
| 108 | Russell County | 8 |
| 131 | Russell County | 45 |
| 163 | Russell County | 49 |
| 164 | Ellis County | 215 |
| 191 | Ellis County | 218 |
| 196 | Ellis County | 225 |
| 224 | Ellis County | 190 |
The fluctuations of the water level in six typical observation wells in Russell County and one in Ellis County are shown in figure 5, together with records of the monthly precipitation at Russell and Plainville and the average for the two stations. As shown in figure 5, the fluctuations of the water level in only a few of the wells show close correlation with the precipitation at Russell and Plainville, part of which results from the infrequency of measurements after March, 1942. The water levels in wells 11, 63, and 89 are relatively shallow, and hence might be expected to fluctuate in close accord with the precipitation. The water level in well 11 fluctuates in rather close accord with the precipitation, but there is less correlation between the water levels in wells 63 and 89 and the precipitation. The hydrograph of well 131 shows a rising water level during the spring of 1942 and a decline during the fall, which is in conformity with the precipitation record; however, the water level in this well rose during the fall and winter of 1941, which was a period of declining precipitation. The rather inadequate record of water level in well 196 seems to show a generally close correlation with the precipitation. The water levels in wells that end in the Dakota formation (Nos. 90 and 163) seem to show little or no correlation with the precipitation which is to be expected inasmuch as the water level in those wells lies at considerable depth and the area of outcrop of the Dakota is at a considerable distance from the wells.
Figure 5--Hydrographs of seven typical observation wells in Ellis and Russell counties and monthly precipitation at Russell and Plainville (precipitation data from U. S. Weather Bureau).
Artesian Water
Occurrence
Artesian water is water that occurs in a pervious bed and is confined to its containing bed by impervious strata above and below. When a well is drilled into such a water-bearing formation, water will rise in the well above the level at which it is first encountered. Wells in this area that are drilled into sandstones in the Dakota formation. and into the Codell sandstone member of the Carlile shale encounter artesian water.
Head
Water occurring in these beds is confined under hydrostatic pressure; however, except at a few places, it does not rise above the general level of the water table and in many places the water level in wells tapping sandstones in the upper part of the Dakota formation is more than 100 feet lower than the water level in near-by wells that tap Tertiary, Pleistocene, or younger Cretaceous deposits at shallower depths. For example, the altitude of the water level in well 61, in Greenhorn limestone, is 1,767.01 feet, whereas in well 62, less than 50 yards distant and penetrating a sandstone in the Dakota formation, the altitude of the water level is only 1,625.83 feet (table 14). Similarly, the altitude of the water level in well 89, in Tertiary deposits, is 1,832.94 feet, whereas the altitude of the water level in near-by well 90, in a sandstone of the Dakota formation, is only 1,749.24 feet.
The artesian pressure of water in the Dakota formations varies in the different sandstone beds. This was determined in several of the test holes in which water-level measurements were made each time a different sandstone bed was encountered. These water-level measurements were made through a stem tester during the progress of drilling so all other water-bearing formations probably were effectively sealed off. The measurements were not made until the tester had been in place several hours so it can be assumed that the measurements represent approximately the true water level. In test hole 5, in west-central Russell County, it was found that water in a sandstone of the Dakota formation between depths of 134 and 160 feet rose to a level 67.35 feet below the surface; water in another sandstone between depths of 240 and 260 feet rose to a level 120.66 feet below the surf ace; and water in a sandstone between depths of 4f5 and 500 feet rose to within 18.20 feet of the surface. Similar conditions were encountered in test hole 2 in southwestern Russell County. In this test hole, water-level measurements were made in six distinct sandstones at depths ranging from 200 to 533 feet and the levels of water encountered in the sandstones, in descending order, were as follows: 158.54, 158.78, 168.53, 161.31, 159.28, 164.35, and 28.65 feet. Seemingly in most places the water in the deeper sandstone beds is under much greater head than water in the shallower sandstone beds of the Dakota formation; however, this situation was not encountered in all test holes. All water-level measurements in test hole 3 in Ellis County indicated water levels of more than 230 feet below the surface. In test hole 1, east of Russell, the water levels in successively deeper sandstones were found at successively lower levels, and were as follows: 187.92, 190.45, and 242.04 feet.
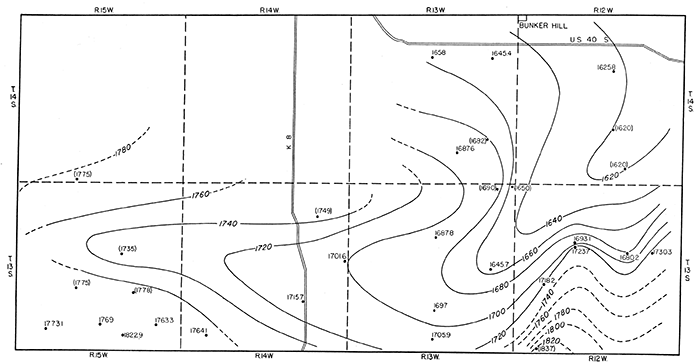
Contour maps have been drawn in order to show the configuration of the pressure-indicating surface of water contained in the Codell sandstone and the upper sandstones of the Dakota formation (figs. 6 and 7). The map in figure 6 shows a dome on the pressure-indicating surface of water in the Codell sandstone. The dome is an area of recharge for this formation from which water is moving outward in all directions. The rate of movement of water through this sandstone is probably rather slow in spite of the steep hydraulic gradient shown locally by the contours, because the permeability of this sandstone is quite low. Figure 7 shows a distinct trough in the pressure-indicating surface of water in the Dakota sandstone. This is not a reflection of structure, as can be seen by comparison with the map in figure 3, and possibly can be accounted for by the supposition that it may represent a zone of greater than average permeability in the sandstones which thus allows more rapid movement of ground water along this zone toward a point of discharge east of this area.
Figure 6--Contour map of north-central Ellis County showing the configuration of the pressure-indicating surface of water in the Codell sandstone member of the Carlile shale. Dots represent locations of wells, and figures indicate altitudes of the water levels, in feet. Figures enclosed in parentheses are based on altitudes determined from topographic maps of the U. S. Geological Survey; others are based on instrumental levels. Contour interval 10 feet,
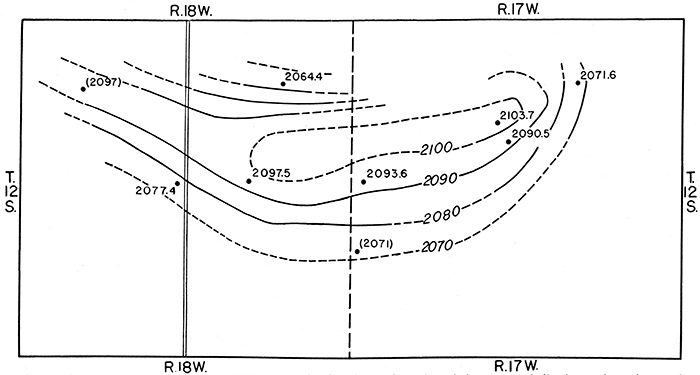
Figure 7--Contour map of southern Russell County showing the configuration of the pressure-indicating surface of water in the uppermost sandstone beds of the Dakota formation. Dots represent locations of wells, and figures are altitudes of the water level, in feet. Figures enclosed in parentheses are based on altitudes determined from topographic maps of the U. S. Geological Survey; others are based on instrumental levels. Contour interval 20 feet. A larger PDF version of this figure is available.
Recovery
The following discussion on the principles of recovery of ground water has been adopted in part from Lohman (1938, pp. 54-56).
When water is withdrawn from a well there is a difference in head between the water inside the well and the water in the surrounding material at some distance from the well. The water table or pressure-indicating surface in the vicinity of a well that is discharging water has a depression resembling in form an inverted cone, the apex of which is at the well. This depression of the water table is known as the cone of influence or cone of depression, and the surface area affected by it is known as the area of influence. In any given well the greater the pumping rate the greater will be the draw-down (depression of the water level, commonly expressed in feet) and the greater will be the diameter of the cone of influence and of the area of influence.
The specific capacity of a well is its rate of yield per unit of drawdown and is generally stated in gallons a minute per foot of drawdown. When a well is pumped the water level drops rapidly at first and then more slowly, but. it may continue to decline for several hours or days. In testing the specific capacity of a well, therefore, it is important to continue pumping until the water level remains approximately stationary. When the pump is stopped the water level rises rapidly at first, then more slowly, and may continue to rise long after pumping has ceased.
The character and thickness of the water-bearing materials have a definite bearing on the yield and draw-down of a well, and hence on the specific capacity of a well. Draw-down increases the height that the water must be lifted in pumping a well, thus increasing the cost of pumping. If the water-bearing material is coarse and of fairly uniform size it will readily yield large quantities of water to a well with a minimum draw-down; if the water-bearing material is fine and poorly sorted it will offer more resistance to the flow of water into a well, thereby decreasing the yield and increasing the draw-down. Other things being equal, the draw-down of a well varies inversely with the permeability of the water-bearing material.
Wells in Consolidated Rocks
Most of the wells in these counties that obtain water from the sandstones of the Dakota formation or from the Codell sandstone member of the Carlile shale are drilled wells. Some of these wells penetrate consolidated rocks to depths of several hundred feet. Most of them have been drilled by the cable-tool method but in recent years a few have been drilled by the hydraulic rotary method. A few dug wells have been used to recover water from these water-bearing beds in places where the rocks occur close to the surface. In many places dug wells are used for obtaining water from the upper weathered part of the Greenhorn limestone. Many of the drilled wells in consolidated rocks are open-end wells--that is, wells that are cased only through the upper part of the hole so that water may enter the well along its uncased part wherever the rock is water-bearing. In many localities, however, the sandstones of the Dakota formation cave to such an extent that it is necessary to case the entire hole and place a screen or perforated casing opposite the water-bearing beds.
Wells in Unconsolidated Deposits
Somewhat more than half of the wells visited in Russell and Ellis counties obtain supplies of water from unconsolidated deposits of Recent, Pleistocene, or Tertiary age. Most of the wells in these -deposits are dug or drilled. Some of the dug wells in the unconsolidated deposits obtain water from rather poor water-bearing material, but because the diameter of the wells is large, a great infiltration area and considerable storage of water are provided. Because they generally extend only a few feet below the water table, dug wells are more apt to fail during dry seasons than deeper drilled wells. Also they generally are more subject to contamination than drilled wells. Some of the drilled wells in these deposits are cased to the bottom and receive water only through the open. end of the casings. The intake area, and consequently the efficiency, of many of the drilled wells in unconsolidated deposits have been greatly increased by the use of well screens or perforated casings, some of which are gravel packed.Utilization of Water
Domestic and stock water supplies in the rural areas are, for the most part, obtained from wells. Of the 163 wells in Russell County for which records are given in table 13, 91 were used to supply water for stock, 23 supplied water for domestic use, 16 for both domestic and stock uses, and 33 wells were not in use when visited. Records of 69 wells in Ellis County are given in table 14, and of these 33 supplied water for stock, 19 for domestic use, 7 for both domestic and stock use, and 10 were not in use when visited.
Domestic and Stock Supplies
The domestic wells supply water in the homes for drinking, cooking, and washing, and in schools other than those supplied by municipal wells, and provide water for the irrigation of small gardens. The stock wells supply drinking water for livestock. Domestic and stock supplies are obtained from dug and drilled wells ranging in depth from less than 20 to more than 300 feet, The quality of this water is discussed in another section. In general, the ground waters in this area are reported to be of good quality, but some are too highly mineralized for most uses. Many of the wells for stock use are equipped with cylinder pumps and operated by windmills.
Irrigation Supplies
Irrigation from wells has not been extensively practiced in Russell and Ellis counties. One well in alluvium along the Saline valley east of Fairport has been pumped for irrigation. For the most part, none of the water-bearing formations underlying this area will yield large quantities of water to an individual well. They do not have a sufficiently high permeability, saturated thickness, or recharge area to allow the extensive development of irrigation wells. Irrigation wells yielding as much as 500 gallons a minute might be obtainable in the narrow strips of alluvium along Smoky Hill and Saline rivers and Big creek, and possibly also in a few local areas underlain by upland Tertiary and Pleistocene deposits in the vicinity of Gorham and Dorrance., Owing to their low permeabilities, the sandstones of the Dakota formation, the Codell sandstone member of the Carlile shale, and the mantle rock developed on the Greenhorn limestone probably will not yield more than 100 gallons a minute to wells anywhere in this area. At most places the maximum yield of properly constructed wells in these formations probably will be much less than 100 gallons a minute, and at many places the maximum yield obtainable will probably be less than 10 gallons a minute.
Municipal Supplies
Only three cities in or immediately adjacent to the area covered by this report have municipal water supplies. Of these, two obtain water from wells and one from surface sources.
Russell, the county seat of Russell County, had a population of 4,706 in 1940 according to the federal census. The city obtains its water supply from Smoky Hill river and Big creek, whence it is pumped to a reservoir on Fossil creek 1 mile south of the city. The pump at Smoky Hill river has a capacity of 700 gallons a minute; that at Big creek has a capacity of 350 gallons a minute. According to the Kansas State Board of Health, the city water plant has a rated capacity of 1,050,000 gallons a day. Storage is provided by an elevated tank having a capacity of 720,000 gallons.
Bunker Hill, in east-central Russell County, had a population of 249 in 1940 according to the federal census. The water supply is obtained from two 8-inch drilled wells in sandstone of the Dakota formation. The wells are reported to be 250 feet deep, and have perforated casing in the lower 10 feet. The water levels are reported to be 225 feet below land surface. Each well is equipped with an electrically driven plunger pump having a rated capacity of 18 gallons a minute, but one well is reported to pump dry after prolonged pumping at this rate. According to the Kansas State Board of Health, the water plant has a rated capacity of 40,000 gallons a day. Storage is provided by an elevated tank having a capacity of 50,000 gallons. A chemical analysis of the water is given in table 10.
Victoria, in east-central Ellis County, had a population of 858 in 1940 according to the federal census. Its water supply is obtained from four dug wells in unconsolidated deposits of Pleistocene or Tertiary age. The wells are reported to be 35 feet deep and are equipped with electrically driven pumps. According to the Kansas State Board of Health, the water plant has a rated capacity of 490,000 gallons a day. Storage is provided by an elevated tank having a capacity of 50,000 gallons. A chemical analysis of the water is given in table 11.
Although the city of Gorham in west-central Russell County had no municipal water supply, the construction of such a supply was started in 1941. One well was drilled in the unconsolidated sand and gravel of Tertiary age underlying the upland surface northeast of the city. When this well was visited in 1941, however, the well had not yet been test pumped, and no specific data were available.
Quality of Water
The chemical character of ground waters in this area is indicated by analyses in tables 10, 11, and 12, and in figures 8 and 9. The analyses were made by Howard Stoltenberg in the Water and Sewage Laboratory of the Kansas State Board of Health. Thirty-four samples of water were collected for chemical analysis from representative wells distributed as uniformly as possible within the area and among the water-bearing formations. Analyses of the water pumped from the municipal wells at Bunker Hill and Victoria also are given in tables 10 and 11. Fifteen other samples were collected from several sandstones of the Dakota formation encountered in the test holes. Samples of water for chloride analysis were collected from 158 of the 163 wells visited in Russell County, and from each of the 69 wells visited in Ellis County, the results of which are given in tables 10 and 11.
Table 10--Analyses of water from typical wells in Russell County. Analyzed by Howard Stoltenberg, Parts per million1 and equivalents per million 2 (in italics)
| Well No. on Plate 1 |
Location | Depth (feet) |
Geologic horizon |
Date of collection, 1942 |
Temp. (°F) |
Iron (Fe) |
Calcium (Ca) |
Magnesium (Mg) |
Sodium and Potassium3 (Na+K) |
Bicarbonate (HCO3) |
Sulphate (SO4) |
Chloride (Cl) |
Fluoride (F) |
Nitrate (NO3) |
Total dissolved solids3 |
Hardness (calculated as CaCO3) |
||
|---|---|---|---|---|---|---|---|---|---|---|---|---|---|---|---|---|---|---|
| Total | Carbonate | Noncarbonate | ||||||||||||||||
| T. 11 S., R. 15 W. | ||||||||||||||||||
| 4 | SE sec. 8. | 23.1 | Pleistocene | May 8 | 58 | 0.68 | 209 10.43 |
24 1.97 |
59 2.56 |
439 7.20 |
183 3.81 |
58 1.64 |
0.4 .02 |
142 2.29 |
896 | 620 | 360 | 260 |
| 5 | NE sec. 10. | 31.4 | Greenhorn | May 8 | 58 | 3.4 | 81 4.04 |
19 1.56 |
86 3.75 |
185 3.03 |
49 1.02 |
40 1.13 |
.6 .03 |
257 4.14 |
629 | 280 | 152 | 128 |
| T. 12 S., R. 14 W. | ||||||||||||||||||
| 14 | SE sec. 10 | 15.2 | Alluvium | May 8 | 53 | .28 | 235 11.73 |
17 1.40 |
64 2.78 |
384 6.30 |
228 4.74 |
61 1.72 |
.2 .01 |
195 3.14 |
992 | 656 | 315 | 341 |
| 19 | SE sec. 20 | 18.5 | Alluvium | May 8 | 53 | .96 | 156 7.78 |
9.6 .79 |
37 1.63 |
361 5.92 |
68 1.41 |
28 .79 |
.3 .02 |
128 2.06 |
608 | 428 | 296 | 132 |
| 22 | SW sec. 34. | 29.6 | Alluvium | May 8 | 60 | .73 | 199 9.93 |
24 1.97 |
62 2.70 |
360 5.90 |
340 7.07 |
43 1.21 |
.5 .03 |
24 .39 |
873 | 595 | 295 | 300 |
| T. 12 S., R. 15 W. | ||||||||||||||||||
| 23 | NW sec. 4 | 20.5 | Alluvium | May 8 | 58 | 4.6 | 224 11.18 |
15 1.23 |
49 2.12 |
273 4.48 |
288 5.99 |
97 2.74 |
.5 .03 |
80 1.29 |
895 | 620 | 224 | 396 |
| 31 | SW sec. 32 | 25.6 | Tertiary | May 8 | 56 | 6.7 | 662 33.03 |
41 3.37 |
106 4.63 |
296 4.85 |
1,394 29.00 |
122 3.44 |
.8 .04 |
230 3.70 |
2,710 | 1,820 | 242 | 1,578 |
| T. 13 S., R. 14 W. | ||||||||||||||||||
| 41 | NW sec. 30 | 183.7 | Dakota | May 21 | 58 | 5.2 | 39 1.95 |
42 3.45 |
2,027 88.17 |
496 8.13 |
550 11.44 |
2,610 73.60 |
4.5 .24 |
9.7 .16 |
5,535 | 270 | 2704 | 0 |
| T. 13 S., R. 15 W. | ||||||||||||||||||
| 43 | SE sec. 2 | 30.6 | Alluvium | May 8 | 60 | 9.6 | 403 20.11 |
33 2.71 |
95 4.31 |
277 4.54 |
959 19.95 |
82 2.31 |
.7 .04 |
7.1 .11 |
1,728 | 1,141 | 227 | 914 |
| 51 | NW sec. 30 | 25.0 | Tertiary | May 21 | 57 | .12 | 84 4.19 |
10 .82 |
20 .88 |
248 4.07 |
27 .56 |
14 .39 |
.4 .02 |
53 .85 |
332 | 250 | 204 | 46 |
| 52 | SW sec. 34 | 23.1 | Tertiary | May 21 | 52 | .63 | 427 21.31 |
47 3.86 |
205 8.93 |
310 5.08 |
434 9.03 |
460 12.97 |
.5 .03 |
434 6.99 |
2,163 | 1,258 | 254 | 1,004 |
| T. 14 S., R. 11 W. | ||||||||||||||||||
| 55 | SW sec. 14 | 44.2 | Pleistocene | May 4 | 59 | 6.4 | 109 5.44 |
9.0 .74 |
24.0 1.03 |
280 4.59 |
40 .83 |
48 1.35 |
.2 .01 |
27 .43 |
404 | 309 | 230 | 79 |
| 58 | NE sec. 30 | 34.1 | Pleistocene | May 4 | 58 | 6.7 | 203 10.13 |
17 1.40 |
71 3.09 |
268 4.40 |
72 1.50 |
26 .73 |
.2 .01 |
496 7.98 |
1,026 | 576 | 220 | 356 |
| T. 14 S., R. 12 W. | ||||||||||||||||||
| A5 | NE SW sec. 6 | 250 | Dakota | Dec. 11 | 4.2 | 148 7.38 |
19 1.56 |
281 12.20 |
317 5.20 |
166 3.45 |
440 12.41 |
.7 .04 |
2.6 .04 |
1,270 | 447 | 260 | 187 | |
| 61 | SE sec. 10 | 30.8 | Greenhorn | May 4 | 55 | .26 | 102 5.09 |
11 .90 |
29 1.27 |
228 3.74 |
63 1.31 |
22 .62 |
.6 .03 |
97 1.56 |
439 | 300 | 187 | 113 |
| 62 | SE sec. 10 | 183.9 | Dakota | May 4 | 55 | 24 | 101 5.04 |
12 .99 |
29 1.28 |
227 3.72 |
65 1.35 |
23 .65 |
.6 .03 |
97 1.56 |
466 | 302 | 186 | 116 |
| 65 | SE sec. 34 | 78.8 | Dakota | May 4 | 59 | 6.4 | 43 2.14 |
20 1.64 |
601 26.15 |
406 6.66 |
208 4.33 |
665 18.75 |
1.5 .08 |
7.1 .11 |
1,755 | 189 | 1896 | 0 |
| T. 14 S., R. 13 W. | ||||||||||||||||||
| 68 | SW sec. 12 | 244.6 | Dakota | May 4 | 59 | 40.0 | 126 6.29 |
14 1.15 |
72 3.11 |
195 3.20 |
235 4.89 |
85 2.40 |
.7 .04 |
1.5 .02 |
672 | 372 | 160 | 212 |
| T. 14 S., R. 14 W. | ||||||||||||||||||
| 77 | NW sec. 1 | 19.5 | Alluvium | May 4 | 53 | 1.9 | 118 5.89 |
11 .90 |
35 1.51 |
282 4 62 |
32 .66 |
91 2.57 |
.3 .02 |
27 .43 |
458 | 340 | 231 | 109 |
| 80 | NE sec. 16 | 24.3 | Pleistocene | May 7 | 54 | .95 | 197 9.83 |
15 1.23 |
198 8.63 |
320 5.25 |
67 1.39 |
260 7.33 |
.3 .02 |
354 5.70 |
1,252 | 553 | 262 | 291 |
| 85 | SW sec 28 | 61.1 | Pleistocene | May 6 | 60 | 31 | 188 9.38 |
30 2.47 |
144 6.26 |
341 5.59 |
526 10.94 |
52 1.47 |
1.8 .09 |
1.4 .02 |
1,145 | 592 | 280 | 312 |
| T. 14 S., R. 15 W. | ||||||||||||||||||
| 92 | NW sec. 12 | 25.9 | Greenhorn | May 21 | 55 | 12 | 477 23.80 |
115 9.45 |
767 33.36 |
187 3.07 |
987 20.53 |
1,335 37.65 |
3.0 .16 |
323 5.20 |
4,112 | 1,662 | 154 | 1,508 |
| 95 | NW sec. 29 | 19.5 | Pleistocene | May 6 | 58 | .36 | 192 9.58 |
19 1.56 |
75 3.28 |
334 5.48 |
198 4.12 |
49 1.38 |
.5 .03 |
212 3.41 |
913 | 557 | 274 | 283 |
| T. 15 S., R. 12 W. | ||||||||||||||||||
| 100 | NW sec. 6 | 48.5 | Pleistocene | May 4 | 58 | 4.3 | 141 7.04 |
11 .90 |
41 1.78 |
323 5.30 |
135 2.81 |
32 .90 |
0.3 .02 |
43 .69 |
569 | 397 | 265 | 132 |
| 111 | SE sec. 31 | 244.5 | Dakota | May 4 | 61 | 8.5 | 42 2.10 |
29 2.38 |
1,163 50.60 |
458 7.51 |
345 7.18 |
1,420 40.04 |
3.0 .16 |
12 .19 |
3,252 | 224 | 2247 | 0 |
| T. 15 S., R. 14 W. | ||||||||||||||||||
| 127 | NE sec. 5 | 26.2 | Pleistocene | May 6 | 55 | .40 | 118 5.89 |
19 1.56 |
69 3.02 |
222 3.64 |
172 3.58 |
59 1.66 |
.5 .03 |
97 1.56 |
646 | 372 | 182 | 190 |
| 129 | NE sec. 7 | 174.2 | Dakota | May 6 | 60 | 4.6 | 22 1.10 |
21 1.73 |
1,438 62.57 |
459 7.53 |
306 6.36 |
1,815 51.18 |
5.0 .26 |
4.2 .07 |
3,846 | 142 | 1428 | 0 |
| T. 15 S., R. 15 W. | ||||||||||||||||||
| 145 | SE sec. 3 | 11.5 | Pleistocene | May 6 | 54 | 1.2 | 238 11.88 |
28 2.30 |
122 5.30 |
373 6.12 |
235 4.89 |
158 4.46 |
.3 .02 |
248 3.99 |
1,217 | 709 | 306 | 403 |
| 148 | SW sec. 6 | 12.9 | Alluvium | May 6 | 55 | .62 | 179 8.88 |
13 1.07 |
119 5.18 |
350 5.74 |
71 1.48 |
131 3.69 |
.3 .02 |
261 4.20 |
949 | 498 | 287 | 211 |
| 1. One part per million is equivalent to 1 pound of substance per million pounds of water or 8.33 pounds per million gallons of water. 2. An equivalent per million (e. p. m.) is a unit chemical equivalent weight of solute per million unit weights of solution. Concentration in equivalents per million is calculated by dividing concentration in parts per million by the chemical combining weight of the substance or ion. 3. Calculated. 4. Total alkalinity, 406 parts per million; excess alkalinity, 136 parts per million. 5. Sample from north well of two similar wells that supply city of Bunker Hill. 6. Total alkalinity, 333 parts per million; excess alkalinity, 144 parts per million. 7. Total alkalinity, 376 parts per million; excess alkalinity, 152 parts per million. 8. Total alkalinity, 376 parts per million; excess alkalinity, 234 parts per million. |
||||||||||||||||||
Table 11-Analyses of water from typical wells in Ellis County. Analyzed by Howard Stoltenberg, Parts per million 1 and equivalents per million2 (in italics).
| Well No. on Plate 1 |
Location | Depth (feet) |
Geologic horizon |
Date of collection, 1942 |
Temp. (°F) |
Iron (Fe) |
Calcium (Ca) |
Magnesium (Mg) |
Sodium and Potassium3 (Na+K) |
Bicarbonate (HCO3) |
Sulphate (SO4) |
Chloride (Cl) |
Fluoride (F) |
Nitrate (NO3) |
Total dissolved solids3 |
Hardness (calculated as CaCO3) |
||
|---|---|---|---|---|---|---|---|---|---|---|---|---|---|---|---|---|---|---|
| Total | Carbonate | Noncarbonate | ||||||||||||||||
| T. 11 S., R. 18 W. | ||||||||||||||||||
| 177 | NE sec. 30 | 65.3 | Codell | May 21 | 58 | 89 | 102 5.09 |
43 3.53 |
134 5.82 |
273 4.48 |
157 3.26 |
92 2.58 |
0.9 .05 |
252 4.06 |
1,008 | 431 | 224 | 207 |
| T. 12 S., R. 17 W. | ||||||||||||||||||
| 196 | NW sec. 30 | 61.0 | Codell | May 21 | 59 | 6.3 | 87 4.34 |
11 .90 |
6.4 .28 |
295 4.84 |
7.9 .16 |
10 .28 |
.4 .02 |
14 .22 |
291 | 262 | 242 | 20 |
| T. 13 S., R. 16 W. | ||||||||||||||||||
| 207 | SE sec. 16 | 23 | Tertiary | May 21 | 54 | .53 | 187 9.33 |
24 1.97 |
33 1.42 |
517 8.48 |
87 1.81 |
40 1.13 |
.1 .01 |
80 1.29 |
710 | 565 | 424 | 141 |
| 211 | NE sec. 31 | 23.8 | Tertiary | May 21 | 58 | .20 | 122 6.09 |
23 1.89 |
38 1.64 |
219 3.59 |
208 4.33 |
49 1.38 |
.9 .05 |
17 .27 |
568 | 399 | 180 | 219 |
| T. 13 S., R. 17 W. | ||||||||||||||||||
| 215 | NW sec. 7 | 29.3 | Alluvium | May 21 | 57 | 5.4 | 153 7.63 |
17 1.40 |
45 1.97 |
416 6.83 |
60 1.25 |
40 1.13 |
.2 .01 |
111 1.79 |
640 | 452 | 341 | 111 |
| 219 | NE sec. 28 | 13.8 | Pleistocene | May 21 | 58 | 2.0 | 230 11.48 |
39 3.20 |
79 3.45 |
446 7.31 |
463 9.63 |
40 1.13 |
.2 .01 |
3 .05 |
1,079 | 734 | 366 | 368 |
| T. 14 S., R. 17 W. | ||||||||||||||||||
| 4B | Sec. 12 | 35 | Pleistocene | .10 | 112 5.58 |
11 .90 |
16 .69 |
339 5.56 |
35 .73 |
14 .39 |
.2 .01 |
30 .48 |
445 | 324 | 278 | 46 | ||
| 1. One part per million is equivalent to 1 pound of substance per million pounds of water or 8.33 pounds per million gallons of water. 2. An equivalent per million (e. p. m.) is a unit chemical equivalent weight of solute per million unit weights of solution. Concentration in equivalents per million is calculated. by dividing concentration in parts per million by the chemical combining weight of the substance or ion. 3. Calculated. 4. Composite sample from four similar dug wells that supply city of Victoria. |
||||||||||||||||||
Table 12--Analyses of water from test holes drilled into sandstones of the Dakota formation in Russell and Ellis counties. Analyzed by Howard Stoltenberg. Parts per million 1 and equivalents per million2 (in italics).
| No. of test hole |
Location | Interval from which sample was collected |
Date of collection, 1942 |
Iron (Fe) |
Calcium (Ca) |
Magnesium (Mg) |
Sodium and Potassium3 (Na+K) |
Bicarbonate (HCO3) |
Sulphate (SO4) |
Chloride (Cl) |
Fluoride (F) |
Nitrate (NO3) |
Total dissolved solids3 |
Hardness (calculated as CaCO3) |
||
|---|---|---|---|---|---|---|---|---|---|---|---|---|---|---|---|---|
| Total | Carbonate | Noncarbonate | ||||||||||||||
| 1 | NW sec. 6, T. 14 S., R. 13 W. |
210-227 | Nov. 1941 | 0.10 .14 |
246 12.28 |
1.7 39.05 |
898 .0 |
0.0 4.56 |
219 22.98 |
815 .10 |
1.9 .00 |
0.0 | 2,603 | 621 | 6214 | 0 |
| 2 | SW cor. sec, 31, T. 15 S., R. 14 W. |
383-395 | Jan. 1942 | .10 | 451 22.50 |
454 37.32 |
8,811 383.29 |
672 11.02 |
2,739 56.97 |
13,300 375.06 |
1.2 .06 |
.0 .00 |
26,092 | 2,991 | 551 | 2,440 |
| 2 | SW cor. sec, 31, T. 15 S., R. 14 W. |
485-533 | Jan. 1942 | 58.0 | 623 31.09 |
567 46.61 |
15,310 665.96 |
1,244 20.40 |
3,756 78.12 |
22,875 645.08 |
1.2 .06 |
.0 .00 |
43,812 | 3,885 | 1,020 | 2,865 |
| 3 | SW cor. sec. 31, T. 12 S., R. 17 W. |
513-555 | Jan. 1942 | .13 | 38 1.90 |
36 2.96 |
1,395 60.69 |
426 6.99 |
435 9.05 |
1,750 39.35 |
3.0 .16 |
.0 .00 |
3,870 | 243 | 2435 | 0 |
| 3 | SW cor. sec. 31, T. 12 S., R. 17 W. |
593-630 | Jan. 1942 | .18 | 44 2.20 |
37 3.04 |
1,269 55.20 |
460 7.54 |
366 7.61 |
1,600 45.12 |
3.2 .17 |
.0 .00 |
3,549 | 262 | 2626 | 0 |
| 3 | SW cor. sec. 31, T. 12 S., R. 17 W. |
702-730 | Feb. 1942 | 58 | 435 21.71 |
746 61.32 |
9,811 436.79 |
1,952 32.01 |
2,592 53.91 |
15,000 423.00 |
.9 .05 |
53 .85 |
29,673 | 4,152 | 1,600 | 2,552 |
| 4 | NW sec. 14, T. 12 S., R. 16 W. |
224-250 | Mar. 1942 | .07 | 127 6.34 |
74 6.08 |
2,474 107.64 |
418 6.86 |
2,152 44.76 |
2,420 68.24 |
1.8 .09 |
7.1 .11 |
7,465 | 621 | 343 | 278 |
| 4 | NW sec. 14, T. 12 S., R. 16 W. |
388-420 | Mar. 1942 | .10 | 153 7.63 |
169 13.89 |
3,043 132.39 |
642 10.53 |
1,516 31.53 |
3,960 111.67 |
1.9 .10 |
5.3 .08 |
9,169 | 1,076 | 526 | 550 |
| 5 | Middle east line sec. 20, T. 14 S., R. 15 W. |
134-170 | Mar. 1942 | .96 | 94 4.69 |
52 4.27 |
2,062 89.72 |
418 6.86 |
453 9.42 |
2,910 82.06 |
2.5 .13 |
13 .21 |
5,796 | 448 | 343 | 105 |
| 5 | Middle east line sec. 20, T. 14 S., R. 15 W. |
234-270 | Mar. 1942 | 2.9 | 283 14.12 |
291 23.92 |
7,093 308.54 |
799 13.10 |
1,558 32.41 |
10,660 300.61 |
.7 .04 |
26 .42 |
20,314 | 1,902 | 655 | 1,247 |
| 5 | Middle east line sec. 20, T. 14 S., R. 15 W. |
415-500 | Apr. 1942 | 13 | 459 22.90 |
476 39.13 |
10,863 472.56 |
1,509 24.75 |
3,088 64.23 |
15,780 445.0 |
.6 .03 |
36 .58 |
31,470 | 3,102 | 1,238 | 1,864 |
| 6 | SE sec. 14, T. 14 S., R. 15 W. |
234-272 | Apr. 1942 | 256 | 999 49.85 |
256 21.04 |
3,769 163.96 |
296 4.85 |
506 10.52 |
7,775 219.26 |
1.6 .08 |
8.8 .14 |
13,464 | 3,544 | 242 | 3,302 |
| 6 | SE sec. 14, T. 14 S., R. 15 W. |
417-500 | Apr. 1942 | 9.0 | 765 38.17 |
488 40.11 |
10,724 466.51 |
888 14.56 |
2,787 57.97 |
16,720 471.50 |
.9 .05 |
44 .71 |
31,982 | 3,914 | 728 | 3,186 |
| 7 | SE sec. 13, T. 14 S., R. 15 W. |
267-320 | May 1942 | 2.2 | 733 36.58 |
295 24.25 |
5,337 232.15 |
416 6.82 |
1,165 24.23 |
9,275 261.56 |
1.1 .06 |
19 .31 |
17,035 | 3,042 | 341 | 2,701 |
| 7 | SE sec. 13, T. 14 S., R. 15 W. |
407-520 | May 1942 | .33 | 1,101 54.94 |
354 29.10 |
6,280 273.18 |
305 5.00 |
1,103 22.94 |
11,660 328.81 |
.9 .05 |
26 .42 |
20,678 | 4,202 | 250 | 3,952 |
| 1. One part per million is equivalent to one pound of substance per million pounds of water or 8.33 pounds per million gallons of water. 2. An equivalent per million (e. p. m.) is a unit chemical equivalent weight of solute per million unit weights of solution. Concentration in equivalents per million is calculated by dividing concentration in parts per million by the chemical combining weight of the substance or ion. 3. Calculated. 4. Total alkalinity, 1,112 parts per million; excess alkalinity, 491 parts per million. 5. Total alkalinity, 350 parts per million; excess alkalinity, 107 parts per million. 6. Total alkalinity, 377 parts per million, excess alkalinity, 115 parts per million. |
||||||||||||||||
Chemical Constituents in Relation to Use
The following discussion of the chemical constituents of ground water has been adapted from publications of the United States Geological Survey and the State Geological Survey of Kansas.
Total dissolved solids--The residue left after a natural water has evaporated consists of rock materials, with which may be. included. some organic material and a small amount of water of crystallization. Water containing less than 500 parts per million of dissolved solids generally is entirely satisfactory for domestic use, except for difficulties resulting from its hardness, and, in some areas, because of excessive iron corrosiveness. Water having more than 1,000 parts per million is likely to contain enough of certain constituents to produce a noticeable taste or to make the water unsuitable in some other respects.
The total dissolved solids in samples of water collected from private wells in this area fanged from 291 to 5,535 parts per million. The samples from six wells contained less than 500 parts per million, indicating waters suitable for most ordinary purposes. Nearly one-half of the samples contained between 500 and 1,000 parts per million, and the samples from 15 wells contained more than 1,000 parts per million.
Hardness--The hardness of water, which is the property that generally receives the most attention, is most commonly recognized by its effect when soap is used with the water in washing. Calcium and magnesium cause almost all the hardness of ordinary water. These constituents are also the active agents in the formation of the greater part of all the scale formed in steam boilers and in other vessels in which water is heated or evaporated.
In addition to the total hardness, the table of analyses indicates the carbonate hardness and the noncarbonate hardness. The carbonate hardness is that due to the presence of calcium and magnesium bicarbonate. It is largely removed by boiling. In some reports this type of hardness has been called temporary hardness. The noncarbonate hardness is due to the presence of sulphates or chlorides of calcium and magnesium, but it cannot be removed by boiling and has sometimes been called permanent. hardness. With reference to use with soaps, there is no difference between the carbonate and noncarbonate hardness. In general, the noncarbonate hardness forms harder scale in steam boilers.
Water having a hardness less than 50 parts per million is generally rated as soft, and its treatment for removal of hardness under ordinary circumstances is not necessary. Hardness between 50 and 150 parts per million does not seriously interfere with the use of water for most purposes, but it does slightly increase the consumption of soap; its removal by a softening process is profitable for laundries or other industries using large quantities of soap. Water in the upper part of this range of hardness will cause considerable scale in steam boilers. Hardness exceeding 150 parts per million can be noticed by anyone; if the hardness is 200 or 300 parts per million it is common practice to soften water for household use or to install a cistern to collect soft rainwater. Where municipal water supplies are softened, an attempt is generally made to reduce the hardness to 60 or 80 parts per million. The additional improvement from further softening of a whole public supply is not deemed worth the increase in cost.
The hardness of samples of water collected from private wells in this area ranged from 142 to 1,820 parts per million. The softest water analyzed was from well 129 in a sandstone of the Dakota formation, and the hardest water was obtained from well 31 in Tertiary deposits. Four of the samples analyzed had a hardness between 100 and 200 parts per million, 5 had a hardness between 200 and 300 parts, 8 had a hardness between 300 and 400 parts, 15 had a hardness between 400 and 1,000 parts, and 4 had a hardness of more than 1,000 parts.
Iron--Next to hardness, iron is the constituent of natural waters that receives the most attention. The quantity of iron in ground waters may differ greatly from place to place, even though the waters are from the same formation. If a water contains much more than 0.1 part per million iron, the excess may separate out and settle as a reddish sediment. Iron, which may be present in sufficient quantity to give a disagreeable taste and to stain cooking utensils, may be removed from most waters by simple aeration and filtration, but a few waters require the addition of lime or some other substance.
All of the samples of water from private wells in this area contained more than 0.1 part per million of iron, but four samples collected from test holes contained 0.1 part per million or less. Seventeen samples contained between 1 and 10 parts per million of iron and five samples (wells 62, 68, 85, 92, and 177) contained more than 10 parts per million.
Fluoride--Although determinable quantities of fluoride are not as common as fairly large quantities of other constituents of natural waters, it is desirable to know the amount of fluoride present in water that is likely to be used by children. Fluoride in water has been shown to be associated with the dental defect known as mottled enamel, which may appear on the teeth of children who drink water containing excessive quantities of fluoride during the period of formation of the permanent teeth. It has been stated that waters containing 1 part per million or more of fluoride are likely to produce mottled enamel, although the effect of 1 part per million is not usually very serious (Dean, 1936). If the water contains as much as 4 parts per million of fluoride, 90 percent of the children exposed are likely to have mottled enamel and 35 percent or more of the cases will be classed as moderate or worse.
No samples of water collected in Ellis County contained as much as 1 part per million of fluoride, and only six of the samples collected in Russell County contained more than 1 part per million. The maximum fluoride content, 5 parts per million, was in a sample of water from well 129.
Relation to Stratigraphy
The typical quality of water in the six principal water-bearing formations of this area is shown in figures 8 and 9, and is discussed below.
Figure 8--Analyses of typical waters from five of the six principal water-bearing formations in Ellis and Russell counties.
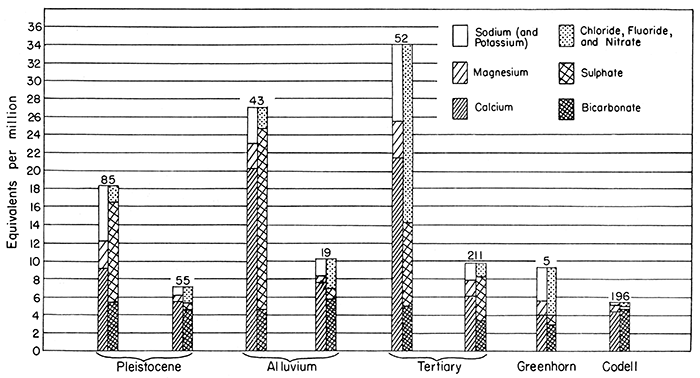
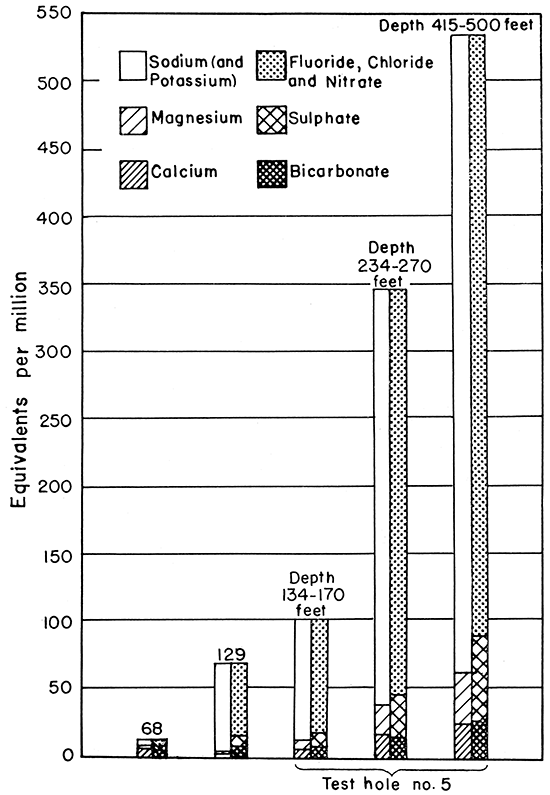
Figure 9--Analyses of typical waters from sandstones of the Dakota formation in Russell County.
Cheyenne sandstone--Water from the Cheyenne sandstone is not utilized in this area for domestic or stock supplies, but analyses of water obtained during the drilling of disposal wells indicate that the water in the Cheyenne sandstone is highly mineralized.
Dakota formation--Water from wells in the various sandstones of the Dakota formation have a wide range in chemical composition; some are only moderately hard whereas others are highly mineralized. A sample of water from well 129 in a sandstone of the Dakota formation was the softest water of any of the 36 samples analyzed, having a hardness of only 142 parts per million, whereas a sample of water collected from a sandstone in the lower part of the Dakota formation penetrated in test hole 7 had a hardness of 4,202 parts per million. The fluoride content of about half the samples of Dakota waters was greater than 1 part per million, and the water from well 129 had the highest fluoride content of any sample analyzed-5.0 parts per million. The chloride is both the most variable and most objectionable constituent of many Dakota waters. A sample of water from well 62 had the lowest chloride content of any Dakota waters analyzed-23 parts per million. A sample obtained from test hole 2 at a depth of 485 to 533 feet had the highest chloride content of any Dakota waters analyzed-22,875 parts per million. The iron content of Dakota waters analyzed ranged from 0.07 part per million in test hole 4 to 256 parts per million in test hole 6.
Greenhorn limestone--A few wells on the uplands in Russell County obtain water from the near-surface fractured parts of the Greenhorn limestone. Only three samples of water from the Greenhorn limestone were analyzed (wells 5, 61, 92); they ranged in total solids from 439 to 4,112 parts per million, and in hardness from 280 to 1,662 parts per million.
Codell sandstone member of the Carlile shale--The Codell sandstone member yields small quantities of water to wells in north-central Ellis County. Only two samples of water from the Codell sandstone member were analyzed (wells 177, 196) and they contained respectively 1,008 and 291 parts per million of total dissolved solids and 431 and 262 parts per million of hardness.
Tertiary deposits--Sand and gravel of Tertiary age yield water to wells on the upland areas, particularly in west-central Russell County and east-central Ellis County. Five samples of water from the Tertiary were analyzed and their quality was found to range within wide limits. The total solids ranged from 332 to 2,710 parts per million, and the hardness ranged from 250 to 1,820 parts per million.
Pleistocene deposits--Many stock and domestic wells obtain water from sands and gravels of Pleistocene age which occur as terrace deposits along the valleys of Smoky Hill and Saline rivers and Big creek. Ten samples of water from Pleistocene deposits were analyzed and were found to be generally of better quality than waters obtained from most of the other water-bearing materials.
The hardness of water obtained from Pleistocene deposits ranged from 309 to 734 parts per million, and the total dissolved solids ranged from 404 to 1,252 parts per million. Only one sample (85) contained more than 1 part per million of fluoride. The chloride ranged from 26 (well 58) to 260 parts per million (well 80).
Alluvium--Wells obtain water from the alluvial deposits along the major valleys and also along minor tributary valleys. In many places water migrates from adjacent Tertiary and Cretaceous deposits into the alluvium, so water of different quality may be obtained from the alluvium in different valleys. These conditions give rise to considerable variation in the chemical character of waters obtained from the alluvium.
The hardness of samples of water from wells in the alluvium ranged from 340 to 1,147 parts per million, and the total dissolved solids ranged from 458 to 1,728 parts per million. In all the samples analyzed the fluoride was less than 1 part per million and the chloride was less than 100 parts per million.
Prev Page--Water-bearing Materials || Next Page--Disposal
Kansas Geological Survey, Geology
Placed on web Jan. 26, 2017; originally published December 1944.
Comments to webadmin@kgs.ku.edu
The URL for this page is http://www.kgs.ku.edu/Publications/Bulletins/50/07_gw.html