Previous--Coats South Area, Barber County || Next--Hampton Field (Arbuckle Group), Rush County
Consultant
This article available as an Acrobat PDF file (7 Mb).
For the past five or six decades, the Forest City basin has been subject to sporadic exploration activity. Prior to the advent of multifold seismic data acquisition, many significant fields (e.g., Davis Ranch in Wabaunsee County) were discovered by integrating subsurface well control with shallow core-hole data. In some cases (Strahm field, Nemaha County), spot correlation seismic data were utilized in conjunction with shallow surface/outcrop structure mapping.
At Strahm South field, east-central Nemaha County, Kansas, an initial subsurface lead was investigated by acquiring 6.25 mi (10.0 km) of nominal 12-fold CDP data in early 1984. This initial survey resulted in a discovery and was augmented by the phased acquisition of 11.4 mi (18.25 km) of "development" data. Pre-drilling seismic mapping indicated significant thinning over a key Lansing-Viola interval; this feature generally indicates deep subsurface structure, particularly at the Ordovician. The survey data also indicated critical west dip of more than 100 ft (30 m) at the top of the Viola and probable closure.
Drilling has confirmed this 100 ft (30 m) of dip and that the Strahm South field is an elongated, faulted, and closed feature. It is slightly over 1 mi (1.6 km) long, with a productive width apparently less than 1,300 ft (390 m). Estimated ultimate recovery from six Viola wells will likely exceed 275,000 bbls. Untested Hunton and Simpson pay remains behind pipe.
Although other geophysical and geochemical techniques can be of assistance prior to drilling untested structures in this area, multifold seismic results are especially encouraging. Both lateral and vertical resolution, particularly with modem recording geometries and processing, confirm good agreement with actual subsurface data. When measured against the cost of a typical dry hole in the area, the CDP surveys are also very cost effective if designed with appropriate constraint.
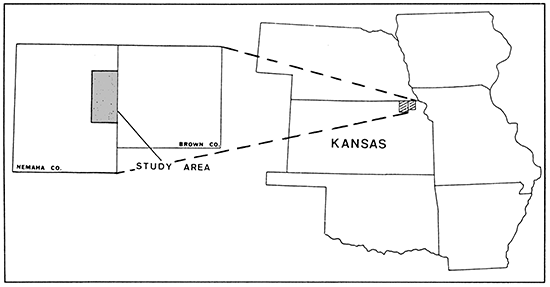
Strahm South field is located in east-central Nemaha County, Kansas, slightly updip and west of the axis of the Forest City basin (figs. 1 and 2). The Forest City basin is asymmetric in that the western flank in proximity to the Nemaha Ridge is steeply dipping and faulted; elsewhere the basin is characterized by relatively gentle dips. The principal zones with production potential are the Silurian/Devonian-aged Hunton carbonates, Ordovician-aged Viola carbonates, and Simpson sandstones. Most, but not all, of the fields in the region are associated with faulting, generally of basement origin. Steeples (1982) illustrates the influence of the Humboldt fault zone throughout the flank of the Nemaha Ridge.
Figure 1--Forest City basin and regional tectonic features (after Cohee et al., 1962).
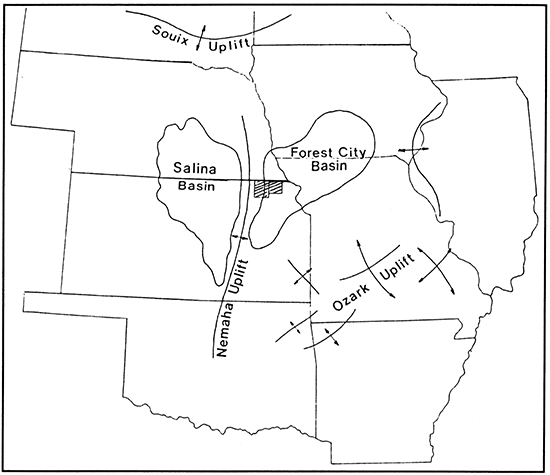
Figure 2--Study area index map.
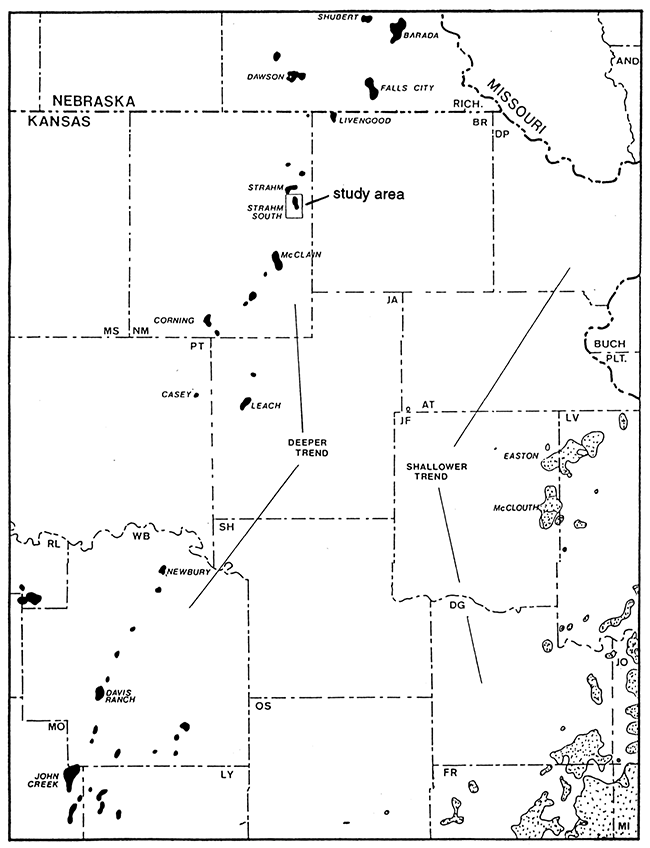
Some structures in the Forest City basin are of substantial areal extent. Davis Ranch (over 8 million bbls) has about 400 productive acres (16 hm2), while John Creek (also over 8 million bbls) covers more than 1,400 acres (567 hm2). Many smaller fields have also yielded fairly high reserves per unit area. Examples would be Mill Creek and Woodbury, each with less than 100 acres (40 hm2) (fig. 3). Most structures with relief high enough to be picked up by shallow core drilling have been exploited long ago, though the technique still has merit on a smaller scale. The seismic method (spot correlation) is credited for the discovery of Strahm field (Elster, 1960). McClain field (1982) is the first discovery in the "new phase" to have shown the validity of CDP techniques in the area.
Figure 3--Regional production trends.
With respect to Strahm South field, nominal 12- and 24-fold data were acquired with 110-ft (34-m) groups, 220-ft (67-m) shots (Vibroseis), with 48- and 96-channel recording. (See also Appendix 1 for additional detail concerning acquisition and processing parameters.) The resolution provided by these surveys enabled the identification of faulting, the confirmation of structural dip and stratigraphic thinning, and generally limited the risk associated with exploration and exploitation of structures of limited areal extent.
The location of these initial surveys was based on regional mapping of numerous horizons and isopachs thought to be critical for entrapment and structural closure. This mapping allowed us to highlight an area downdip, but apparently on trend with Strahm field, a Hunton and Viola field discovered in 1948 by Carter Oil (Elster, 1960).
Regional geological mapping indicated anomalous conditions at a well which had weak but potentially significant shows from Hunton porosity: the Skelly-Hook #1, located NW SW SW sec. 11, T. 3 S., R. 14 E. Acquisition of approximately 6.25 line-mi of CDP data tied this well directly, and with velocity reference established at this point, allowed for an estimate of possible structural gain against the Ryan-Aberle #1, located in SW NW NW sec. 3, T. 3. S., R. 14 E.
Viola Time Structure and Lansing-Viola Isochron maps as drafted in 1984 are shown in figs. 5 and 6, respectively. These interpretations led to the drilling of the Teichgraeber-Brown Lierz "A" #1, SW SW SE sec. 3, T. 3 S., R. 14 E. The well encountered difficulties during an attempt to drill stem test (DST) the Viola. However, sample shows in the Viola and Simpson, coupled with significant structural gain relative to the Skelly-Hook #1, and thinning against all nearby wells warranted a production attempt. (The Lansing-Viola interval of 2,307 ft [703 m] encountered at the Lierz "A" #1 is the thinnest in all wells in the field area.) Upon completion, significantly oil-cut water was recovered from the Viola.
Figure 4--1984 CDP surveys with well control.
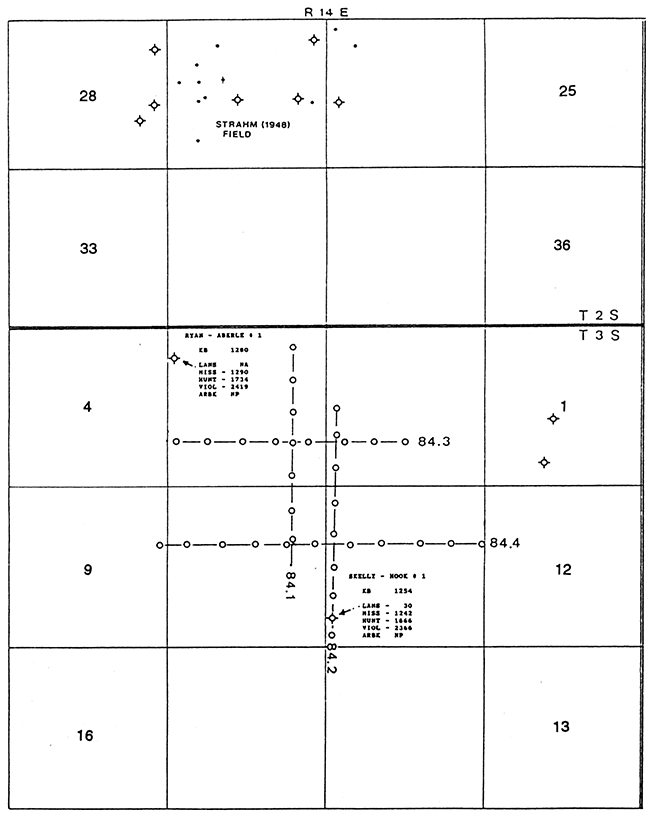
Figure 5--Viola time structure, 1984 interpretation; contour interval = 0.004 sec.
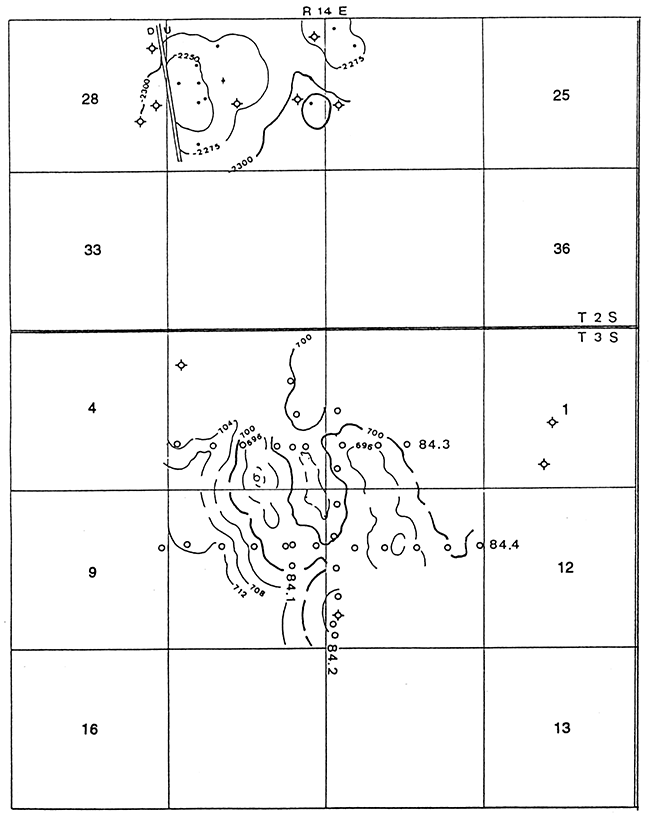
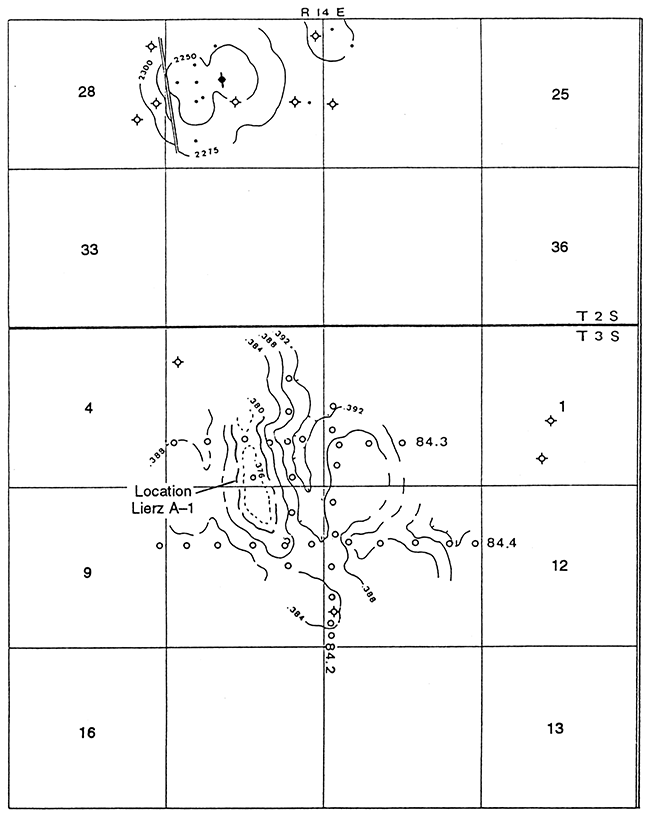
Figure 6--Lansing-Viola isochron/isopach, 1984 interpretation; contour interval = 0.004 sec.
Subsequent to the drilling of the Lierz "A" #1, further analysis of the data indicated that it would be possible to gain structural advantage by moving north/northwest approximately 1/4 mi (1/2 km) from the Lierz "A" #1. At this new location, the Lierz "A" #2 encountered a 7-ft (2-m) structural gain, with Viola pay developed in a fractured and, in places, vuggy dolomite from about 3,555 ft to 3,565 ft (1,084 m to 1,087 m). Simpson sandstone at 3,775-3,780 ft (1,151-1,152 m) yielded a good show of free oil on DST but is much tighter than the Viola.
A core taken through the Viola pay zone registered porosity as high as 21% and permeability as high as 2,250 millidarcies. Average porosity was 16.2%, while average permeability was 523 millidarcies. DST chart extrapolation and calculations for the Viola indicated theoretical potential, with damage removed, of 985 BOPD. Extrapolated reservoir pressure was 1,334 psi.
Following this discovery, additional CDP surveys were conducted to assist both in development and the evaluation of extension exploratory ideas. This second phase (1985) is indicated on fig. 7. Results from these surveys led to the drilling of three additional successful wells and one dry hole.
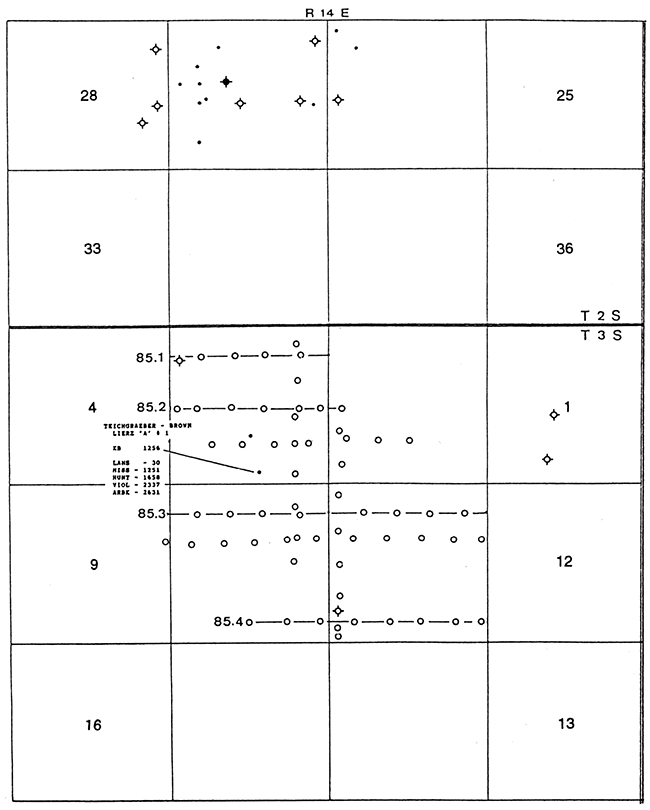
Figure 7--Phase II CDP surveys, 1985.
A final phase of surveys was conducted in 1986 (fig. 8), bringing total survey mileage to 17.65 mi (28 km). Maps depicting the latest interpretation show Lansing-Viola Isochron (fig. 9) and Viola Structure (fig. 10). While the Viola Time Structure map (not shown) matches reasonably well with actual structure, the more diagnostic map is that of the Lansing-Viola isochron. Time-structure mapping is complicated by locally anomalous velocities in variable glacial till cover. Modern processing with refraction statics mitigates some of this distortion; however, better agreement between time and structure remains a significant processing challenge. Note that faulting is depicted as en echelon. Additionally, the east limb of the structure is likely faulted in the vicinity of the highest wells in the field. This portion of the structure would then be interpreted as a horst. This is a very reasonable interpretation and in agreement with Steeples (1982), wherein other similar features have been identified in the fairway of the "Humboldt fault zone."
Figure 8--Phase III CDP surveys, 1986.
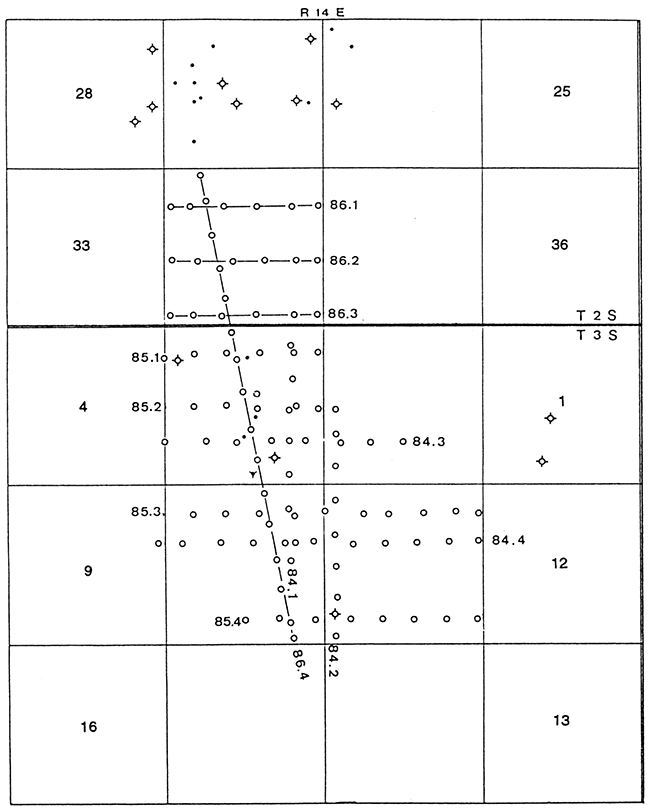
Figure 9--Final interpretation, Lansing-Viola isochron; contour interval = 0.004 sec.
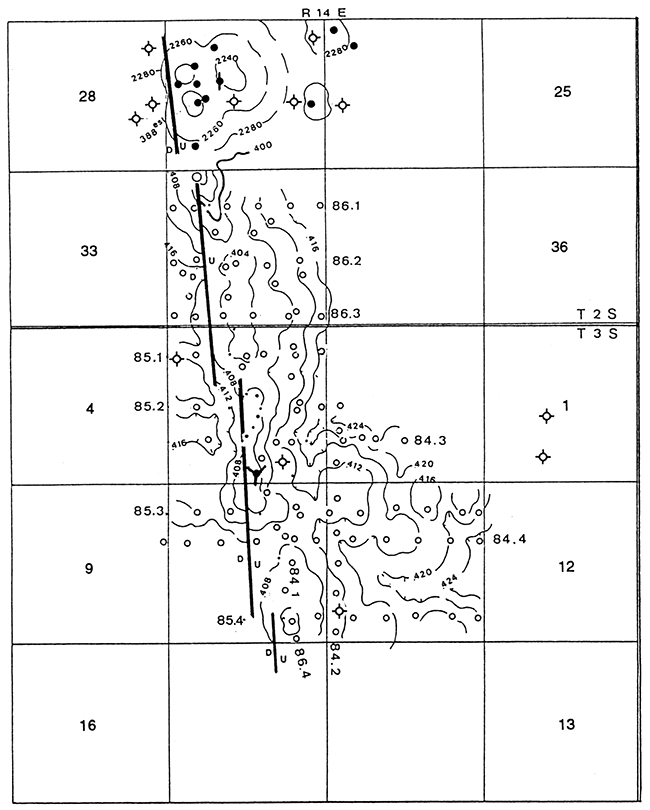
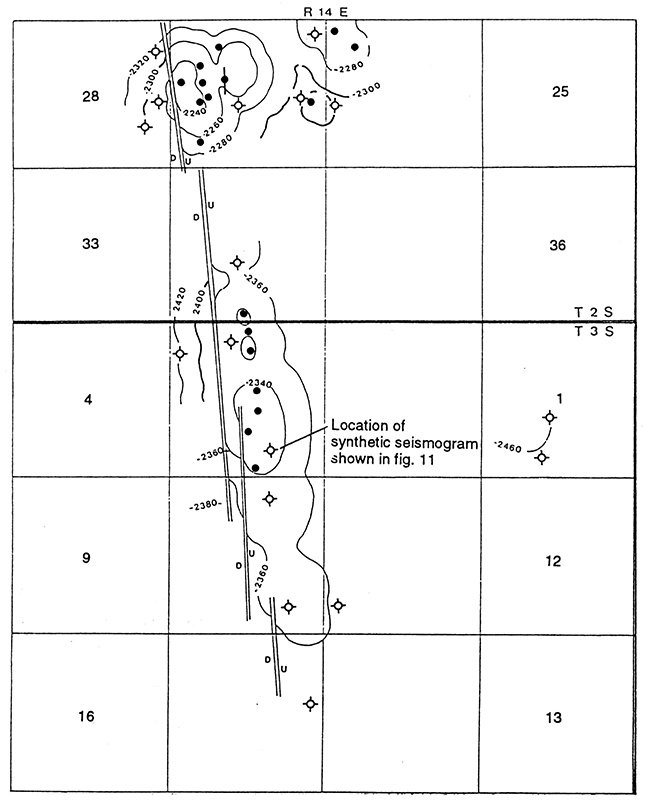
Figure 10--Final interpretation, Viola structure; contour interval = 20 ft (6 m).
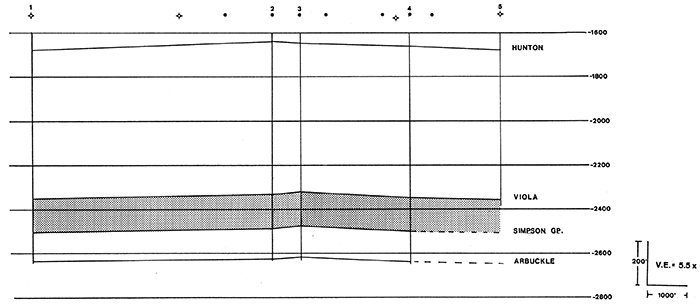
Example seismic sections, which indicate both relative structure (dip line 84-3) and stratigraphic variation (strike line 86-4), are shown in figs. 12 and 13, respectively. These are structure-normal polarity sections; key reflections are annotated. Obvious structure below the indicated producing well on profile 84-3 confirms a good portion of the 80 ft (24 m) of relief known to exist between the Lierz #2 and the Ryan-Aberle #1 in NW sec. 3.
Figure 11--CDP profile 84-3; structure, normal polarity. Nominal 12-fold Vibroseis; 110-ft (34-m) group interval, 20-ft (6-m) source interval.
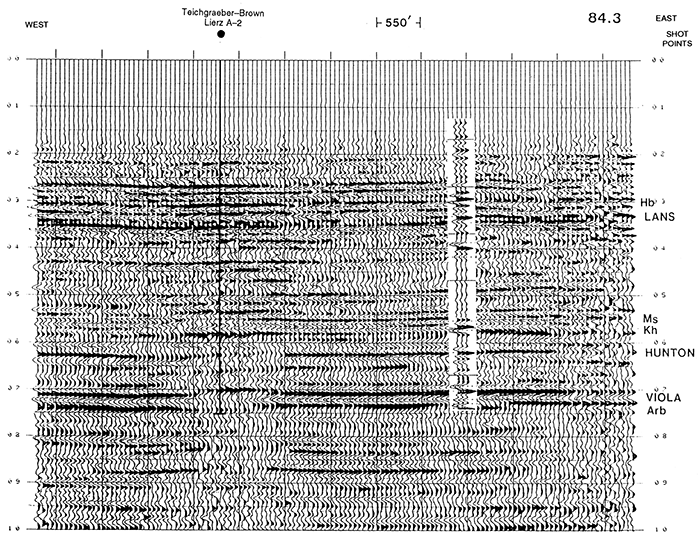
Figure 12--CDP profile 86-4 (strike line); structure, normal polarity. Numbers above wells refer to structural profile fig. 13.
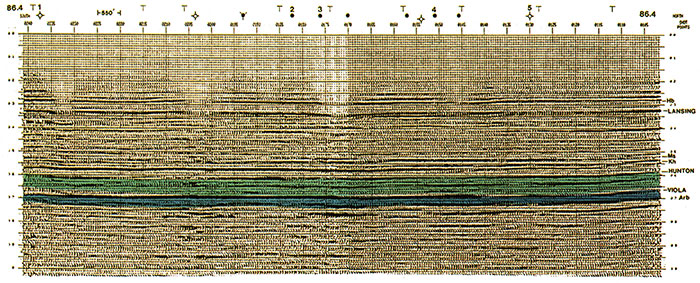
Figure 13--Structural profile from log data. Compare with CDP profile 86-4, fig. 12.
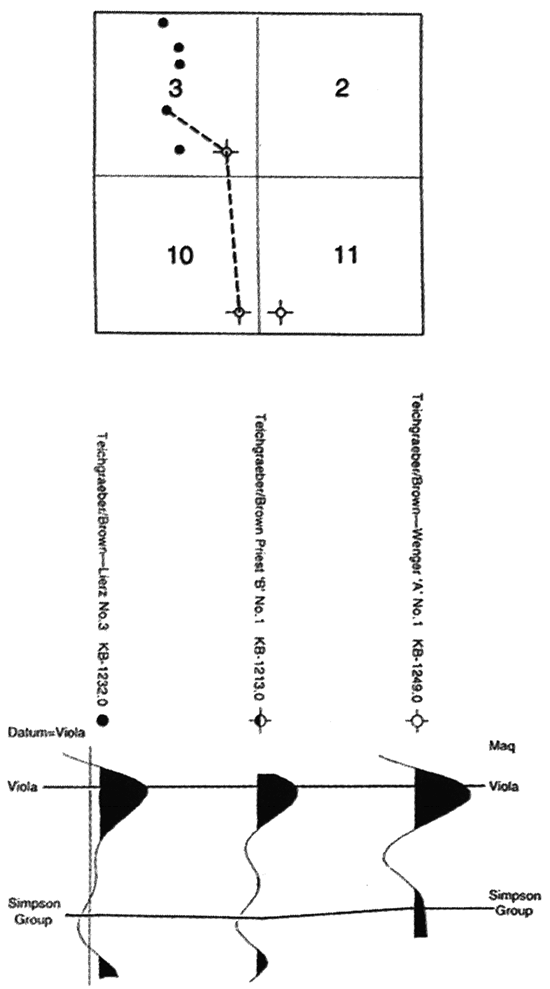
While the good correlation to structure on dip lines is encouraging, one of the pitfalls of evaluating data in this area is illustrated by the strike-line interpretation. Compare fig. 14, based on a log cross section through many of the field wells, to profile 86-4 (fig. 12). Of special interest is the relationship of dry holes situated at positions 1 and 5 with respect to profile 86-4. It is possible that the time-structural relief at these locations may be partially an artifact of low-velocity surficial glacial drift deposits. Lateral variations in the thickness and velocity of these deposits can create false pullup, incorrectly suggesting higher structural position. These locations are in higher elevation positions and have more near-surface glacial material preserved.
Seismic correlation has been enhanced by the generation of numerous synthetic seismograms from field wells. The sample seismogram shown in fig. 14 was generated from sonic and density control from near-surface to granite basement at the dry hole located NE SW SE sec. 3, T. 3 S., R. 14 E. (Teichgraeber-Brown Priest "B" #1). In addition, a comparison of the synthetic seismic response between productive and nonproductive wells has been generated (fig. 15). In this profile, the integrated acoustic-impedance curve has been convolved with the same wavelet used in fig. 14; however, the interval has been limited to highlight the synthetic seismic response of the Viola. Note that the display is in depth rather than time. Datum for the display is the top Viola. These responses are very informative in what is indicated immediately below the top Viola. Note that in the productive well (Lierz #3), the amplitude response below the typical top Viola "peak" is very weak. The same zone in the transitional well (Priest "B" #1), which tested shows in Viola porosity, begins to develop a slight kick just above the top Simpson Group marker; the clear-cut dry hole (Wenger "A" #1) shows a strong trough developed followed by a well-developed peak at the top Simpson.
Figure 14--Synthetic seismogram, Teichgraeber-Brown Priest "B" #1. Convolved with filter of 10-20/75-95 Hz, zero phase.
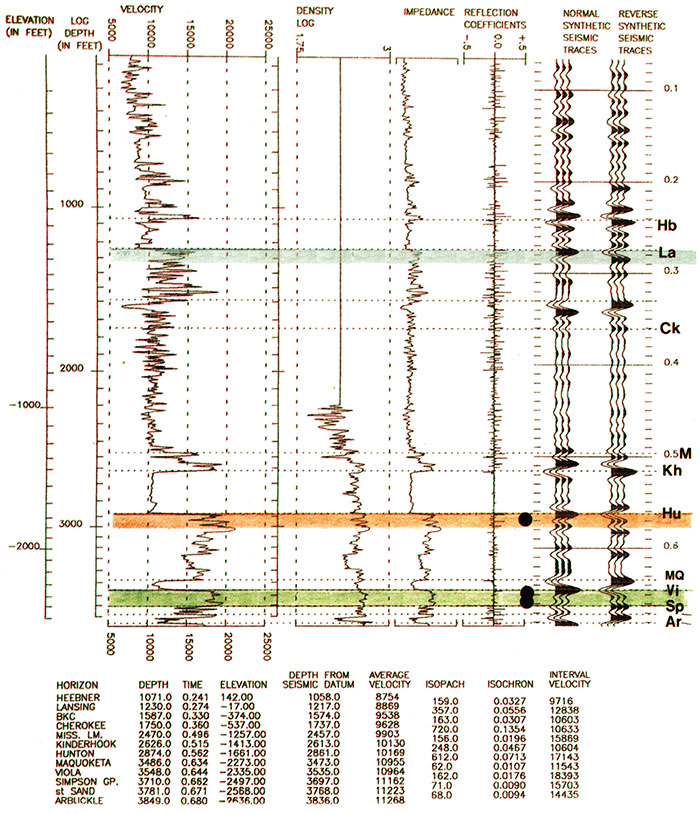
Figure 15--Synthetic seismic profile illustrating contrast between reservoir/nonreservoir rock and fluid material.
The validity of this theoretical response is substantiated by the signature of the Viola pay zone of fig. 11. As indicated earlier, this profile is a true dip profile and as such provides the better match to modeling. Nonetheless, the response of Viola porosity in fig. 12 also shows interesting correlations to the model response. In summary of this point, it is probable that significant porosity and oil saturation in this zone has yielded a seismic response characteristically different frrom nonproductive cases.
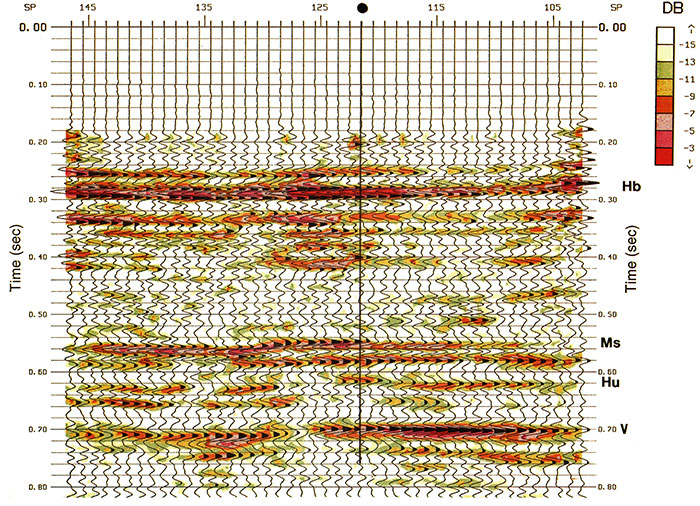
Additional data related to complex trace attributes, such as instantaneous phase and frequency, were utilized to assist in fault-zone definition and to attempt resolution of stratigraphic details. Reflection strength (decibels) further verified the theoretical relationship indicated above (fig. 16).
Figure 16--Complex trace attribute of reflection strength.
While not a major accumulation (estimated ultimate recovery about 300,000 bbls), Strahm South has certainly proved commercial. It also confirms some of the relative complications related to exploration in this region. Among others, these include 1) the high probability of faulting associated with production; 2) relatively high relief, but narrow/small structures; and 3) surface overburden characteristically with glacial drift. Nonetheless, compelling reservoirs await further testing of ideas and technologies.
Though some might suggest that line spacings in this program represented "overkill," the fact is that these structures can and do change dramatically in any given direction. Future data-gathering alternatives including parallel offset (swath) surveys, or appropriately spaced 3D surveys, should yield highly accurate results in a framework utilizing scrutinized cost control.
The author expresses sincere appreciation to R. K. Teichgraeber and W. Terrence Brown for permission to publish this paper.
Cohee, G. V., et al., 1962, Tectonic map of the United States: U.S. Geological Survey and American Association of Petroleum Geologists
Elster, T., 1960, Strahm field; in, Kansas Oil and Gas Fields, vol. III, Northeastern Kansas: Kansas Geological Society, p. 125-129
Steeples, D. W., 1982, Structure of the Salina-Forest City interbasin boundary from seismic studies: University of Missouri Rolla (UMR), Journal, no. 3, December, p. 55-81
Previous--Coats South Area, Barber County || Next--Hampton Field (Arbuckle Group), Rush County
Kansas Geological Survey
Comments to webadmin@kgs.ku.edu
Web version placed online Dec. 28, 2015. Original publication date 1995.
URL=http://www.kgs.ku.edu/Publications/Bulletins/237/Hedke2/index.html