Previous--Stockholm SW Field, Greeley/Wallace Counties || Next--Strahm South Field, Forest City Basin
1Consultant, 2Woolsey Petroleum Corporation, and 3Pickrell Drilling Co., Inc.
This article available as an Acrobat PDF file (6 Mb).
The Coats South area is situated in north-central Barber County, Kansas, immediately east of the southern limit of the Pratt anticline. The geologic setting encompasses a variety of structural and stratigraphic traps. The case study discussed herein involves exploration targets in Mississippian- and Ordovician-aged carbonates and cherts. The trap for either target zone is stratigraphic. Recently (1991) acquired multifold Vibroseis data have been examined in an effort to characterize the reservoirs and the relatively complex structure and stratigraphy proximal to the Pratt anticline.
Significant topographic variation, highly variable materials in the weathered zone, and local areas of high data attenuation within the study area present special data-processing difficulties. These difficulties can be overcome by careful integration of known geologic constraints and iterative static solutions.
Seismic models of those geologic conditions relevant to hydrocarbon traps in the study area correlate well with processed seismic sections. The data utilized in this study are of sufficiently high frequency content that stratigraphic pinchouts and other thin-bed phenomena are clearly distinguishable on both conventional and enhanced trace-attribute plots. As a general rule, structure plays a minor role in the stratigraphic traps evaluated in this study.
Figure 1--Regional location index, study area proximity to Pratt anticline, and regional geological features.
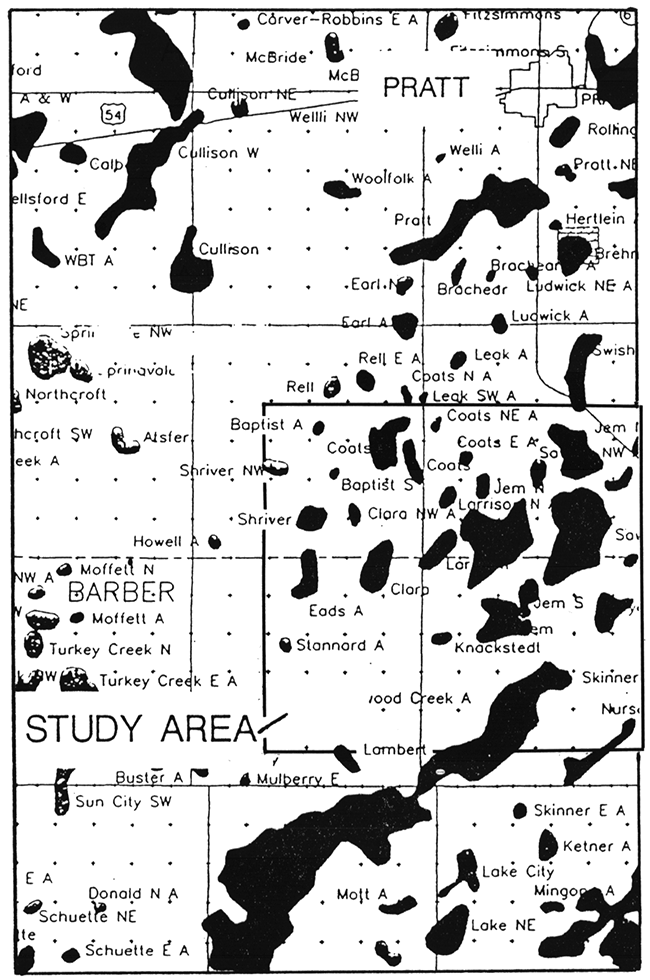
Figure 2--Production index map of portions of T. 29 and 30 S. and R. 13 and 14 W., Pratt and Barber counties, Kansas.
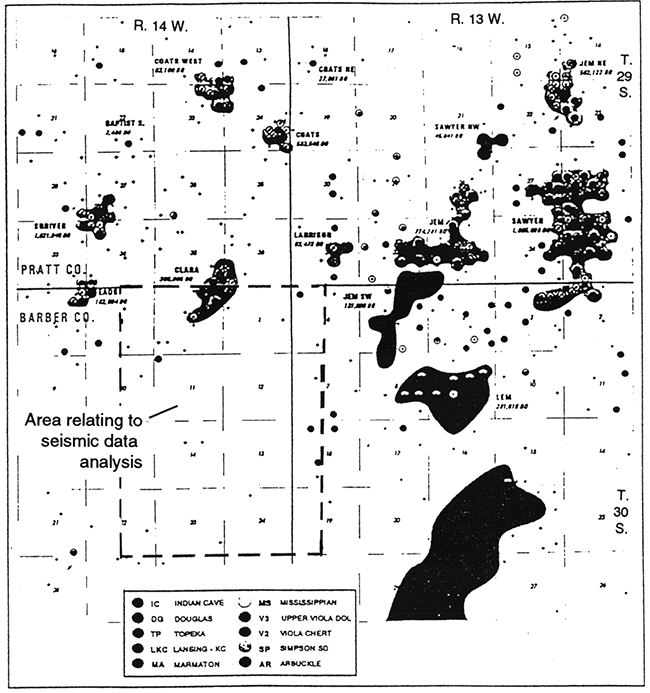
Production in the study area is controlled by structural, stratigraphic, and combination traps. Log cross sections and contour maps presented below demonstrate a variety of these controls. The purely stratigraphic traps are considerably more difficult to identify/predict in advance of drilling. Geologic indicators of such traps typically lack the level of detail necessary to yield either two-dimensional or three-dimensional control. Multifold seismic control, however, is capable of imaging these exploration targets and providing insight into reservoir development and reservoir quality definition.
Recent acquisition (1991) of detailed seismic coverage both perpendicular and parallel to the Pratt anticline has allowed for detailed reservoir-zone analysis and realistic structure mapping from an area of significant near-surface velocity contrast and gentle to moderate terrain. Some of these results are presented in this paper. Due to the proprietary nature of the data, specific profile location will be withheld in order to preserve confidentiality.
Portions of four townships comprising the Coats South study area (fig. 2) include some rather striking geological anomalies. Faulting on the east limb of the Pratt anticline, coupled with substantial stratigraphic zone variations present challenging interpretive problems, both from a modeling standpoint as well as subsurface correlation to seismic data.
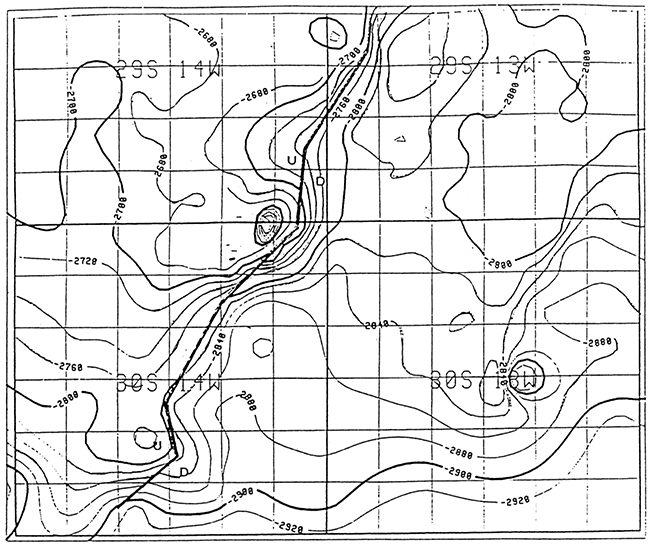
An example of the abrupt subsurface structural change is indicated by contours on top of the Arbuckle (fig. 3). Note that the fault zone along the east limb of the Pratt anticline is offset laterally at numerous junctions. These offsets are indicated to be conjugate fracture zones related to the primary fracture set which tends locally to be more north-south in orientation. Note also that numerous structural closures, both on upthrown and down thrown blocks have yielded significant oil and gas accumulations (e.g., Coats field).
Figure 3--Structural configuration, top Arbuckle. Note vertical offset east of fault zone is approximately 150 ft (45 m).
Significant reservoirs occur in primarily two key intervals in the study area: Mississippian and Ordovician Viola cherty porosity. The geologic histories of these buildups is not completely understood. Clearly, however, some zones have developed secondary porosity. Complicated fluid migration and hydrodynamic or possible gas drives also play roles in final trap configurations and integrity. An indication of stratigraphic diversity over an interval encompassing Mississippian and Kinderhook sediments is evident in an isopach map of Marmaton-Viola (fig. 4). Similar maps (not shown here) can be generated to support exploratory development efforts for Viola targets. Log characteristics of stratigraphy from the Marmaton through the Arbuckle is shown on cross section B-B' (fig. 5). This structural profile gives an idea of the level of complexity under consideration for seismic modeling. Vertical as well as lateral variation can be pronounced.
Figure 4--A) Isopach map of Marmaton-Viola. This interval emphasizes particularly the variation of Mississippian-aged sediment thickness. B) Perspective diagram of Ordovician surface at close of Marmaton time.
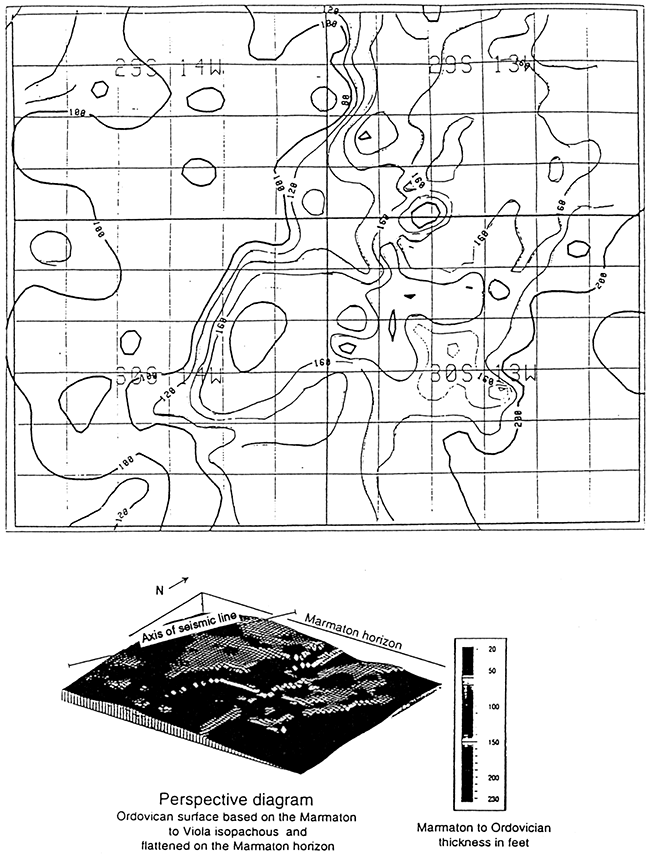
Figure 5--Structural cross section B-B'. Note variation of Mississippian-aged sediments as well as those of Ordovician Viola.
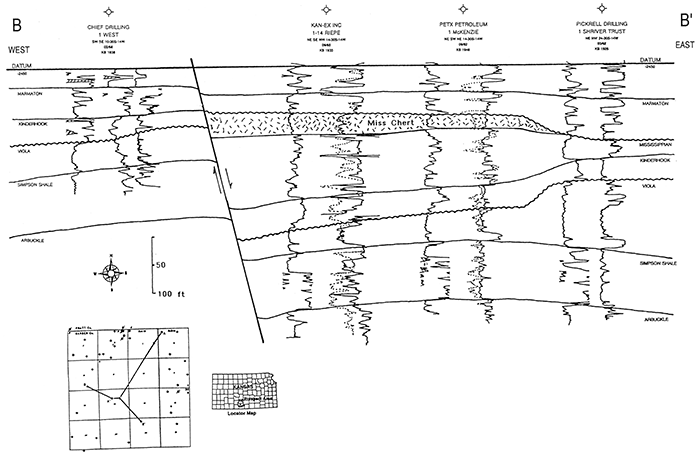
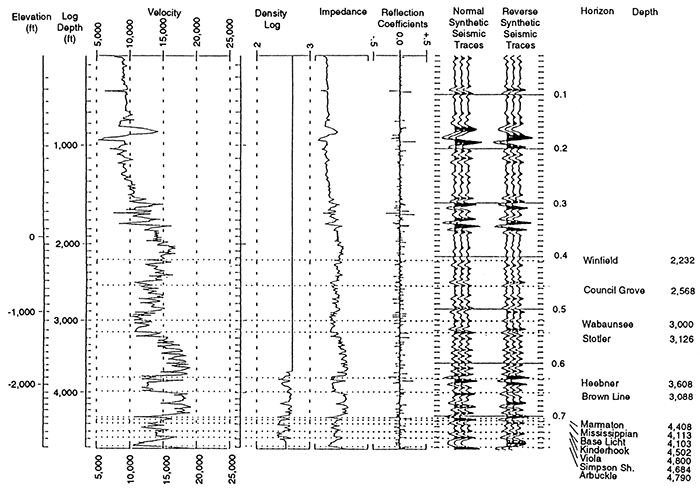
Due to the structural and stratigraphic variation indicated by mapping and log cross sections, accurate seismic correlation is an essential ingredient to overall seismic-profile definition. Synthetic seismic signatures in one- and two-dimensions (1D and 2D) have been generated in support of the cases analyzed in this study. For 1D vertical control, sonic and density logs have been utilized from a well located at approximately NW NW NE sec. 14, T. 30 S., R. 14 W., to generate a synthetic seismogram (fig. 6). This downthrown-block well provides excellent detail of a particularly well developed Mississippian porosity zone; Viola and Simpson sections are also fairly developed in this well. At the time of this writing, this well was awaiting hookup to a natural gas pipeline, with the expectation of production from Mississippian chert. Other details are not available. Many upthrown-block wells have zero Mississippian section, though they may contain restricted Kinderhook and fully developed Ordovician sections.
Figure 6--One-dimensional (1D) synthetic seismogram generated from Woolsey Petroleum Corporation-McKenzie #1, NW NW NE sec. 14, T. 30 S., T. 14 W, Barber County, Kansas. Bandpass filter = 15-20/90-105. Vertical scale = 10 IPS. Winfield through Arbuckle annotated.
A 2D synthetic seismic profile has also been generated utilizing the above well as a basis. This model is presented below where actual data can be viewed for direct comparison (see figs. 9 and 10).
Seismic data from the study area demonstrate the significant structural and stratigraphic variation indicated by log profiles presented earlier in this paper. The seismic profile chosen for display is oriented more or less perpendicular to the fault zone prevalent along the east limb of the Pratt anticline. Although the exact seismic profile location is proprietary, the well location shown near the center of the cross section is in close proximity to the profile; this is the well utilized in the synthetic modeling of the previous section.
Figure 7 is an unannotated "conventional" structural profile, covering the full stratigraphic section from surface to basement. Annotation for the profile (fig. 8) gives various formation boundaries and places the fault zone near station number 165. These profiles are displayed at a "typical" vertical scale of 10 inches per second (10 IPS). Horizontal scale is 15 traces per inch (15 TPI). Group interval is 82.5 ft (24.8 m), equating to a horizontal distance of about 1,200 ft/inch (930 m/cm). Vertical depth at 700 milliseconds (msec) is approximately 4,300 ft (1,290 m). This yields a vertical exaggeration of approximately 2x at 700 msec. Note that while the annotated profile shows "obvious" faulting, the unannotated profile may leave some room for interpretation. Also note that the total geological section over the Marmaton to Viola interval occurs over a relatively limited seismic interval. At a scale of 10 IPS, details related to these critical zones are barely visible.
Figure 7--Conventional structural profile. Horizontal scale = 15 TPI; vertical scale = 10 IPS., V.E. = 2x at 700 msec.
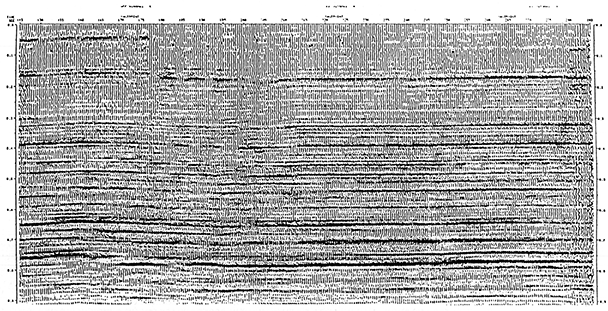
Figure 8--Annotated seismic profile. Note that Marmaton-Viola interval (approximately 20 msec) contains considerable stratigraphic variation, most of which is not visible on this conventional profile. See text for detailed discussion. [Note web image is somewhat smaller than scan depicted in published version.]
The 2D seismic model referred to above is presented in fig. 9. In this display, vertical scale is 20 IPS, horizontal scale is relative, trace spacing is 6 TPI. The model has been generated to highlight particularly the thickness changes in Mississippian chert and the overall Viola. In the center of the model, Mississippian chert thickness is 50 ft and total Viola section is 64 ft (19 m). On the upthrown block, or model left, Mississippian chert is absent and total Viola is 50 ft (15 m). On the right end of the model, Mississippian chert thickness is 30 ft (9 m), Viola thickness is 110 ft (33 m). Variable interpolation rates have been applied from left to right to match the rate of horizontal geological change. The model has been generated with 5% noise added.
Figure 9--2D Model emphasizing variation in Mississippian chert and Viola. Horizontal scale is relative, vertical scale 20 IPS. Heebner-Arbuckle interval isolated. See related seismic profile fig. 10.
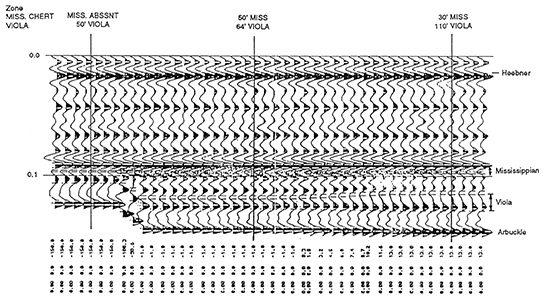
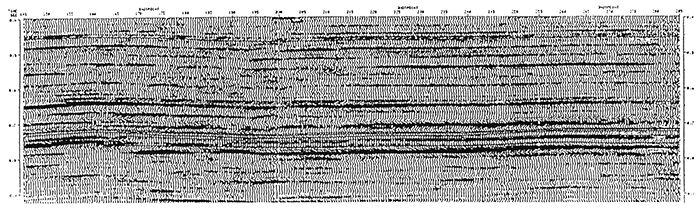
Figure 10--Same profile as figs. 7 and 8, redisplayed at 40 TPI and 20 IPS to match model of fig. 9. As compared to fig. 8, only every third trace is displayed. V.E. = 5.4x.
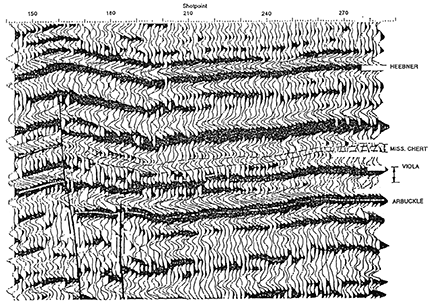
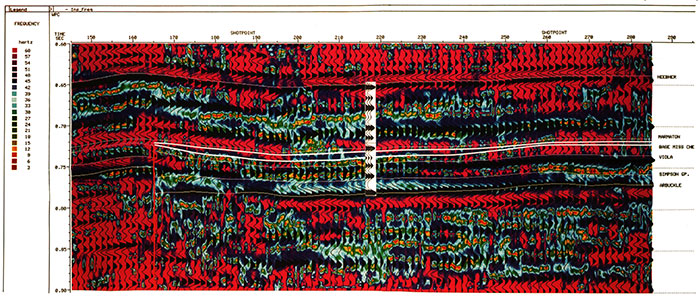
Figure 11--Instantaneous frequency redisplayed at 15 TPI and 30 IPS. V.E. = 6x. Note frequency anomalies in Mississippian chert and Viola intervals. See text for details. [Note web image is somewhat smaller than scan depicted in published version.]
For comparison to actual data, the same data set utilized in figs. 7 and 8 has been redisplayed at a vertical scale of 20 IPS and a trace spacing of 40 TPI, with every third trace shown to compare model to actual data (fig. 9). Vertical exaggeration in this profile is approximately 5.4x. In contrast to the model, actual data have not been flattened at Heebner time. Note that while agreement between model and data is not perfect, good overall agreement is very much in evidence. Among other points of interest:
The somewhat "choppy" appearance of the data is due to the third trace increment chosen in order to redisplay data at approximately the same relative horizontal scale as the model.
To provide an idea of overall data quality, an expanded scale profile of this same data set is shown in fig. 11. In this display, the trace attribute of instantaneous frequency displayed at a horizontal scale of 15 TPI (same as figs. 7 and 8) while vertical scale is 30 IPS, yielding a vertical exaggeration of approximately 6x. This profile shows very clearly both the structural and stratigraphic change occurring over the length of the profile. Structurally, the prominent Arbuckle event shows the full measure of displacement across the east-limb fault zone. Two-way time displacement is approximately 20 msec (0.020 sec); well control verifies structural-depth displacement at the top Arbuckle is greater than 150 ft (45 m). Although results are somewhat premature, an apparently productive zone in Mississippian chert has been encountered at the equivalent of station 210 in this profile. Note that a significant frequency change occurs between the Base Pennsylvanian and Base Mississippian chert from stations 197-212. Note also that a frequency anomaly occurs below the Base Mississippian chert, where between stations 200-230, frequencies consistently range from 36 to 48 Hz. Both left and right of this zone, frequencies are consistently above 50 Hz. This condition is weakly developed between stations 168-190. It is also apparent that frequencies in the Viola are significantly reduced between stations 173-230. These frequency distributions are significant in that velocity and frequency are directly related as follows:
v=fλ,
where v is velocity of the material, f is wave frequency, and λ is wavelength. Insofar as wavelength will remain relatively constant through a given time window, this relationship should yield relative velocity change within particular zones. Without going to a detailed model building and seismic trace inversion of amplitude to velocity, this display provides a quick look at potential velocity variation within any given zone.
The datasets presented herein clearly illustrate the utility of seismic data in the Coats South study area. Multifold sampling, with particular objectives in the Mississippian- and Ordovician-aged sediments, has yielded accurate and detailed correlation. Higher input frequencies, coupled with processing geared toward true amplitude recovery, has assisted in refinement of stratigraphic zone characterization. As in all stratigraphic plays, signal quality must be maintained at the highest possible level. Three-dimensional (3D) sampling and processing may very well aid exploration for this type of play in the future.
In any case, it is also apparent that while conventional displays will continue to suggest wavelet character anomalies which have significant stratigraphic counterparts, carefully applied trace-attribute analysis will also playa continuing and expanding role in overall anomaly characterization. Beyond the tools demonstrated in this study, techniques related to wavelet inversion (amplitude → velocity) as well as AVO, will almost certainly play increasingly more important roles in these types of stratigraphic plays.
ACQUISITION (Lockhart Geophysical, Denver, CO) 1991
Source: Vibroseis
Pilot: 20-128 Hz, 16 seconds x 12 sweeps
Sample rate: 2 msec
Source Array: 4 vibrators over 82.5 ft (24.8 m)
Source Interval: 165 ft (49.5 m)
Group Interval: 82.5 ft (24.8 m)
Spread: Split
Near Offset: 412.5 ft (124 m)
Far Offset: 5,362.5 ft (1,608 m)
Group Array: 12 phones @ 7.5 ft
Instruments: DFS V
Recording filters: 18-128 Hz
No. channels: 120/240 (Swath surveys)
Nominal fold: 30
PROCESSING: (ECHO Geophysical Corporation, Denver, CO)
Previous--Stockholm SW Field, Greeley/Wallace Counties || Next--Strahm South Field, Forest City Basin
Kansas Geological Survey
Comments to webadmin@kgs.ku.edu
Web version placed online Dec. 28, 2015. Original publication date 1995.
URL=http://www.kgs.ku.edu/Publications/Bulletins/237/Hedke1/index.html