Previous--Strahm South Field, Forest City Basin || Next--Walta Field (Simpson and Mississippian), Sumner County
1Kansas Geological Survey, 2University of Missouri-Rolla, 3Consultant
This article available as an Acrobat PDF file (9 Mb).
Hampton field, located in northwestern Rush County, Kansas (principally in secs. 5-8, T. 17 S., R. 19 W.), is a small Arbuckle field (1.12 MMBO) along the western flank of the Central Kansas uplift. The field is a classic example of an unconformity trap and reservoir related to development of "mature" karst features into a poorly organized hierarchy of closed depressions and erosional highs (e.g., fractures, sinks, steepheads, uvalas, and half-blind valleys). An understanding of the paleogeomorphology of the pre-Pennsylvanian exposure surface and its relationship to basement structure is critical to successful exploration and development. Seismic control provides evidence of pre-existing basement structure that influenced subsequent deposition and erosion. Structural relief and closure at the Arbuckle level across Hampton field can be recognized on the seismic data. The seismic data in conjunction with the well control are a valuable exploration and development tool. The seismic data provide insights into timing of tectonic movements, the influence of basement structure on subsequent deposition and erosional topography, and on differential compaction of post-Cherokee rocks across the pre-Pennsylvanian basement structure.
Hampton field, a relatively small but significant Arbuckle field along the western flank of the Central Kansas uplift, is an example of a karsted fracture-controlled dolomite reservoir at the northern end of the Arbuckle-Ellenburger trend. Regionally, the Arbuckle-Ellenburger trend of the southern midcontinent is one of the most significant oil- and gas-producing horizons in the United States, stretching nearly a thousand miles from the Central Kansas uplift across Oklahoma and Texas to the Delaware basin of West Texas (Gatewood and Fay, 1992). In Kansas, Arbuckle reservoirs account for approximately 47% of the 16.3 billion barrels of original oil in place, and over 32% of the cumulative 5.9 billion barrels of the total oil produced (Watney and Paul, 1983; Newell et al., 1987; Carr, 1994). Reservoir development in the Arbuckle and equivalent units has been directly related to prolonged periods of subaerial exposure and karst development that initiated with the Middle Ordovician Sauk-Tippecanoe cratonic sequence boundary (Sloss, 1963). In areas such as the Central Kansas uplift, intermittent periods of subaerial exposure continued up through the Early Pennsylvanian (base of Absaroka Sequence, Sloss, 1963; Walters, 1946, 1958,1991). During these episodes of widespread exposure, renewed karst development occurred. The result is a terrain characterized by the development of underground solution networks, disorganized surface drainage, and a surface topography characterized by a hierarchy of closed depressions resulting from solution and collapse (e.g., Walters, 1991).
Karst development in the Arbuckle section enhanced porosity and permeability, creating prolific petroleum wells and large reservoirs (Walters, 1958; Merriam, 1963; Adler, 1971; Ramondetta, 1990). Production is typically restricted to the top 25 ft of the Arbuckle (Adler, 1971). However, deeper low-to moderate-volume stratified production has been identified in a number of fields including EI Dorado (Ramondetta, 1990) and Edwards (Mullins and Ireland, 1967). The presence of lower stratiform pay zones may be related to depositional stratification or stratified karst structures. The complete range of reservoir types in the Arbuckle has not been adequately characterized, and the Arbuckle should not be considered fully tested until Precambrian rocks are reached (Bloesch, 1964).
The major focus in this paper is the examination of available well and seismic data in the area of Hampton field using a karst model. Our goals are to develop an understanding of the effect of the paleogeomorphology of an erosional surface on petroleum production, the influence of basement controls on subsequent deposition and erosion, and the application of seismic data to imaging the erosional surface. The seismic profile incorporated in this paper crosses the southern flank of the Hampton field. The profile images what is believed to be a typical Arbuckle field along the southwestern margin of the Central Kansas uplift.
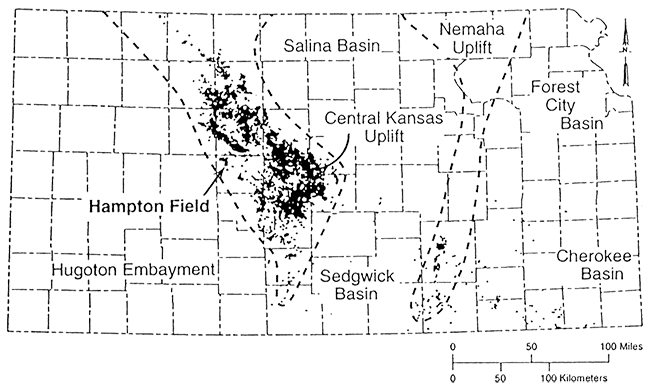
Hampton field, located in northwest Rush County, Kansas (principally in secs. 5-8, T. 17 S., R. 19 W.), is one of numerous moderate to small Arbuckle fields (i.e., 1-5 MMBO) located along the southwestern flank of the Central Kansas uplift (fig. 1). The Central Kansas uplift, a northwest-trending complex of structural features, is the largest positive feature in Kansas. Post-Mississippian in age, the uplift was described by Merriam (1963) as "a maze of small anticlinal and synclinal structures, many of which are faulted." The crest of the uplift is recognizable by the superposition of Pennsylvanian sediments directly on Precambrian basement. The flanks exhibit truncated pre-Pennsylvanian strata overstepped by Pennsylvanian beds (Merriam, 1963).
Figure 1--Map showing distribution of wells producing from the Arbuckle group in Kansas in relation to the major structural features. The Hampton field is located in northwest Rush County.
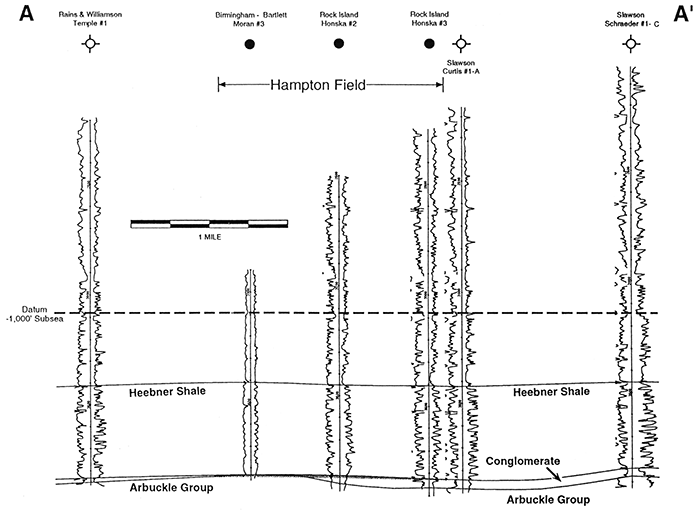
In the 1960's, exploration moved off the crest of the Central Kansas uplift and away from the giant Arbuckle fields of Barton, Russell, and Ellis counties. Arbuckle production was discovered at Hampton field in March 1967 (Birmingham Bartlett #1 Littler "C," SE NW SE sec. 6, T. 17 S., R. 19 W.), and was followed the next year by discovery of oil in the overlying Pennsylvanian conglomerate (Rock Oil #1 Honska, NW NW NE sec. 8, T. 17 S., R. 19 W.). Reported initial production from the Arbuckle discovery well was 60 BOPD. Field production increased quickly to a peak in 1968 of over 400 BOPD from 17 wells (fig. 2). Production is from either the top few feet of the Arbuckle, or on the eastern extension of the field from the overlying Arbuckle "conglomerate" (figs. 3 and 4). The field, with the exception of a single well pool on the NW corner (Baldwin "B" lease, NW NW SW sec. 6), appears to have a common original oil-water contact at -1,745 ft subsea (-532 m) (fig. 4). Typical of the Arbuckle production, Hampton field has a strong bottom water drive. Average measured drilling depth to production is just over 3,800 ft (1,158 m). Hampton field covers approximately 600 acres (243 hm2) and was developed on 40-acre (16-hm2) spacing (fig. 3).
Figure 2--Annual production data from Hampton field from discovery in 1967 through 1992. Reported cumulative production from Hampton is entirely oil, and through 1993 was 1.12 MMBO.
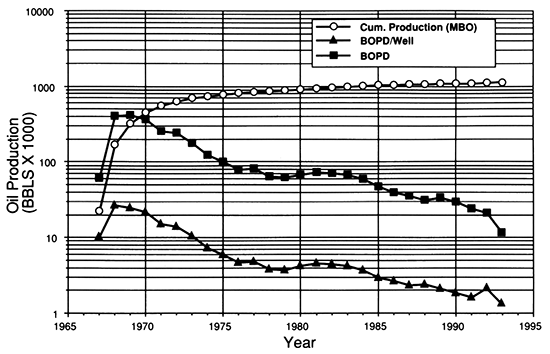
Figure 3--Index map of Hampton field area, showing the area of oil production from both the Arbuckle and basal Cherokee conglomerate. Locations of the geologic cross section (fig. 4) and seismic section are shown (fig. 8).
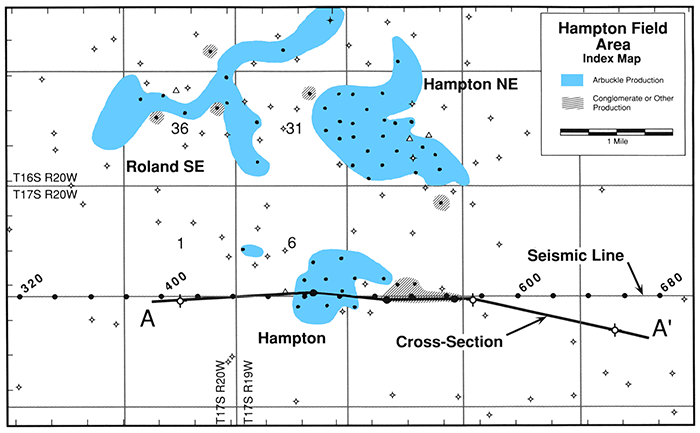
Figure 4--East-west structural cross section across a part of Hampton field (fig. 6). An original oil-water contact at approximately -1745-ft (-532-m) subsea is present in both the Arbuckle and Cherokee "conglomerate." Cherokee thins from over 30 m (100 ft) in Arbuckle lows to less than it meter (2 ft) over the highs, filling in much of the local Arbuckle relief (figs. 3 and 5). Structural relief on higher markers (e.g., Heebner Shale) is very subtle and is attributed to compaction. Section is roughly parallel to seismic profile (fig. 8).
Reported cumulative production from Hampton is entirely oil, and through 1993 was 1.12 MMBO. Since the peak in 1968, field production has steadily decreased to a present rate of less than 25 BOPD (fig. 2, table 1). In 1992, only 10 wells located on two leases operated by Phillips Petroleum were actively producing. Average per well cumulative recovery is over 60 MBO, and the best wells in the field have cumulative recoveries in excess of 100 MBO. Arbuckle wells on the crest of the Central Kansas uplift, although at a much tighter 10-acre (4-hm2) spacing, have reported similar cumulative per well recoveries (Walters, 1991). Because of the heterogeneous nature of the fracture porosity and permeability in the Arbuckle and the absence of complete penetrations, Arbuckle fields such as Hampton have defied attempts by conventional methods to estimate original oil in place (OOIP). However, fields such as Hampton appear to be attractive economically because of the relatively shallow drilling depths and oil recoveries per surface acre ranging from 2,000 to 3,000 barrels.
Table 1--Hampton field production by lease.
| Lease Name |
Operator | Cumulative Production Through 1992 |
1992 Annual Production |
Producing Wells |
|---|---|---|---|---|
| Baldwin "B" | Birmingham-Bartlett | 44,792 | 0 | 1 |
| Elmore "A" | Pintail Petroleum | 155,146 | 0 | 2 |
| Littler "C" | Phillips Petroleum | 396,160 | 3,416 | 6 |
| Moran | Phillips Petroleum | 428,397 | 4,476 | 4 |
| Honska | Oil Prod. Systems | 94,894 | 0 | 3 |
| House | Koch | 310 | 0 | 1 |
| Totals | 1,119,699 | 7,892 | 17 |
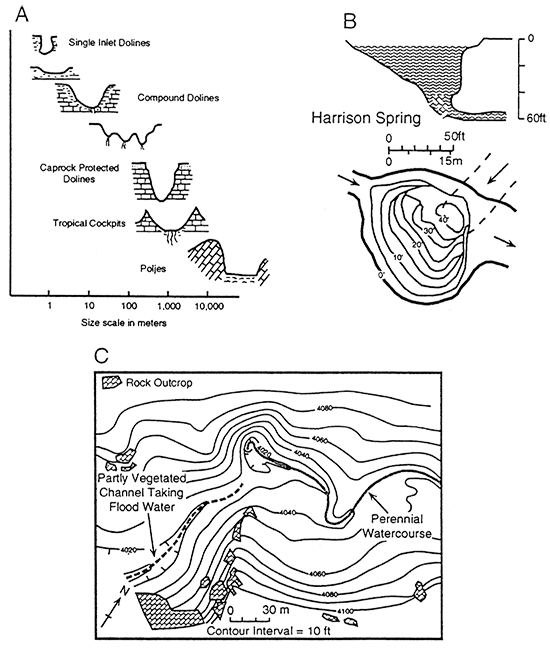
Hampton field is interpreted as a stratigraphic trap formed by an erosional high on the top of the Arbuckle Group (i.e., a hill). The overlying Pennsylvanian Cherokee shales and silts provide vertical and lateral seals. Relief on the Arbuckle unconformity surface, defined by well control, is as much as 30 m (100 ft) over a distance of less than 0.5 km (1,600 ft). As contoured, relatively steep walls separate roughly flat-topped hills from irregular valleys and closed depressions. Hampton field is interpreted as an elongated roughly east-west erosional high that is surrounded by karst features such as sinks, steepheads, and half-blind valleys developed on top of the Arbuckle (fig. 5). Surface paleotopography as depicted on top of the Arbuckle is similar in morphology and scale to surface landforms described from other karst terrains (fig. 6). In particular, the abundance of closed depressions varying in size and arrangement mapped in the area resemble the compound sinks, blind and half-blind valleys, and generally disrupted surface-drainage pattern that are indicative of karst terrain (Jennings, 1985). The erosional surface developed on the Arbuckle in the Hampton area is interpreted as a poorly organized segmented surface drainage with reaches of both underground and surface flow (Jennings, 1985). Blind and half-blind valleys form as surface streams that gradually disappear underground (e.g., low separating the three fields in the Hampton area, fig. 5). In karst terrains stream emergence is often marked by a blind headwall or steephead (e.g., SW SW sec. 29, T. 16 S., R. 19 W., fig. 5). Headwalls are formed by head ward retreat of the valley by stepping back of cliffs resulting from accelerated erosion at the base by a spring or rising (fig. 6; Jennings, 1985). As mapped, the morphology and scale of Arbuckle structure in the Hampton field area displays many of the features of "mature" karst development. Cherokee conglomerate production at Hampton field is concentrated in an area where the paleodrainage may have been underground, re-emerging immediately to the south of the field. Production in the conglomerate, which is composed of brecciated Arbuckle, may be related to collapse of this underground paleodrainage. A similar set of Arbuckle paleotopographic features (i.e., erosional highs with irregular outlines surrounded by closed depressions of various scales) are mapped at nearby Hampton Northeast and Roland Southeast fields (fig. 5). The morphology and scale of both the positive features and closed depressions in the Hampton field area strongly suggest genesis as surface landforms associated with karst.
Figure 5--Structure contours on top of Arbuckle Group in the area of Hampton field. Oil production from the Arbuckle is confined to the tops of highs that are interpreted as erosional highs on a heavily karsted surface. Paleodrainage patterns are shown to be poorly organized and segmented as a connecting series of compound sinks, half-blind Valleys, and steepheads. Cherokee conglomerate production at Hampton field is concentrated along an area where surface flow may have been underground and may be related to brecciation associated with cave collapse.
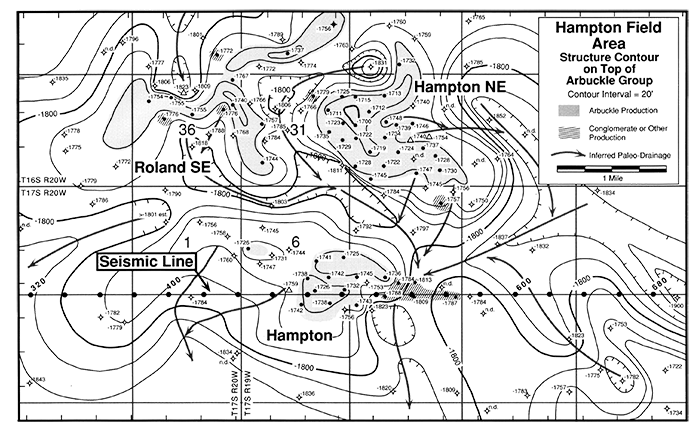
Figure 6--Selected surface landforms in modern karst regions: A) profile sketch illustrating scale and types of closed depression features; B) alluviated spring and rise pit; C) a half-blind valley. All figures modified from Jennings (1985).
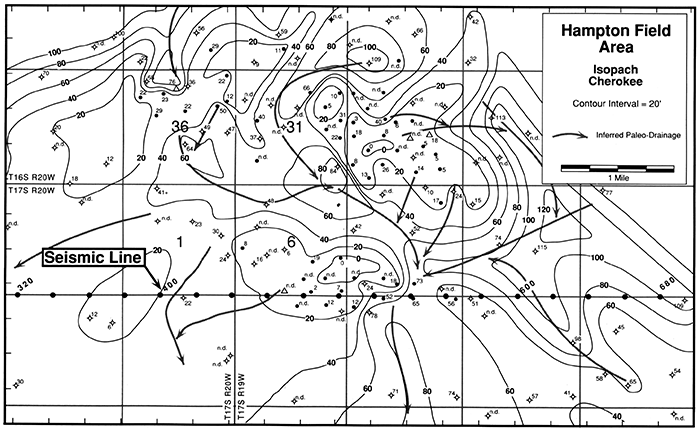
The Pennsylvanian Cherokee shales and silts immediately overlie the Lower Ordovician Arbuckle Group in the Hampton field area. The Cherokee was deposited on the karsted pre-Pennsylvanian erosion surface along the flanks and over the crest of the Central Kansas uplift. Across the Central Kansas uplift, the Cherokee fills depressions and valleys in the underlying strata, and locally pinches out against paleotopographic highs (Walters et al., 1979). The Cherokee isopach in conjunction with the Arbuckle structural contour map show that the Cherokee thins from over 30 m (100 ft) in Arbuckle lows to less than a meter (2 ft) over highs (figs. 5 and 7). The Cherokee fills in much of the local Arbuckle relief, and isopachs between post-Cherokee markers (e.g., Marmaton to Lansing-Kansas City) show only a general regional thickening to the southwest off the Central Kansas uplift. On the basis of well tops, the Hampton field structure persists through the entire section, but diminishes significantly above the Cherokee. Local structural relief of over 100 ft (30 m) on the Arbuckle surface decreases to less than 5 m (15 ft) at the base of the Stone Corral Anhydrite. Local structural relief on higher markers (e.g., Heebner Shale and Stone Corral) is very subtle and is attributed to compaction over Arbuckle highs (fig. 4).
Figure 7--Cherokee isopach in the area of Hampton field. the Cherokee fills in the Arbuckle paleotopograpy (figs. 3 and 5). Cherokee thins from over 30 m (100 ft) in Arbuckle lows to less than a meter (2 ft) over the highs.
Inherited Precambrian structural grain appears to influence the position and axis of pre-Pennsylvanian karst features across the Central Kansas uplift. Many workers have recognized the relationship between the Precambrian basement structures and the distribution of overlying strata (e.g., Merriam, 1963). In addition to providing inherited structural relief, the Precambrian structural grain may provide zones of weakness for development of compound sinks (uvalas) and reaches of surface and subsurface drainage. The influence of inherited structural grains on modern karst development has been well documented (e.g., Jennings 1985).
Understanding of the paleogeomorphology of the Arbuckle weathering surface, the possible influence of Precambrian topography, and the relationship of karst landform development to pre-existing structure, are important components to hydrocarbon exploration and production. At El Dorado field in eastern Kansas, high rates of initial production in Arbuckle were reported to follow permeability trends similar to modem karst. These trends were related to inherited fracture systems (Ramondetta, 1990). East of Hampton field, karst features, formed in the sedimentary rocks surrounding and covering buried Precambrian hills, were linked to the prolific oil production from the Arbuckle at Gorham, Kraft-Prusa, Beaver, and Bloomer fields in Barton and Russell counties (Walters, 1946, 1991). Solution features such as moat-like valleys and numerous small sinkholes and valleys formed by coalescing sinkholes (uvalas) surround many of these "buried hills" (Walters, 1946, 1991). These buried karst features were interpreted as forming in the Arbuckle carbonates in early Pennsylvanian when the entire area was above sea level and was undergoing weathering and erosion prior to deposition of Pennsylvanian sediments (Walters, 1991).
The sample seismic line across Hampton field (figs. 8 and 9) crosses a closed structural high at the top of the Arbuckle Group (figs. 4 and 5). Closure at the top of the Arbuckle Group along the length of the seismic line is estimated (from geologic control only) to be on the order of 30 m (98 ft). At horizons above the Cherokee, structural relief is less than 10 m (32 ft) and decreases to less than 5 m (16 ft) at the Stone Corral. All horizons dip regionally to the west-southwest into the Hugoton embayment (fig. 1).
Figure 8A and 8B--Uninterpreted and interpreted, reverse-polarity, vibroseis seismic profile across the Hampton field (fig. 3). These data are interpreted to show basement-involved faulting, depositional onlap of Cambrian and Arbuckle units, and compaction and were acquired by Lockhart Geophysical using a split-spread receiver array with a source interval of 165 ft (50 m), a group interval of 82.5 ft (25 m), and near and far offsets of 412.5 ft and 2,805 ft (126 m and 855 rn), respectively. Twelve 12-sec, l4-150-Hz sweeps were summed at each source location. The notch filter was out. The interpreted horizons from the deep to shallow include top of interpreted basement (purple), top of Arbuckle Group (aqua), top of Marmaton Group (yellow), top of Topeka Limestone (green), base and top of Hutchinson Salt (orange), and top of Stone Corral Formation (red). Basement-involved faulting is highlighted in yellow.
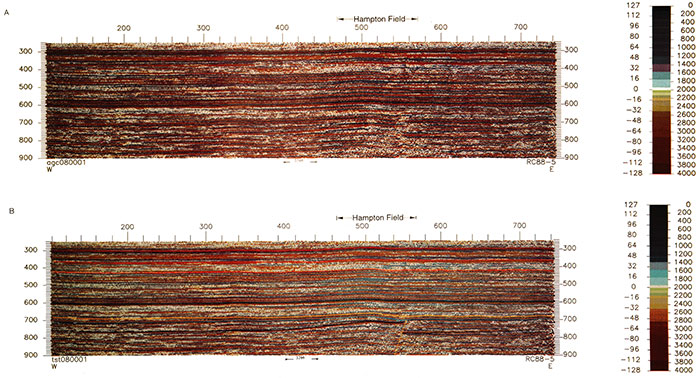
Figure 9A and 9B--Uninterpreted and interpreted reflection-strength display of the same seismic data as presented in fig. 8. The reflection-strength display highlights the difference in the interpreted Precambrian basement and the overlying Phanerozoic sedimentary sequence. The basement-involved fault is also highlighted in this display. Interpreted horizons are identical to fig. 8.
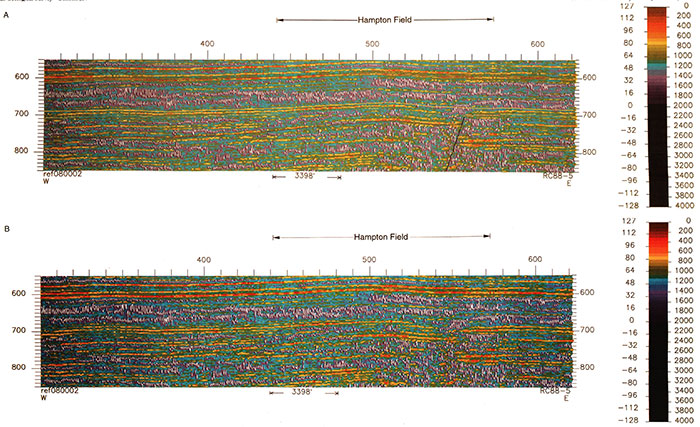
The vibroseis-sourced seismic data (figs. 8 and 9) were acquired in 1988 by Lockhart Geophysical using a split-spread receiver array with a source interval of 165 ft (50 m), a group interval of 82.5 ft (25 m), and near and far offsets of 412.5 ft and 2,805 ft (126 m and 855 m), respectively. Twelve 12-sec, 14-150-Hz sweeps were summed at each source location. The notch filter was out. These data are interpreted to be zero-phase and reverse polarity.
As an aid to the interpretation of the example seismic line, two zero-phase, 52-Hz, Ricker-wavelet based, one-dimensional synthetic seismograms (normal and reverse polarity displays) were generated (figs. 10 and 11). The well in the SW NE NW sec. 6, T. 17 S., R. 19 W. (fig. 10), is about 0.8 km (0.3 mi) north of shotpoint 490; the corresponding synthetic seismogram ties the seismic line reasonably well (figs. 8 and 9). The well in the SE SE SE sec. 6, T. 17 S., R. 19 W. (fig. 11), is effectively on-line; the corresponding synthetic seismogram ties the seismic line at shotpoint 480 (fig. 8).
Figure 10--Integrated sonic log, acoustic-impedance curve, and 52-Hz, zero-phase, ricker-wavelet based synthetic seismograms for the SW NE NW sec. 6, T. 17 S., R. 19 W. well (fig. 3). The well is about 0.8 km north of trace 490; the corresponding normal-polarity synthetic seismogram ties the seismic line reasonably well at trace 1060 (figs. 8 and 9). These synthetic seismograms were generated using Geophysical Micro-Computer software.
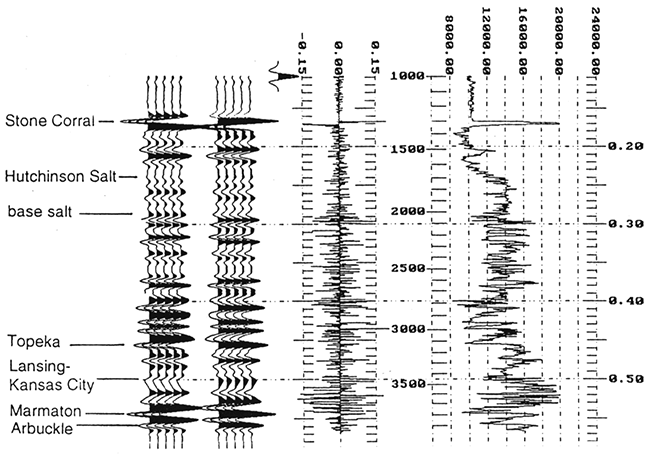
Figure 11--Integrated sonic log, acoustic-impedance curve, and 52-Hz, zero-phase, ricker-wavelet based synthetic seismograms for the SE SE SE sec. 6, T. 17 S., R. 19 W. well (fig. 3). The well is effectively on-line; the corresponding synthetic seismogram ties the seismic line at trace 980 (figs. 8 and 9). These synthetic seismograms were generated using Geophysical Micro-Computer software.
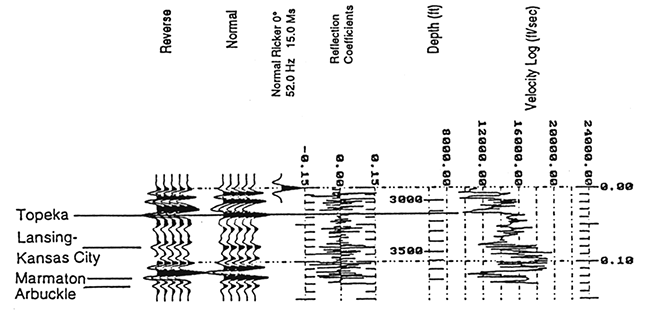
As is indicated on figs. 10 and 11, the synthetic seismograms utilize sonic-log data only; neither check shot nor density control is available for these wells. Throughout most of the subsurface geologic section, sediment density and acoustic velocity are directly proportional, and sonic-based synthetic seismograms are reasonable approximations to the seismic image of the subsurface. However, this generalized velocity/density relationship is not valid for salt-bearing strata. Rock salt has a relatively high acoustic velocity and an anomalously low density. As a consequence, the synthetic response to the relatively low-density Hutchinson Salt Member is somewhat misleading (fig. 10). In a relative sense, the top of the salt has a lower acoustic-impedance contrast than that indicated on the synthetic seismogram, and hence is a lower-amplitude reflection (relatively) on field seismic data; the base salt event in contrast is a better-defined, higher-amplitude reflection on actual seismic data.
With the exception of the Hutchinson Salt interval, the synthetic seismograms are presented as reasonable models of the processed vibroseis data (figs. 8,9, 10, and 11). A number of significant geologic markers are identified on the synthetic seismograms; several of these generate prominent events. The Stone Corral, Topeka, Marmaton, and Arbuckle reflections, for example, are manifested as prominent troughs on the reverse-polarity synthetic display.
The seismic data were loaded into a computer workstation using Landmark interpretation software. Frequency analysis and spectral shaping of seismic data were performed to attenuate unwanted noise from a seismic section and to enhance resolution. Landmark's BCM2D system provides the opportunity to analyze and shape frequency spectra of post-stack data in an easy and efficient manner with almost instant feedback. Central difference operators were also applied to 'whiten' wavelet-frequency spectra. Application of frequency analysis, spectral shaping, and central difference operators to data dramatically improved vertical resolution (up to 4x), accentuating and resolving thin intervals that were represented as mere inflections in the original data. Variable-density fills and reflection-strength displays of the seismic data were generated (figs. 8 and 9). Prominent events have been correlated on these sections, and where possible these horizons are identified on the synthetic seismograms (figs. 7 and 8), and labelled on the geologic cross section (fig. 4).
The lowermost correlated reflection on the seismic section, the trough identified as the acoustic basement, is thought to originate at the top of the crystalline Precambrian surface (i.e., purple event in figs. 8 and 9). Due to a paucity of basement penetrations in the immediate study area, this seismic event cannot be directly time-tied to well-log control. The interpretation of basement is consistent in part with 1) Precambrian structural trends in the region, 2) well-log control in the immediate surrounding area, 3) the patterns of time-structural relief exhibited by post-Precambrian events, and the observed "basement events" that terminate abruptly where the acoustic basement is interpreted as steeply dipping or faulted. The abrupt termination of basement reflections across the basement-involved faulting is evident in both the variable-density fill and reflection-strength displays (figs. 8 and 9). As interpreted, vertical offset of the basement across the fault is approximately 60 msec (approximately 100-150 m; 328-492 ft). In areas that the basement dips more gently, basement reflections show a pattern of erosional truncation associated with apparent depositional onlap of the overlying sedimentary package (e.g., area between shotpoints 300 and 480). The difference in reflection strength above and below the purple event was also used to discriminate between the Precambrian basement and the overlying Phanerozoic sedimentary sequence. A pattern interpreted as deposition onlap of a buried Precambrian positive feature has been imaged by the seismic data across the Hampton field area. Similar patterns of onlap of Precambrian positive features have been reported by well data from numerous areas of the Central Kansas uplift and are documented to form hydrocarbon traps (e.g., Walters, 1946, 1991; Miller, 1968).
The overlying Arbuckle event is represented as a trough on the synthetic seismograms (figs. 10 and 11), and can be directly time-tied to the seismic data (i.e., aqua event of figs. 8 and 9). The pattern of time-structural relief observed along this unconformable surface is consistent with 1) well-log control, 2) the observed thinning of the Stone Corral/Arbuckle time interval, and 3) the pattern of time-structural relief interpreted along the acoustic basement. Relief at the Arbuckle level can be attributed, in part, both to depositional thinning related to onlap of pre-existing Precambrian structure and to reactivation of pre-existing fault planes in post-Arbuckle to pre-Pennsylvanian time. Subsequent erosion of the Arbuckle related to karst development at the pre-Pennsylvanian exposure surface heavily modified the structural relief associated with both preexisting depositional and structural patterns. In interwell areas on the geologic cross section of fig. 4, relief along the Arbuckle and shallower horizons is based on the interpretation of these seismic data.
Subsequent shallower events (e.g., Marmaton, Topeka, and Stone Corral) also appear to drape the basement structure (figs. 8 and 9). In a manner consistent with compaction-induced drape, the magnitude of this relief decreases at shallower levels. This apparent correlation does not preclude the possibility that a component of the structural relief observed at shallower levels could be due to the reactivation of basement faults; however, it does indicate that if this was the case, net vertical movement was either relatively small (compared to pre-existing relief at the basement level) or that the Sense of vertical movement was consistent with earlier faulting. Compelling evidence to attribute structure along the shallower horizons to compaction across crystalline basement (as opposed to post-depositional faulting) is the lateral continuity of reflections and the uniformity of such units as the Hutchinson Salt Member (figs. 8 and 9). Although the Hutchinson Salt drapes appreciably across basement highs, the time-thickness of this rock-salt unit is effectively uniform along the length of the seismic line. Additionally, there is no seismic evidence of salt dissolution. If structural relief at the Hutchinson level were primarily due to faulting, some localized salt dissolution would be expected (Anderson et al., this volume, p. 57-65; Anderson et al., this volume, p. 66-70).
The seismic data across the Hampton field were used in conjunction with regional well control to provide insight into the geologic history and petroleum geology of the southwestern flank of the Central Kansas uplift. Paleotopographic relief at the level of the Arbuckle exposure surface appears to be a function of well-developed karst that was strongly influenced by pre-existing basement structure. The seismic data across Hampton image both the basement-involved faulting [approximately 100-150 m (328-492 ft) of vertical offset], and the effect of this basement relief on the subsequent depositional onlap of the Cambrian? and Ordovician sediments. Thinning of CambrianOrdovician sediments across the positive Precambrian feature at Hampton field appears to be of a magnitude of 75-100 m (248-330 ft) and is interpreted as a result of both depositional onlap and erosional truncation.
The Cherokee isopach, the Arbuckle structural map, and the seismic data show the effect of basement structure and erosional paleotopography on Cherokee sedimentation. The Cherokee was deposited, filling depressions and valleys in the underlying Arbuckle: erosion surface. The Cherokee thins from over 30 m (100 ft) in Arbuckle lows to less than a meter (2 ft) over the highs (figs. 8 and 9). The seismic data across the Hampton area shows a well-developed onlap pattern of Cambrian and Arbuckle reflections on both sides of the basement high and are interpreted to represent up to 100 m (328 ft) of depositional relief (figs. 8 and 9). On the basis of well tops and the seismic data, structure persists but diminishes significantly up through the entire section. The local structural relief is over 30 m (100 ft) on the Arbuckle surface and decreases to less than 7 m (25 ft) at the Stone Corral Anhydrite. The structural and stratigraphic content of the seismic data appears to hold a high degree of integrity against the well data.
On the basis of the parallel nature of seismic reflections, absence of observed faults cutting well bores, and lack of significant local changes in post-Cherokee isopachs across Arbuckle highs, the structure after the pre-Pennsylvanian unconformity is interpreted as the result of differential compaction and drape across the pre-Cherokee structures. The pre-Desmoinesian to post-Mississippian development of the Central Kansas uplift and subsidiary features is probably related to the inherited and reactivated basement structure recognized on the seismic data (Merriam, 1963). Due to the absence of deep Arbuckle penetrations in the Hampton area, the degree of structural influence on the Arbuckle reservoir can not be determined from well control. However, based on seismic data, pre-existing basement structure appears to strongly influence the development of paleogeomorphic features observed on the Arbuckle erosional surface. Both Arbuckle structure and reservoir quality were significantly modified by karst at the pre-Pennsylvanian regional unconformity.
Karst terrains, such as that interpreted in the Hampton area, have poorly organized drainage systems separated from irregular shaped highs by relatively steep slopes. The highs are cut by re-entrants with steep head walls and sinks (dolines) at their heads. Arbuckle fields, such as Hampton and its neighboring fields, are examples of unconformity traps in which an understanding of paleogeomorphology and inherited basement structure are critical to successful exploration and development. The existence of extension opportunities has been demonstrated in the area such as the southwestern extension of Hampton Northeast (Littler "1," 1990 discovery), and the Roland Southeast field (1988 discovery). Examination of the structure map on top of the Arbuckle and comparison to cumulative production patterns indicates a number of additional infield and extension opportunities in the area. In addition stratigraphically lower intervals of the Arbuckle and Cambrian may be viable targets where they onlap the older Precambrian positive features.
The seismic data were donated by Lockhart Geophysical. Their generosity is appreciated. Mr. James R. Daniels provided valuable feedback as to well locations and tops.
Adler, F. J., 1971, Future petroleum provinces of the midcontinent, region 7; in, Future Petroleum Provinces of the United States--Their Geology and Potential: American Association of Petroleum Geologists, Memoir 15, p. 985-1,120
Bloesch, E., 1964, Arbuckle production and prospects in northeastern Oklahoma: Tulsa Geological Society Digest, v. 32, p. 91-97
Carr, T. R., 1994, Kansas oil and gas production trends: Kansas Geological Society, Bulletin, v. 69, no. 8, p. 12-16 [version available online]
Gatewood, L. E., and Fay, R. O., 1992, Untapped potential from Mexico to Mississippi--Surprises of the Ellenburger-Arbuckle-Knox trend: Oil and Gas Journal, October 19, p. 93- 96
Jennings, J. N., 1985, Karst geomorphology: Basil Blackwell, New York, 293 p.
Merriam, D. F., 1963, The geologic history of Kansas: Kansas Geological Survey, Bulletin 162, 317 p. [available online]
Miller, R. R., 1968, Geology of Otis-Albert field, Rush and Barton counties, Kansas; in, Natural Gases of North America, W. Beebe, ed.: American Association of Petroleum Geologists, Memoir 9, p. 1,588-1,615
Mullins, C. A., and Ireland, W. C., 1967, Additional Arbuckle reserves developed below original completion depth in stratified reservoir: Society of Petroleum Engineers of AIME, Paper No. SPE 1963
Newell, K. D., Watney, W. L., Cheng, S. W. L., and Brownrigg, R. L., 1987, Stratigraphic and spatial distribution of oil and gas production in Kansas: Kansas Geological Survey, Subsurface Geology Series 9, 86 p. [available online]
Ramondetta, P. J., 1990, El Dorado--an old field with potential: Oil and Gas Journal, March 26, p. 110-116
Sloss, L. L., 1963, Sequences in the cratonic interior of North America: Geological Society of America, Bulletin, v. 74, p. 93-114
Walters, R. F., 1946, Buried Precambrian hills in northeastern Barton County, central Kansas: American Association of Petroleum Geologists, Bulletin, v. 30, p. 660-710
Walters, R. F., 1958, Differential entrapment of oil and gas in Arbuckle dolomite of central Kansas: American Association of Petroleum Geologists, Bulletin, v. 42, p. 2,133-2,173
Walters, R. F., 1991, Gorham oil field, Russell County, Kansas: Kansas Geological Survey, Bulletin 228, 112 p. [available online]
Walters, R. F., Gutru, R. J., and James, A., III, 1979, Channel sandstone oil reservoirs of Pennsylvanian age in northwestern Ness County, Kansas; in, Pennsylvanian Sandstones of the Midcontinent, N. J. Hyne, ed.: Tulsa Geological Society, Special Publication No. 1, p. 313-326
Watney, W. L., and Paul, S. E., 1983, Oil exploration and production in Kansas-present activity and future potential: Oil and Gas Journal, v. 81, p. 193-198
Previous--Strahm South Field, Forest City Basin || Next--Walta Field (Simpson and Mississippian), Sumner County
Kansas Geological Survey
Comments to webadmin@kgs.ku.edu
Web version placed online Jan. 4, 2016. Original publication date 1995.
URL=http://www.kgs.ku.edu/Publications/Bulletins/237/Carr1/index.html