Previous--Seismic Response of Pennsylvanian Cyclothems || Next--Plastic Deformation and Dissolution of the Hutchinson Salt Member in Kansas
1Department of Geology and Geophysics, University of Missouri-Rolla and 2Kansas Geological Survey
This article available as an Acrobat PDF file (9 Mb).
The Hutchinson Salt Member of the Wellington Formation (Permian) is preserved throughout central and south-central Kansas as a more-or-less continuous body with net thicknesses of up to 560 ft (170 m). This salt has been extensively dissolved along its eastern margin due to contact with unconfined, undersaturated ground water during the Tertiary, Quaternary, and present. West of the main dissolutional edge, localized salt solution is occurring, probably associated with subsurface ground-water flow focused along structural conduits such as fractures and faults. Such solution has occurred in the past and in some areas is presently occurring.
In those areas where dissolution and associated deformation has not occurred, the Hutchinson Salt can generally be mapped on seismic data. Exceptions occur in those areas where the salt is too thin to be resolved given the effective bandwidth of the seismic data. Undeformed salt does not appreciably degrade the quality of seismic events of deeper origin.
In contrast, in those areas where significant leaching has occurred, the Hutchinson Salt can be difficult to map seismically. The reflection from the top of the remnant salt can be difficult to correlate as a result of excessive curvatures and surface irregularities, lateral variations in acoustic-impedance contrast, and superposed diffractions emanating from salt-related collapse features. The intra-salt and base salt events can be masked by diffractions as well as velocity-generated time-structural relief.
The recognition of velocity-generated time-structural relief along pre-salt events is particularly critical to the petroleum explorationist. It is imperative that the industry interpreter differentiate real structure from apparent structure on seismic data to preclude the possibility of drilling into non-existent structural closure along pre-salt horizons. The explorationist working in Kansas should be aware of the distribution of subsurface salts and the potential for leaching.
The Hutchinson Salt Member (fig. 1) has been extensively dissolved along its eastern margin due to contact with unconfined, undersaturated ground water during the Tertiary, Quaternary, and present. West of the main dissolutional edge, localized salt solution has occurred in the past and in some areas is presently occurring. Such sites are characterized by surface sinkholes and/or subsurface cavities. The more recent sinkholes (formed in the last last 100 years) are often associated with either salt mining or saltwater disposal and in some instances surface expressions developed in a matter of only hours or days (Walters, 1978). With respect to sinkholes of anthropogenic origin, it appears that the dissolution rate has been appreciably increased where boreholes penetrating the salt allow water to enter the salt beds, especially when surface meteoric water can pass through the salt into lower strata. Cavity formation may be substantial where the boreholes pass through or very near geologic structures that allow subsurface waters to naturally enter and dissolve the salt beds. The collapse of cavities as a result of salt dissolution in the subsurface has caused either gradual or catastrophic subsidence at ground level, and therefore has significant financial, environmental, and public safety implications.
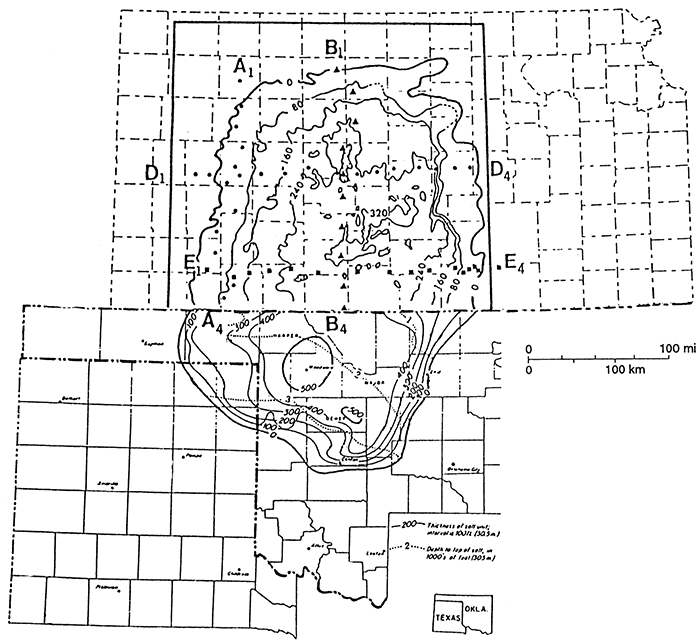
Figure 1--Distribution of Hutchinson Salt Member in Kansas, Oklahoma, and Texas. Kansas: net salt isopach with 80-ft (24-m) contour interval and outline of study area shown. Limit of Hutchinson Salt Member in Texas and Oklahoma from Johnson (1976).
The lower Leonardian Wellington Formation is the lowest unit of the Sumner Group, consisting of three members: a lower member of cyclic anhydrites and shale, the Hutchinson Salt, and an unnamed upper shale (Dell wig, 1963; Norton, 1939). The Wellington Formation is transitional between the cyclic marine limestone, dolomite, shale, and siltstone in the underlying Wolfcampian (Lower Permian) Chase Group and the overlying red-bed evaporites of the Ninnescah Shale and Stone Corral Formation. The overlying Ninnescah Shale is disconformable with the Wellington Formation in northern Kansas (Rascoe, 1968).
The Lower Leonardian-age Hutchinson Salt is a cyclic shelf deposit that accumulated on the northeastern extremity of an extensive evaporite facies tract, the southern edge of which is in West Texas (fig. 1). A belt of open and restricted shelf-margin and shelf carbonates of the Wichita Group lies south of the evaporite facies tract, rimming the northern edge of the Midland basin, then occupied by a deep Permian seaway (Watney, 1980; Watney et al., 1988).
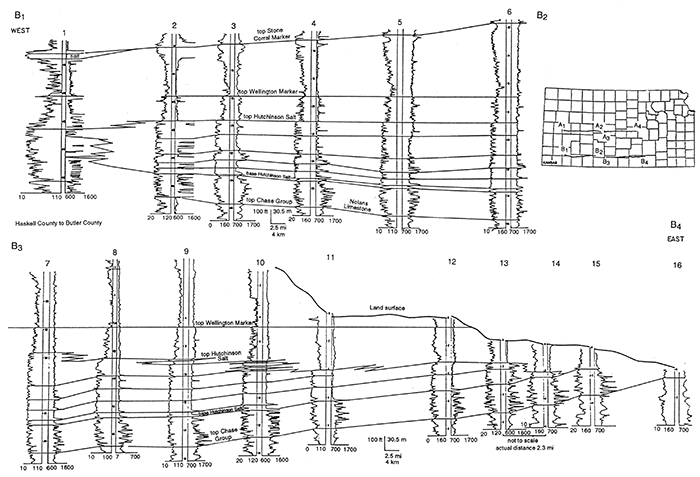
The Hutchinson Salt consists of a stacked succession of many thin, but laterally extensive halite-dominated marine cycles (cyclic carbonate, sulfate, and halite). The halite-dominated cycles interfinger with and prograde over anhydrite beds southwestward towards the source of seawater (figs. 2 and 3). The cross sections of figs. 4 and 5 demonstrate this interstratification and correlation, while detailed core descriptions confirm the distinctive cyclicity of the evaporites. Watney (1980) and Watney et al. (1988) illustrate that the salt depocenter shifted southward progressively through time, as well as shrinking in areal distribution of the rock salt. Four bundles of multiple halite cycles are present and each younger set offlaps southward from the older set. Halite deposition covered a maximum of 37,000 mi2 (96,000 km2), Total volume of this salt mass is estimated to be 1,100 mi2 (2,850 km2).
Figure 2--Total net salt isopach of the Hutchinson Salt Member of the Wellington Formation in Kansas. Contour interval is 40 ft (12 m); refer to fig. 1 for location.
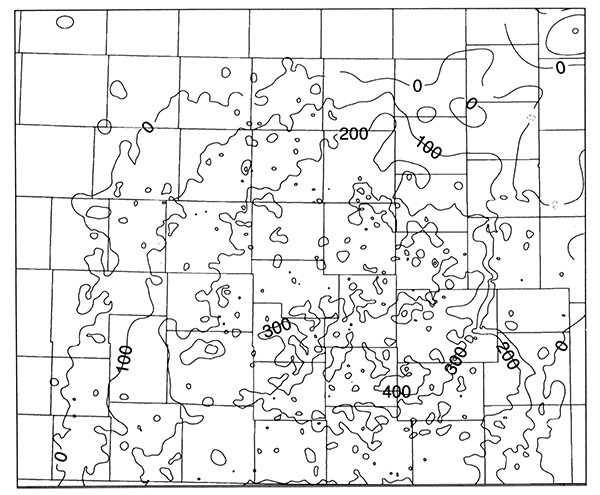
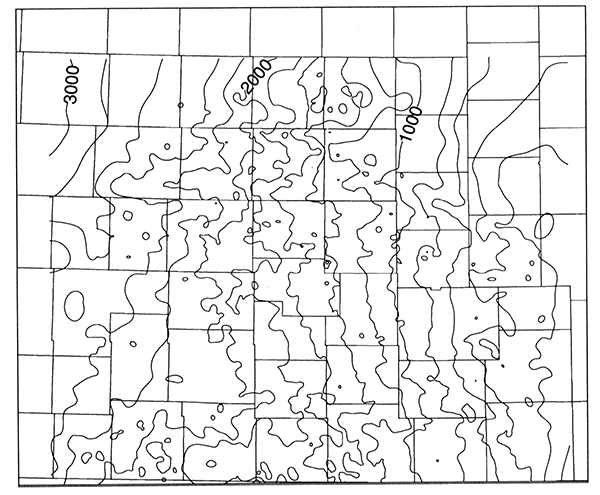
Figure 3--Depth to Hutchinson Salt Member of the Wellington Formation in Kansas. Contour interval is 50 ft (15 m); refer to fig. 1 for location.
Although the net thickness of the rock salt (relatively pure halite) diminishes to the southwest, the total thickness of the salt-bearing interval increases uniformly toward the south-central map area (fig. 2). Thicknesses increase from less than 50 ft (17 m) on the north to over 550 ft (183 m) in the south, indicating maximum sediment accommodation space in the south due to greater subsidence. The subsidence area corresponds closely with the Anadarko basin and its shelf extensions, the Hugoton embayment and the Sedgwick basin. The overall salt basin covering two-thirds of Kansas, central Oklahoma, and part of the Texas Panhandle is oval shaped, bordered on the south by the Wichita uplift. Anhydrite beds increase in thickness and number southwestward across the map area at the expense of halite to the southern margin of the Anadarko basin in Oklahoma. Although thin magnesite beds are interstratified in the Hutchinson Salt, the carbonate facies tract does not become important except along the northern shelf of the Midland basin.
The net salt thickness of Hutchinson Salt conforms closely to the shape of the basin. However, younger layers, as previously mentioned, thicken and prograde basinward to the southwest, in part due to basin filling with shale to the north and east and an increasingly more proximal southerly restriction of the seaway (refer to cross sections). The location of the depocenter of the lower net salt unit in the extreme northeastern sector of the depression suggests that highest salinities were most distant from the source of seawater to the south. As the basin filled, the restriction of the basin increased and halite deposition migrated basin ward.
The eastern edge of the Hutchinson Salt in central Kansas is a dissolution front occurring at shallow depths <300 ft, 90 m). The front is expressed by a rapid decrease in thickness of salt from the top downwards (fig. 2). A lost circulation zone, numerous subsidence features, and brine seeps are associated with this solution edge as described by Walters (1978, 1980) and Gogel (1981).
The solution front extends from north to south for 90 mi (145 km) from near the city of Salina to just southwest of Wichita. South of this front the contours on the total net salt isopach map "open," and the structural contour map on top of the Hutchinson Salt again conforms to the adjacent mapped area (fig. 2).
The structural contour map on the top of the salt indicates a closed depression to the east of the solution front over the area in which the salt has been dissolved to only a small remnant layer at the base of the salt interval. As dissolution occurred, additional space was made available for new sediment. Thick Pliocene Equus beds and Recent Arkansas River sediment lie within this area where loss of sediment volume occurred by salt dissolution.
Although not identified by a zero contour, numerous areas between the zero salt line on the east and the solution front probably have zero salt in areas between control points. Furthermore, it is difficult to distinguish halite on petrophysical logs in this area because of the presence of gypsum and porous sandstones in the interval where halite may be present.
Salt distribution is decidedly very patchy in this area with further opportunity for minor solution and subsidence and contribution of dissolved ions to aquifer systems. The east-west cross sections D1-D4 and E1-E4 illustrate the solution front and the easterly depositional pinchout of salt into shale, respectively.
The contour lines of the total net salt isopach are rather irregular. What is mapped is a composite thickness of many individual layers of salt representing many cycles over a relatively large interval where shale and anhydrite layers interfinger with the salt and sometimes thicken quite dramatically at the expense of the salt. It was judged that the 40-ft contour interval is well within the precision of the log measurements used to obtain these data.
The contour map of the depth to the top of the Hutchinson Salt shows the measured depths taken from well logs. This map represents a combination of the earth's surface topography and the structural configuration of the upper surface of the salt interval. East-west trends of thinning represent major stream valleys at the earth's surface, such as the Saline and Smoky Hill rivers on the north end of the mapped area.
Figure 4--West-to-east stratigraphic cross section A1-A4 of Hutchinson Salt Member of Wellington Formation composed of gamma ray/neutron logs. Scale of logs are API units for gamma ray logs and counts per second and API units for neutron logs. Datum is on top of "Wellington Formation marker" above Hutchinson Salt. Stratigraphic markers include thin magnesite, anhydrite, and shale beds within Hutchinson Salt based on correlation of over 4,000 wells in central Kansas (Watney et al., 1988). The neutron in the boreholes encountered in the data base were usually washed out through the halite section. Consequently, the thicker drilling fluid section was recorded by the neutron log. As a result the anhydrite and carbonate in the interval usually were easily identified as beds with higher neutron count.
The eastern edge of the Hutchinson Salt in the vicinity of this cross section has undergone solution and is typified by an abrupt thinning of the halite into shale, "the lost circulation zone." The western margin of the section is situated along the basin margin of the salt and is typified by gradual thinning and eventually pinching out of the halite beds into shale. The upper halites pinchout farther into the basin than the underlying beds.
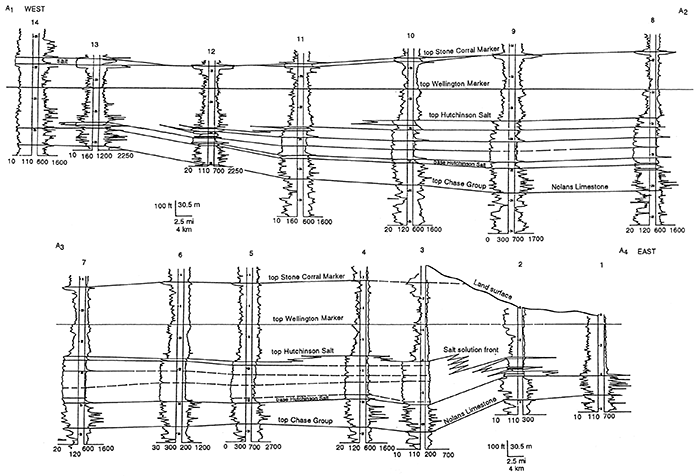
Figure 5--West-to-east stratigraphic cross section B1-B4 of Hutchinson Salt Member of Wellington Formation. Datum is on top of "Wellington Formation marker" above Hutchinson Salt. Western reaches of salt basin along this line of section (in southwestern Kansas) are characterized by an abrupt transition from halite into a thick succession of anhydrite. In contrast, halite along the eastern margin of the line of section undergoes gradual thinning and pinchout into shale with the upper halites pinching out further into the basin.
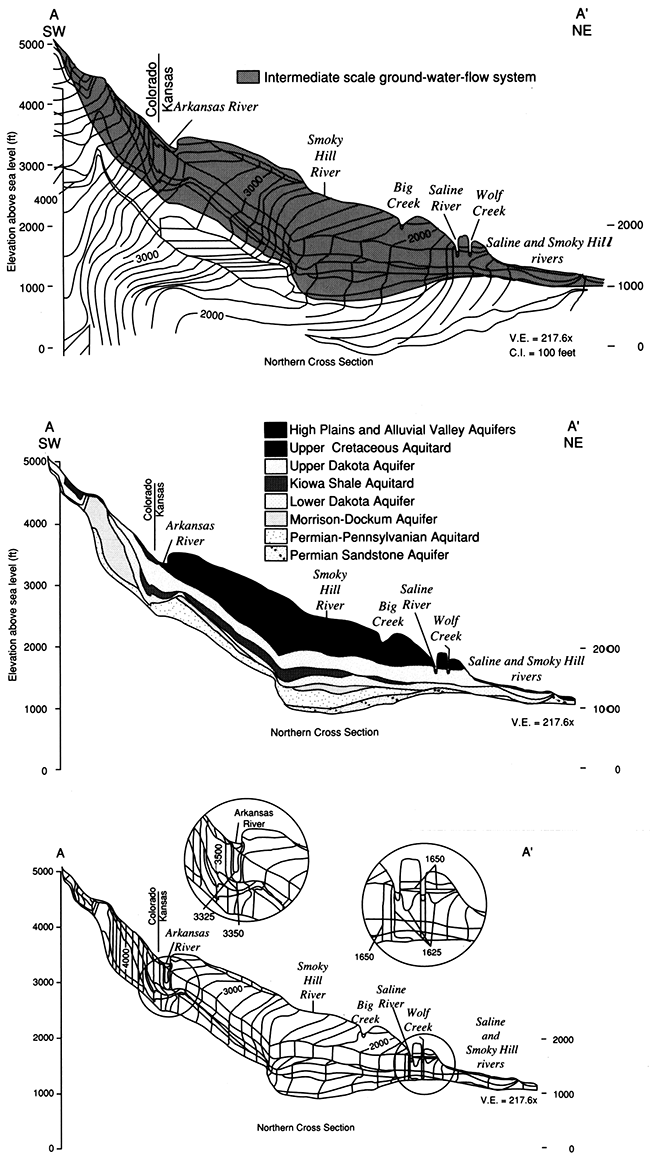
Examination of the salt-dissolution process in the context of the regional groundwater-flow system provides considerable insight into its natural and anthropogenically induced causes. Ground-water flow in the regional ground-water-flow system is northeastward from recharge areas in southwestern Kansas and southeastern Colorado to north-central Kansas (Macfarlane et al., 1992). Two primary flow paths that extend from the Sierra Grande uplift in southeastern Colorado into Kansas can be defined from the potentiometric surface map of the Dakota aquifer (fig. 6). One flow path parallels the outcrop and subcrop areas of the aquifer. The other flow path is northeastward through the confined portion of the Dakota aquifer and eastward into north-central Kansas. The regional flow system is recharged from precipitation moving downward to the water table. Most of the recharge to the regional flow system enters 1) in the upland areas of southeastern Colorado, through the upper Cretaceous aquitard; 2) in central Kansas, where it is thin and fractured; and 3) eastward of the Upper Cretaceous aquitard into unconfined aquifers. Elsewhere little recharge enters the system, especially where the Upper Cretaceous aquitard is thick (fig. 7). Belitz and Bredehoeft (1988) estimated that the Dakota aquifer receives 9.0 ft3/sec through the Upper Cretaceous aquitard in the Denver basin in eastern Colorado and western and central Kansas, and 29.2 ft3/sec in outcrop/subcrop areas in Kansas and southeastern Colorado. The principal discharge areas for the regional ground-water-flow system are in the Arkansas River valley in southeastern Colorado and extreme southwestern Kansas and many of the eastward-flowing river valleys in central Kansas. Belitz and Bredehoeft (1988) estimated the discharge from the Dakota aquifer to be 30.4 ft3/sec.
Figure 6--Ground-water-flow directions in the intermediate-scale system in southeastern Colorado and western Kansas superimposed on the potentiometric surface of the Dakota aquifer.
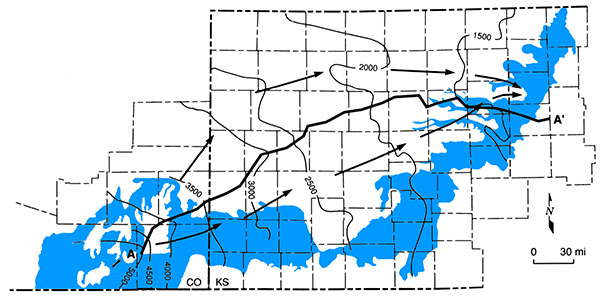
Figure 7--Vertical cross section of the shallow subsurface in southeastern Colorado and western and central Kansas showing the equipotentials of hydraulic head. Ground-waterflow direction is assumed to be from regions of higher to lower hydraulic head and normal to the orientation of the equipotentials. Vertical exaggeration--217.6x.
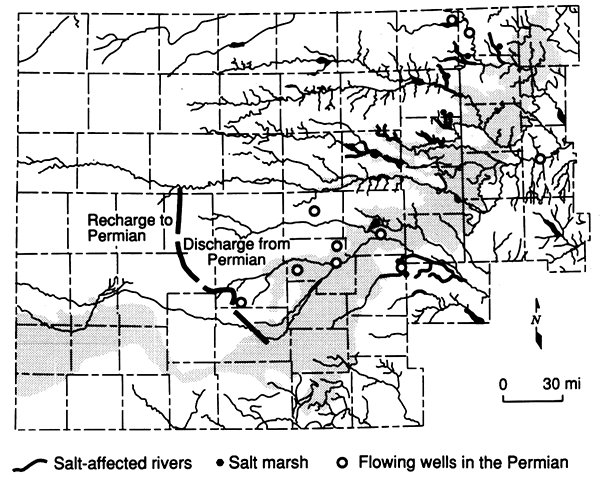
Salt-affected reaches of streams, salt marshes, and springs in topographically lower areas, and wells flowing saltwater, are a common occurrence in central Kansas (Hay, 1890,1891; Latta, 1949; Jordan et al., 1964; Hargadine et al., 1979; Gogel, 1981; Cobb, 1980; Gillespie and Hargadine, 1981; Sadeghipour et al., 1987; and Whittemore, 1984) (fig. 8). These occurrences of natural saltwater in shallow aquifers and surface waters and the geomorphic and structural effects are directly related to the movement of ground water in steady-state regional, intermediate, and local flow systems. Discharge areas of these systems are located primarily in stream valleys and are characterized by increases in hydraulic head and dissolved-solids concentration with depth below the water table. The increase of hydraulic head with depth causes cross-formational flows of more saline ground waters upward between aquifers. As a result, flowing wells that produce saltwater and other natural salt-related features are common (Toth, 1972, 1984; Kreitler et al., 1985). The occurrence of these hydrologic features suggest that: 1) central Kansas is included in the natural discharge area of the Permian aquifers that underlie much of western Kansas; 2) the Dakota aquifer is acting as a drain conducting saltwater from the Permian to the river valleys in parts of central Kansas; and 3) local flow systems conduct halite-solution brines from the Permian to overlying aquifers and surface waters. The local ground-water-flow systems are actively involved in the salt-dissolution process (Gogel, 1981; Johnson, 1976). Locally developed relief due to Cenozoic stream-valley erosion in these discharge areas creates local flow systems that help focus ground-water discharge into the valleys. Simultaneously freshwater recharge is added to the ground-water system, which is capable of dissolving bedded salts where present in the shallow subsurface.
Figure 8--Map showing the occurrence of salt marshes, flowing wells, and areas of saltwater intrusion into streams all from natural sources in central Kansas.
There are two main types of salt-dissolution areas in Kansas: natural solution along the subcrop of salt beds, and new or aggravated solution caused by entrance of water into salt beds via artificial penetrations. Natural solution occurs in a broad zone across the central part of the state and adversely affects ground- and surface-water quality as non-point source pollution as well as causing subsidence. Modern and ancient sinkhole development and faulting from natural causes in southwest and central parts of the state provide evidence that near-surface processes have been, and continue to be, active throughout the Cenozoic along the updip edge of the Hutchinson Salt and other evaporite-bearing strata (Frye, 1950). The front of the most active natural solution occurs along the subcrop of the Hutchinson Salt Member of the Permian Wellington Formation and extends from Dickinson County south to Sumner County. A second front exists in south-central Kansas along the edge of subcropping Ninnescah Shale. Saltwater contamination of ground and surface waters and generally slow subsidence development accompany the salt dissolution. The second type is more local and is associated with oil and gas boreholes or salt mining (Walters, 1978). Sinkhole formation resulting from a natural process of salt solution was first identified with the development of the Meade Sink, southwest Kansas, in 1879. Collapse due to solution resulting from anthropogenic activities was observed at Wichita in 1914 (Walters, 1978). The area of the greatest problems of salt dissolution related to anthropogenic activities occurs in a broad band west of the subcrop of the Wellington Formation from central to south-central Kansas. Subsidence over cavities formed in the salt are most rapid where a substantial thickness of unconsolidated surface deposits is present. Sink development associated with oil and gas activities has generally occurred where saltwater-disposal wells have allowed either disposed brine or aquifer water to flow across the salt section and produce a denser brine that flows to the disposal zone, usually the Arbuckle Group (Walters, 1978). In the last five decades, the Kansas Geological Survey has been involved in local investigations of sinkholes and other subsidence features from natural and anthropogenic causes in many parts of central Kansas. The local geology and site hydrology of many of these features are described in several Kansas Geological Survey publications, in particular Walters (1978). Most of the recent occurrences of subsidence and collapse have resulted from anthropogenic causes.
In fig. 9, a suite of two one-dimensional synthetic seismograms for the sec. 2, T. 30 S., R. 25 W. well are presented. These seismograms were generated by convolving an edited version (the density log was clipped) of the reflection coefficient wavetrain (650-3,000-ft interval; 198.2-914.6-m interval) with the following zero-phase, Ricker wavelets of varying polarity and/or wavelength: 1) 30 msec, zero-phase, normal-polarity; 2) 30 msec, zero-phase, reverse-polarity; 3) 5 msec, zero-phase; normal-polarity; and 4) 5 msec, zero-phase, reverse-polarity. The 30-msec Ricker wavelet synthetic seismograms are presented as reasonable representations of conventional-resolution (26 Hz) CDP-stacked seismic data. The 5-msec Ricker wavelet synthetic seismograms, in contrast, are presented as reasonable representations of high-resolution (156 Hz) stacked (CDP) seismic data. As illustrated in fig. 9, the normal- and reverse-polarity displays are mirror images; troughs on the normal-polarity seismogram correlate to peaks on the reverse-polarity display. Definitions for these terms may be found in Anderson et al. (1993a, b) and Sheriff (1981).
Figure 9--Velocity curve, edited density curve (minimum density of rock salt set at 2.2 g/cc), gamma ray curve, acoustic-impedance curve (product of seismic velocity and density), reflection-coefficient curve (acoustic-impedance contrast) and two synthetic seismograms for the sec. 2, T. 30 S., R. 25 W. well (Minneola field, Clark County). The synthetic seismograms were generated by convolving the reflection-coefficient curve with zero-phase 30-msec Ricker wavelets of normal- and reverse-polarity, respectively. By SEG convention, positive acoustic-impedance contrasts (higher values with increasing depth) generate peaks (deflections to the right); the "arrival time" of a zero-phase wavelet is measured at the apex of the respective trough or peak. Such one-dimensional synthetic seismograms are generally used to correlate field seismic data to the subsurface geology.
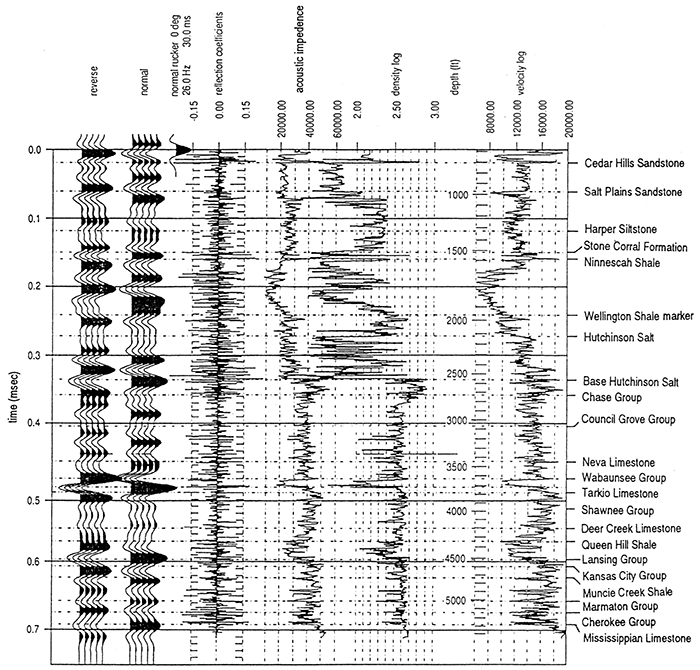
The top and base of the Hutchinson Salt Member on the 30-msec wavelet, normal-polarity, synthetic seismograms (figs. 9 and 10) are represented (more-or-less) by moderate-amplitude peaks. As evidenced by these synthetic seismograms, from a reflection-seismic perspective, rock salt is enigmatic; although halite has a relatively high seismic velocity (4,200 m/sec), it has a low density (2,200 kg/m3). (Typically, dense rocks have relatively high seismic velocities, and less dense rocks have lower seismic velocities.) The seismic image of the undeformed Hutchinson Salt can therefore be difficult to discriminate on conventional seismic data. The top of the rock salt, in particular, can be difficult to image; the Hutchinson Salt is overlain by denser shales of lower seismic velocity. Note that the synthetic seismic image of the Hutchinson Salt would be very different if only the velocity curve was used to calculate the reflection coefficient wavetrain.
Figure 10--Velocity curve, unedited density curve, gamma ray curve, acoustic-impedance curve, reflection coefficient curve, and two synthetic seismograms for the sec. 2, T. 30 S., R. 25 W. well (Minneola fieid, Clark County; 650-5,400-ft interval; 198.2-1,646.3-m interval). The synthetic seismograms were generated by convolving the reflection-coefficient curve with zero-phase, 5-msec Ricker wavelets of normal- and reverse-polarity respectively. As a result of caving and leaching, the densities of the rock salt and shallow shale intervals are anomalously low (less than 2.0 g/cc in places). A comparison of the synthetic seismograms of figs. 9 and 10 illustrates that such uncorrected and inaccurate readings significantly affect the synthetic seismic signature of the well-log suite. If the validity of the velocity-log readings have been similarly compromised, the unedited synthetic seismogram will not time-tie the processed seismic section.
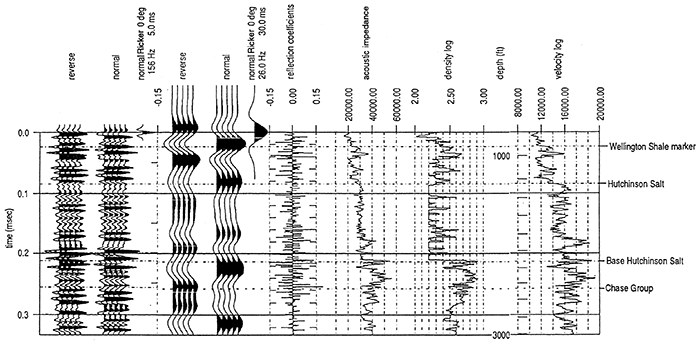
The synthetic seismograms utilizing the 5-msec wavelet (fig. 10) were generated in order to model the seismic response of the Hutchinson Salt on high-resolution stacked (CDP) seismic data. Such data typically utilize frequencies on the order of 100-200 Hz. As illustrated by the synthetic seismogram (5-msec wavelet, normal-polarity), the top of the undeformed rock salt correlates to a low-amplitude peak; the base to a relatively high-amplitude peak. The Hutchinson Salt, between the top and base, is characterized by a series of relatively low-amplitude events, the product of interlayered halites, sulfates, and carbonates of variable acoustic impedance and thickness. Overall, the synthetic seismogram suggests that the seismic image of undeformed Hutchinson Salt can be readily discriminated on high-resolution seismic data. It should be noted that high-resolution sources have limited depth penetration, and that high-frequency input signal is rapidly attenuated with depth. As a result, the vertical resolution at depth (as suggested by the synthetic seismograms) might not be realized using current high-resolution seismic techniques.
In fig. 10, two one-dimensional synthetic seismograms for the sec. 2, T. 30 S., R. 25 W. well are presented. These seismograms were generated by convolving the unedited reflection coefficient wavetrain (650-5,400-ft interval; 198.2-1,646.3-m interval) with 30-msec, zero-phase Ricker wavelets of normal-and reverse-polarity, respectively. A comparison of figs. 9 and 10 shows the value of the judicious editing of sonic and density curves. The synthetic seismic images qf the Hutchinson Salt on the edited and unedited seismograms are significantly different.
In fig. 11, a geologic cross section of a simplified salt-dissolution feature and corresponding two-dimensional, synthetic seismograms are presented. The seismograms were generated from the geologic cross section using 30-msec, zero-phase, normal-polarity Ricker wavelet, and vertical incidence and diffraction modeling techniques, respectively. The vertical incidence synthetic seismogram is somewhat analogous to ideally migrated stacked field seismic data; the diffraction synthetic seismogram, in contrast, is somewhat representative of non-migrated data. These synthetics illustrate several key components of the seismic signature of sinkholes.
Figure 11--Geologic cross section of a simplified salt-dissolution feature and corresponding two-dimensional synthetic seismograms. The seismograms were generated from the geologic cross section, using 30-msec, zero-phase, normal-polarity Ricker wavelet, and vertical incidence and diffraction modeling techniques, respectively.
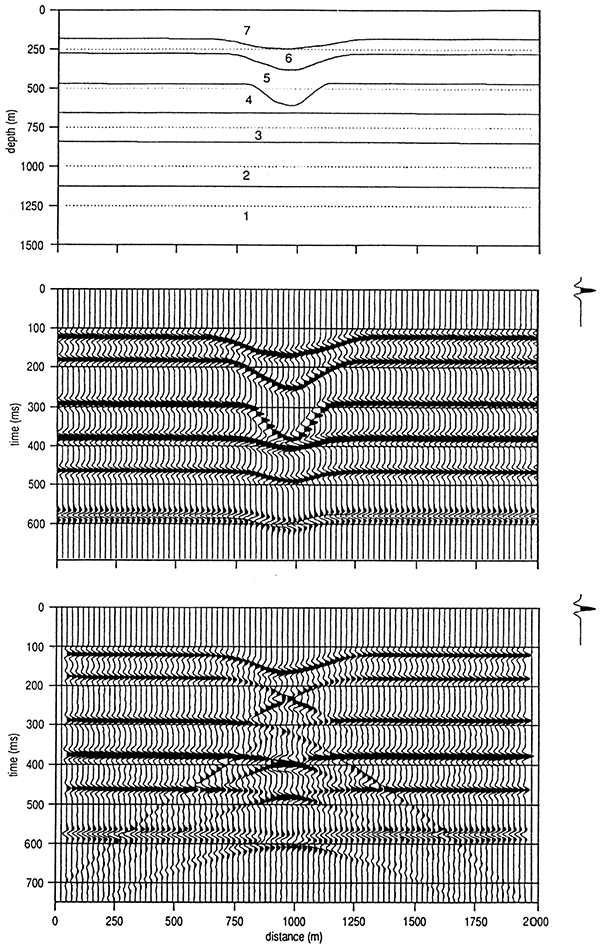
As illustrated on the vertical incidence synthetic seismogram, each of the geologic horizons is represented by a reflection, the amplitude and phase of which is a function of the acoustic-impedance contrast across the respective horizon. Horizon 3/2 for example is manifested as a high-amplitude peak; the two-way travel time to the apex of the peak (at a specific trace) is equal to the depth to the horizon (at that trace location) divided by the average velocity to horizon 3/2 at that location.
As illustrated by the geologic cross section, the thicknesses of the post-salt layers vary in the vicinity of the sinkhole; as a result, the average seismic velocities to each of the horizons also vary. It is this lateral variation in average seismic velocity that creates the anomalous time-structural relief observed most readily on events 2/1, 3/2, and 4/3. These events are "pushed down" beneath the sinkhole, even though the corresponding horizons are seen to be more-or-less flat on the geologic cross section. (Note: if the average seismic velocity of the compensation sediment at the sinkhole site were higher than that of the dissolved rock salt, the underlying events would be "pulled up.")
Such velocity-generated, time-structural relief is typically associated with zones of salt dissolution. It is imperative that the interpreter differentiate velocity "pull-up" or "push-down" effects from those introduced by real subsurface structural relief. In the case of our model, it would be unfortunate if a well were drilled to the left of the time-structural anomaly along event 2/1, with the expectation of testing a closed structure along the corresponding horizon.
The diffraction synthetic seismogram in fig. 11 is analogous to non-migrated seismic data. These data differ from the vertical-incidence seismogram in that dipping surfaces are shifted in time and space; anticlinal structures are broadened and synclinal features are collapsed. In addition, diffractions originating from discontinuities within the geologic section are superposed on the primary events. Such diffractions can mask the seismic signature of pre-salt geologic targets. Fortunately, however, the masking effect of diffractions can be minimized by migration techniques; a process which (ideally) also shifts dipping events into their proper position in time and space. Ideally, migration would transform the diffraction seismogram into the vertical-incidence seismogram.
It should also be noted that the seismic image of the Hutchinson Salt is a function of both depth of burial and extent of deformation (dissolution). The interpreter must consider that the density and seismic velocity of subsurface rock salt is relatively constant, whereas the acoustic impedances of shales, clastics, and carbonates increase appreciably with depth of burial. As a result, the magnitudes of the reflections from the top and base of the Hutchinson Salt are depth dependent. In those areas where the Hutchinson Salt has been deformed, the character of the reflection can also vary significantly. For example, at one site the relative amplitude of the reflection from the top of the salt can be increased as a result of the fracturing of the overlying sediment. At another location, this reflection can be effectively masked by diffractions associated with dissolution and subsidence.
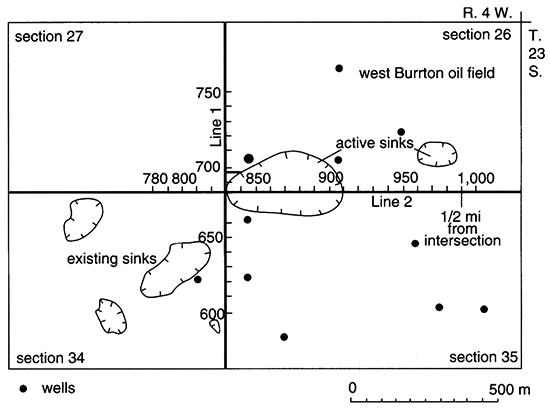
The county road east of Punkin Center in Reno County was closed due to a gradual yet persistent subsidence of an area of approximately 12 acres (5 hm2). It is 5.6 km (3.5 mi) west of Burrton in the Burrton oil field. Since the original construction of the county road, approximately 3 m (10 ft) of vertical displacement has occurred (fig. 12). To ascertain the likely fate of the road, the Kansas Geological Survey was contracted by Reno County to do a seismic-reflection survey between August 8 and August 10, 1983 (Steeples et al., 1984). Two profiles were run intersecting at 90° on the western boundary of the surface depression (fig. 12). Profile 1 runs north-south and profile 2 runs eastwest just south of the center of the sink. Over the sink, road-shoulder conditions were poor and geophone plants and source operations were hampered. This resulted in a reduction in the signal-to-noise ratio from CDP 845 to CDP 904 on line 2 (Steeples et al., 1984).
Figure 12--Location map for Punkin Center site, Reno County. Sinkhole sites and the locations of the seismic profiles are superposed.
Regional geologic control indicates that in the vicinity of Punkin Center the shallow subsurface is composed of undifferentiated Pleistocene fluvial clastics (typical 40-60 m; 131-197 ft thick). The pre-Pleistocene subcrop is the Lower Permian-age Ninnescah Shale (Sumner Group), or in places of more extensive erosion, the underlying Wellington Formation. The Pleistocene strata are interpreted as fluvial in origin. They are reported to have been deposited within a north-south-trending valley carved by deeply incised river channels, the courses of which were at least locally controlled by the contemporaneous or earlier dissolution of the underlying Hutchinson Salt Member, Wellington Formation (Gogel, 1981).
Drillers logs from nearby wells indicate a high degree of variability in the thickness of the Hutchinson Salt at the Reno County site. This variability is not surprising since these salts have been totally leached at well sites just a few kilometers to the south and east. Indeed, the main salt-dissolution front (fig. 1) is generally mapped several kilometers to the east of the Punkin Center site (Gogel, 1981; Watney, 1980). The main dissolutional edge of the Hutchinson Salt in the vicinity of Punkin Center is more-or-less coincident with the southern extension of Yo shell Ridge (Lam and Yarger, 1989).
A reverse-polarity display of seismic profile 1 is presented as fig. 13. (Increases in acoustic-impedance contrast are represented as troughs.) Several key seismic events have been correlated across these data. Unfortunately, since driller's logs in the area are old and not very reliable, and seismic velocity is not constrained by sonic logs or uphole tests, the seismic reflections cannot be directly correlated to specific geologic horizons. The correlations shown on the seismic section are therefore somewhat tentative. However, these interpretations are consistent with available geologic control and the accepted processes of salt dissolution. Layer C is interpreted to be the pre-Pleistocene subcrop; layers A and B, and D and E are thought to be seismically correlatable Permian and Pleistocene horizons, respectively.
Figure 13--Interpreted reverse-polarity display of seismic profile 1.
Reflections thought to originate from the top (T) and base (B) of the Hutchinson Salt Member are labeled (fig. 13). This interpretation implies that the seisrnic line crosses two zones where the rock salts have been leached from the geologic record; elsewhere up to 40 m (20 msec) of rock salt are preserved. Note that the top of the Hutchinson Salt is manifested as a relatively high-amplitude event, probably as a result of the fracturing of the overlying strata.
The post-salt Permian events A and B effectively parallel the top salt event where present (and the base salt reflection elsewhere), supporting the thesis of post-depositional dissolution and implying that the leaching in the study area occurred after these strata had been deposited. Events C, D, and E in contrast are not time-structurally parallel to the top of the salt. The significance of this lack of parallelism can be demonstrated by an analysis of isochron values.
Consider first the isochron values A/C (two-way travel time between events A and C). (Recall that event C is interpreted to be the pre-Pleistocene Permian subcrop; event A is an underlying Permian horizon.) The A/C isochron values vary by up to 8 msec (12 m more-or-less) across the seismic section. The largest isochron values are observed within the distance interval 540-750 (where the rock salt is thin to absent) suggesting that a significant volume of the Hutchinson Salt was dissolved at this site prior to the onset of Pleistocene sedimentation. This interpretation is consistent with the thesis that the Pleistocene strata were deposited within deeply incised river channels, the courses of which were at least locally controlled by the contemporaneous or earlier dissolution of the underlying Hutchinson Salt. Alternatively, the observed variations in the A/C isochron values could be erosional in origin. The above-noted correlation between the A/C isochron values and the thickness of the remnant salt suggests that this alternative interpretation is less plausible.
The D/E isochron values also vary appreciably across the seismic line being about 30 msec greater within the distance interval 50-150 than across the thick remnant rock salt. This observation suggests that a significant volume of salt was dissolved within this distance after the deposition of horizon D and prior to the deposition of Unit E. Alternatively, Event D could represent the base of a deeply scoured channel.
These interpretations suggest that dissolution of the Hutchinson Salt occurred in the Punkin Center area during the Pleistocene and support the thesis that drainage patterns at that time were at least locally controlled by the contemporaneous leaching of the Permian salts. While surface observations and these seismic data indicate that the dissolution of the Hutchinson Salt is occurring and has occurred at various times in the geologic past, the lack of subsurface velocity control precludes the exact determination of the timing of the paleo-leaching. More specifically, without additional subsurface velocity control (e.g., sonic or check shot data), the interpreted ages of horizons A-E cannot be confirmed.
These seismic data not only provide information regarding the timing of the salt dissolution, they also give us insight into the process of leaching. Note for example, the interpreted curved displacement planes near the edges of the remnant rock salt. These fault planes suggest that leaching was initiated near the centers of the zones of the most extensive dissolution. (Very possibly, the earliest phases of dissolution were initiated along fractures associated with the ancestral Voshell Ridge.) In terms of particularly significant processes, the response of the adjacent sediment to the onset of dissolution appears to have been two-fold: 1) the remnant rock salt flowed (creep mechanisms) towards the zone of lower pressure, and 2) the overburden subsided into the developing voids and into those areas vacated by the creep of rock salt. The fracture planes which developed during the course of subsidence probably acted as conduits for inflowing freshwater and/or outflowing saline brines, and allowed for the gradual lateral migration of the salt-dissolution front. Note that the fault planes demarcate an upwards-expanding zone of measurable subsidence, a feature characteristic of gradual subsidence.
With respect to the hypothesis regarding the initiation of salt dissolution, it should be noted that there is no conclusive seismic evidence of vertical displacement along the pre-salt events. The time-structural relief present along these reflections is perhaps most readily attributed to velocity effects (due to the velocity contrast between the relatively high-velocity remnant rock salt and the lower-velocity compensation sediments). The noticeable loss in the coherency of the pre-salt events immediately beneath the central remnant rock salt is interpreted as a product of scattering and attenuation within a zone of current salt dissolution. (The surface is subsiding immediately to the east of this remnant body of rock salt; fig. 13.)
As evidenced by the seismic data, the top of the Hutchinson Salt and the post-salt (above approximately 200 msec) have been structurally deformed by the dissolution of the Hutchinson Salt and collapse of the overburden. Perhaps the most important observation that can be made from the analysis of the seismic data and surface observations is that at least three major episodes of sinkhole development have occurred. The most recent episode is still continuing. The earlier episodes, however, predate the deposition of the base of the upper geologic layer (Pleistocene age Event E) correlated across the seismic section. This interpretation suggests that the hydraulic conditions necessary for dissolution of rock salt were present before any petroleum-exploration drilling occurred. The occurrence of paleo-sinkholes and a modern active adjacent sinkhole signifies that salt-dissolution sinkholes in Kansas can occur either naturally or as a result of inducement by drilling or mining.
Salt dissolution of both natural and anthropogenic origin has occurred and is still occurring in Kansas. Such leaching degrades the utility of the seismic technique and increases the potential for the misinterpretation of these geophysical data. As evidenced by the Punkin Sink: seismic data, zones of extensive salt dissolution (including remnant salt and collapse structures) are characterized by diffractions and velocity-generated time-structural relief. The diffractions degrade the quality of the primary events; the apparent time-structural relief makes data processing more difficult and provides the opportunity for misinterpretations.
On a more positive note, the Punkin Sink data illustrate the utility of the seismic technique in terms of the elucidation of the processes and geological effects of leaching. The example data clearly demonstrate that dissolution of natural origin occurred in Kansas (at least during the Pleistocene). Surface observations indicate that subsidence (and presumably dissolution) is still occurring in the study area. These seismic data also suggest that the remnant rock salt creeps toward the zones of dissolution and that the zone of subsidence increases in areal extent at shallower depths.
Belitz, K., and Bredehoeft, J. D., 1988, Hydrodynamics of the Denver basin-explanation of subnormal fluid pressures: American Association of Petroleum Geologists, Bulletin, v. 72, p. 1,334-1,359
Cobb, P. M., 1980, The distribution and mechanisms of saltwater intrusion in the freshwater aquifer and in Rattlesnake Creek, Stafford County, Kansas: M.S. thesis, University of Kansas, Lawrence, 176 p.
Dellwig, L. F., 1963, Environment and mechanics of deposition of the Permian Hutchinson Salt Member of the Wellington Shale; in, Symposium on Salt: Northern Ohio Geological Society, Cleveland, p. 74-85
Frye, J. C., 1950, Origin of Kansas Great Plains depressions: Kansas Geological Survey, Bulletin 86, pt. 1 , p. 1-20 [available online]
Gillespie, J. B., and Hargadine, G. D., 1981, Saline ground-water discharge to the Smoky Hill River between Salina and Abilene, central Kansas: U.S. Geological Survey, Water Resources Investigations 81-43, 72 p. [available online]
Gogel, T., 1981, Discharge of saltwater from Permian rocks to major stream-aquifer systems in central Kansas: Kansas Geological Survey, Chemical Quality Series 9, 60 p. [available online]
Hargadine, G. D., Balsters, R. G., and Luehiring, J., 1979, Mineral intrusion in Kansas surface waters-a technical report: Kansas Department of Health and Environment, Water Quality Management Section, 211 p.
Hay, R., 1890, Notes on some Kansas salt marshes: Transactions of the Twenty-second Meeting of the Kansas Academy of Science, 1889, p. 97-100
Hay, R., 1891, Geology of Kansas salt: Seventh Biennial Report of the Kansas Board of Agriculture, p. 83-92
Johnson, K. S., 1976, Evaluation of Permian salt deposits in the Texas Panhandle and western Oklahoma for underground storage of radioactive wastes--Final report submitted to Union Carbide: Oak Ridge National Laboratories, 70 p.
Jordan, P. R., Jones, B. F., and Petri, L. R., 1964, Chemical quality of surface waters and sedimentation in the Saline River basin, Kansas: U.S. Geological Survey, Water-Supply Paper 1651, 90 p. [available online]
Kreitler, C. w., Fisher, R. S., Senger, R. K., Hovorka, S. D., and Dutton, A. R., 1985, Hydrology of an evaporite aquitard: Proceedings of the 17th International Congress of International Association of Hydrogeologists on the Hydrogeology of Rocks of Low Permeability, Tucson, Arizona, v. 17, p. 150-168
Lam, C. K., and Yarger, H., 1989, State gravity map of Kansas; in, Geophysics in Kansas, D. W. Steeples, ed.: Kansas Geological Survey, Bulletin 226, p. 185-196 [available online]
Latta, B. F., 1949, Ground-water conditions in the Smoky Hill valley in Saline, Dickinson, and Geary counties, Kansas: Kansas Geological Survey, Bulletin 84, 152 p. [available online]
Macfarlane, P. A., Whittemore, D.O., Chu, Tyan-Ming, Butler, J. J., Jr., Wade, A., Coleman, J., Doveton, J. H., Mitchell, J. E., and Kay, S., 1992, The Dakota Aquifer Program--annual report, FY91: Kansas Geological Survey, Open-file Report 92-1, 93 p. [available online]
Norton, G. H., 1939, Permian red beds of Kansas: American Association of Petroleum Geologists, Bulletin, v. 23, p. 1,751-1,859
Rascoe, B., Jr., 1968, Permian System of western midcontinent: The Mountain Geologist, v. 5, p. 127-138
Sadeghipour, J., Macfarlane, P. A., McElwee, C. D., and Kemblowski, M. W., 1987, Saltwater intrusion into alluvial aquifers--an evaluation of field methods and ground-water modeling techniques: Kansas Geological Survey, Open-file Report 87-6, 208 p.
Sheriff, R. E., 1981, Encyclopedic dictionary of exploration geophysics, 3rd ed.: Tulsa, Oklahoma, Society of Exploration Geophysicists, 376 p.
Steeples, D. W., Knapp, R. W., and Miller, R. D., 1984, Examination of sinkholes by reflection seismology; in, Sinkholes--Their Geology, Engineering and Environmental Impact, B. F. Beck, ed.: Proceedings of the First Multidisciplinary Conference on Sinkholes, Orlando, Florida, 15-i7 October, p. 217-223
Toth, J., 1972, Properties and manifestations of regional ground-water movement: Proceedings of the 24th International Geological Congress, Montreal, Section 11, p. 153-163
Toth, J., 1984, The role of regional gravity flow in the chemical and thermal evolution of ground water: Proceedings of the First Canadian/America Conference on Hydrogeology--Practical Applications of Ground Water Geochemistry, Banff, Alberta, Canada, National Water Well Association, Dublin, Ohio, p. 3-39
Walters, R. F., 1978, Land subsidence in central Kansas related to salt dissolution: Kansas Geological Survey, Bulletin 214, p. 1-32 [available online]
Walters, R. F., 1980, Solution and collapse features in the salt near Hutchinson, Kansas: South-central Section, Geological Society of America, Field Trip Notes, 10 p.
Watney, W. L., 1980, Maps and cross sections of the lower Permian Hutchinson Salt in Kansas: Kansas Geological Survey, Open-file Report 80-7, 10 p.
Watney, W. L., Berg, J. A., and Paul, S., 1988, Origin and distribution of the Hutchinson Salt (lower Leonardian) in Kansas; in, Permian Rocks of the Midcontinent, W. A. Morgan and J. A. Babcock, eds.: Midcontinent Society of Economic and Paleontologic Mineralogists, Special Publication No. 1, p. 113-135
Whittemore, D.O., 1984, Geochemical identification of salinity sources; in, Salinity in Watercourses and Reservoirs, R. H. French, ed.: Proceedings of the International Conference on State-of-the-Art Control of Salinity, Ann Arbor Science, Butterworth Publishers, Stoneham, MA, p. 505-514
Previous--Seismic Response of Pennsylvanian Cyclothems || Next--Plastic Deformation and Dissolution of the Hutchinson Salt Member in Kansas
Kansas Geological Survey
Comments to webadmin@kgs.ku.edu
Web version placed online Aug. 26, 2015. Original publication date 1995.
URL=http://www.kgs.ku.edu/Publications/Bulletins/237/Anderson2/index.html