Prev Page--Emission Spectroscopy || Next Page--Statistical Analysis
Electron Spin Resonance Studies
Introduction
Conventional microscopic techniques are known to be generally inappropriate for the study and classification of shales because their constituent particles are smaller than the resolving power of an optical microscope. As a result, instrumental techniques such as X-ray diffraction and emission spectroscopy were employed to determine the mineralogical and geochemical composition of the Upper Pennsylvanian and Lower Permian shales and to classify samples on the basis of such analyses. However, questions concerning the environment of deposition of some shales have been raised by geochemical variables such as Mn and Sr. This section is an attempt to clarify these inconsistencies and to verify the conclusions drawn about the geochemistry of the shales.
The geochemical distributions of Mn and Sr in Upper Pennsylvanian and Lower Permian shales indicate apparently contradictory sedimentary conditions in the Kansas City and Wabaunsee Groups. The evidence for this conclusion rests on differences in the geochemical situation of each element. Mn, for example, may occur in association with carbonates or clay minerals. However, it is possible using a spectroscopic technique known as electron spin resonance (ESR) to differentiate the structural settings of ions such as Mn2+ and clarify the environmental problem. The shale spectra generated for this study can serve a second function, to provide supplementary evidence on the geochemical and mineralogical classifications developed previously.
ESR is relatively unknown in the geological sciences even though it has been applied in the fields of determinative mineralogy (Marfunin, 1964), lunar mineralogy and petrology (Weeks, 1972, 1973), terrestrial silicates and carbonates (Ghose, 1968; Wildeman, 1970), crystallographic analysis (Low, 1968), and geological age dating (Morency et al., 1970). A detailed list of applications is presented by Cubitt (1975b) and a brief theoretical description is expounded in Whiff en (1968), Browning (1969), and Cubitt and Wilkinson (1976).
Although primarily a chemical technique for the study of paramagnetic ions in crystals, ESR is used as an instrumental tool in geology for the detection of certain ionic species in minerals and rocks and for analyzing the structural position these ions occupy within minerals. It is particularly applicable to ions in the transition group (3dn), the palladium group (4dn), the platinum group (5dn), the rare earth group (4fn), and the actinides group (5fn). In comparison with other instrumental techniques, it is inaccurate (20 percent optimum precision) as a quantitative technique but is exceptionally sensitive as a qualitative technique (10-5 to 10-12 moles). ESR also possesses three other important characteristics: less than 0.5 gm of the sample (solid, liquid, or powder) is required for analysis, the technique is non-destructive, and sample analysis can be completed within 30 minutes. Consequently, as ESR has no functional equivalent in the instrumental techniques currently employed in the analysis of shales, the simplicity and speed of analysis suggest that the technique may be a useful supplement to standard procedures.
Procedure and Results
Fifty-two finely powdered (less than 60 microns) shale samples from the Upper Pennsylvanian and Lower Permian of eastern Kansas were studied at room temperature on a Varian E-3 X-band spectrometer. Samples were placed in borate glass tubes, positioned in the sample chamber, and analyzed by the procedure described above. The samples were chosen to represent the geochemical and mineralogical range of the shales examined by X-ray diffraction and emission spectroscopy. A list of samples analyzed can be found in Table 13 and their stratigraphic positions are presented in Appendix 3.
Table 13--Coded values of spectral characteristics based on presence or absence of a character and the intensity of that character relative to other characters.
| Sample | Variable | Remarks | |||||||||||||||
|---|---|---|---|---|---|---|---|---|---|---|---|---|---|---|---|---|---|
| 1 | 2 | 3 | 4 | 5 | 6 | 7 | 8 | 9 | 10 | 11 | 12 | 13 | 14 | 15 | 16 | ||
| 213 | 1 | 1 | 0 | 0 | 0 | 0 | 1 | 0 | 1 | 0 | 1 | 0 | 1 | 1 | 1 | 0 | |
| 290 | 0 | 0 | 0 | 0 | 0 | 0 | 1 | 0 | 1 | 0 | 1 | 0 | 0 | 0 | 1 | 1 | |
| 94 | 0 | 0 | 1 | 1 | 0 | 0 | 0 | 0 | 1 | 0 | 1 | 0 | 1 | 1 | 1 | 0 | |
| 36 | 0 | 0 | 1 | 1 | 0 | 0 | 0 | 0 | 1 | 0 | 1 | 0 | 1 | 1 | 1 | 0 | |
| 500 | 1 | 1 | 0 | 0 | 0 | 0 | 0 | 0 | 0 | 0 | 0 | 0 | 0 | 0 | 0 | 0 | Pure calcite included as a standard |
| 135 | 0 | 0 | 1 | 1 | 0 | 0 | 1 | 0 | 1 | 0 | 1 | 0 | 1 | 1 | 1 | 0 | |
| 105 | 0 | 0 | 1 | 1 | 0 | 0 | 0 | 0 | 1 | 0 | 1 | 0 | 1 | 1 | 1 | 0 | |
| 208 | 0 | 0 | 1 | 1 | 0 | 0 | 1 | 0 | 1 | 0 | 1 | 0 | 1 | 1 | 1 | 0 | |
| 109 | 0 | 0 | 1 | 1 | 0 | 0 | 1 | 0 | 1 | 0 | 1 | 0 | 1 | 1 | 1 | 0 | |
| 272 | 1 | 0 | 0 | 0 | 0 | 0 | 1 | 0 | 1 | 0 | 1 | 1 | 1 | 0 | 1 | 0 | |
| 69 | 0 | 0 | 1 | 0 | 0 | 0 | 0 | 0 | 1 | 0 | 1 | 1 | 1 | 0 | 1 | 0 | |
| 209 | 0 | 0 | 1 | 1 | 0 | 0 | 0 | 0 | 1 | 0 | 1 | 0 | 1 | 1 | 1 | 0 | |
| 163 | 0 | 0 | 1 | 1 | 0 | 0 | 1 | 0 | 1 | 0 | 1 | 0 | 1 | 0 | 1 | 1 | |
| 161 | 0 | 0 | 0 | 0 | 0 | 0 | 1 | 0 | 1 | 0 | 1 | 0 | 0 | 0 | 1 | 1 | |
| 186 | 0 | 0 | 1 | 1 | 0 | 0 | 1 | 1 | 1 | 0 | 1 | 0 | 1 | 1 | 1 | 0 | |
| 81 | 0 | 0 | 0 | 0 | 0 | 0 | 1 | 0 | 1 | 0 | 1 | 0 | 0 | 0 | 1 | 1 | |
| 262 | 0 | 0 | 1 | 1 | 0 | 0 | 0 | 0 | 1 | 0 | 1 | 0 | 1 | 1 | 1 | 0 | |
| 173 | 0 | 0 | 0 | 0 | 0 | 0 | 1 | 0 | 1 | 0 | 1 | 0 | 0 | 0 | 1 | 1 | |
| 244 | 0 | 0 | 0 | 0 | 0 | 0 | 1 | 0 | 1 | 0 | 1 | 0 | 0 | 0 | 1 | 1 | |
| 235 | 1 | 1 | 0 | 0 | 0 | 0 | 1 | 0 | 1 | 0 | 1 | 0 | 1 | 1 | 1 | 0 | |
| 243 | 1 | 1 | 0 | 0 | 0 | 0 | 1 | 0 | 1 | 0 | 1 | 0 | 1 | 1 | 1 | 0 | |
| 125 | 0 | 0 | 0 | 0 | 0 | 0 | 1 | 0 | 1 | 0 | 1 | 0 | 0 | 0 | 1 | 0 | |
| 16 | 0 | 0 | 0 | 0 | 0 | 0 | 1 | 0 | 1 | 0 | 1 | 1 | 1 | 0 | 1 | 0 | |
| 82 | 0 | 0 | 1 | 0 | 0 | 0 | 1 | 0 | 1 | 0 | 1 | 0 | 1 | 0 | 1 | 0 | |
| 110 | 0 | 0 | 1 | 1 | 0 | 0 | 1 | 0 | 1 | 0 | 1 | 0 | 1 | 1 | 1 | 0 | |
| 46 | 1 | 0 | 0 | 0 | 0 | 0 | 0 | 0 | 1 | 0 | 1 | 0 | 1 | 0 | 1 | 0 | |
| 168 | 0 | 0 | 0 | 0 | 0 | 0 | 0 | 0 | 1 | 0 | 1 | 1 | 1 | 0 | 1 | 0 | |
| 633 | 0 | 0 | 0 | 0 | 1 | 1 | 0 | 0 | 0 | 0 | 0 | 0 | 0 | 0 | 0 | 0 | Pure dolomite included as a standard |
| 122 | 0 | 0 | 1 | 1 | 0 | 0 | 1 | 0 | 1 | 0 | 1 | 0 | 1 | 1 | 1 | 0 | |
| 300 | 0 | 0 | 0 | 0 | 1 | 1 | 0 | 0 | 1 | 0 | 1 | 0 | 0 | 0 | 1 | 0 | |
| 28 | 0 | 0 | 0 | 0 | 0 | 0 | 1 | 0 | 1 | 0 | 1 | 1 | 1 | 0 | 1 | 1 | |
| 200 | 0 | 0 | 0 | 0 | 1 | 1 | 1 | 1 | 1 | 0 | 1 | 0 | 1 | 1 | 1 | 1 | |
| 238 | 0 | 0 | 1 | 1 | 0 | 0 | 1 | 1 | 1 | 0 | 1 | 0 | 1 | 1 | 1 | 0 | |
| 298 | 0 | 0 | 0 | 0 | 1 | 1 | 1 | 0 | 1 | 0 | 1 | 0 | 0 | 0 | 1 | 1 | |
| 251 | 0 | 0 | 1 | 1 | 0 | 0 | 0 | 0 | 1 | 0 | 1 | 0 | 1 | 1 | 1 | 0 | |
| 48 | 0 | 0 | 1 | 1 | 0 | 0 | 1 | 0 | 1 | 0 | 1 | 0 | 1 | 1 | 1 | 1 | |
| 221 | 0 | 0 | 1 | 1 | 0 | 0 | 1 | 1 | 1 | 0 | 1 | 0 | 1 | 1 | 1 | 0 | |
| 187 | 0 | 0 | 1 | 1 | 0 | 0 | 1 | 1 | 1 | 0 | 1 | 0 | 1 | 1 | 1 | 0 | |
| 137 | 0 | 0 | 1 | 1 | 0 | 0 | 0 | 0 | 1 | 0 | 1 | 0 | 1 | 1 | 1 | 0 | |
| 5 | 0 | 0 | 0 | 0 | 0 | 0 | 0 | 0 | 1 | 0 | 1 | 1 | 1 | 0 | 1 | 0 | |
| 24 | 0 | 0 | 0 | 0 | 0 | 0 | 1 | 0 | 1 | 0 | 1 | 1 | 1 | 0 | 1 | 0 | |
| 234 | 0 | 0 | 1 | 1 | 0 | 0 | 1 | 0 | 1 | 0 | 1 | 0 | 1 | 1 | 1 | 0 | |
| 155 | 0 | 0 | 0 | 0 | 0 | 0 | 1 | 0 | 1 | 0 | 1 | 1 | 1 | 0 | 1 | 0 | |
| 184 | 0 | 0 | 0 | 0 | 0 | 0 | 0 | 0 | 1 | 0 | 1 | 0 | 0 | 0 | 1 | 0 | |
| 70 | 0 | 0 | 1 | 1 | 0 | 0 | 1 | 0 | 1 | 0 | 1 | 1 | 1 | 0 | 1 | 0 | |
| 160 | 0 | 0 | 1 | 1 | 0 | 0 | 1 | 0 | 1 | 0 | 1 | 0 | 1 | 1 | 1 | 0 | |
| 20 | 0 | 0 | 1 | 1 | 0 | 0 | 1 | 0 | 1 | 0 | 1 | 0 | 1 | 1 | 1 | 1 | |
| 194 | 0 | 0 | 1 | 1 | 0 | 0 | 1 | 0 | 1 | 0 | 1 | 0 | 1 | 0 | 1 | 1 | |
| 43 | 1 | 0 | 0 | 0 | 0 | 0 | 0 | 0 | 0 | 0 | 1 | 1 | 0 | 0 | 1 | 0 | |
| 249 | 0 | 0 | 0 | 0 | 1 | 1 | 0 | 0 | 1 | 0 | 1 | 0 | 1 | 0 | 1 | 0 | |
| 27 | 1 | 1 | 0 | 0 | 0 | 0 | 0 | 0 | 1 | 0 | 1 | 0 | 1 | 1 | 1 | 0 | |
| 281 | 0 | 0 | 1 | 1 | 0 | 0 | 1 | 0 | 1 | 0 | 1 | 0 | 1 | 1 | 1 | 1 | |
| 23 | 0 | 0 | 1 | 1 | 0 | 0 | 0 | 0 | 1 | 0 | 1 | 1 | 1 | 1 | 1 | 0 | |
| Character Analysis: | |||||||||||||||||
| Totals | Present (1) | ||||||||||||||||
| 9 | 6 | 27 | 25 | 5 | 5 | 35 | 6 | 51 | 0 | 52 | 11 | 42 | 28 | 52 | 15 | ||
| Absent (0) | |||||||||||||||||
| 45 | 48 | 27 | 29 | 49 | 49 | 19 | 48 | 3 | 54 | 2 | 43 | 12 | 26 | 2 | 39 | ||
Key to Table 13
For code 1:--
Variable 1 = MnA present (MnA is the Mn2+ species found in calcite lattices).
2 = MnA peak much greater than the free spin feature peaks.
3 = MnB present (MnB is a Mn2+ species intermediate between MnA and MnC).
4 = MnB peak much greater than the free spin feature peaks.
5 = MnC present (MnC is the Mn2+ species found in dolomite lattices).
6 = MnC peak much greater than the free spin feature peaks.
7 = Fe3+ present.
8 = Fe3+ peak greater than the Mn2+ peak.
9 = Free spin species A present.
10 = Free spin species A peak relatively greater than the other free spin feature peaks.
11 = Free spin species B present.
12 = Free spin species B peak relatively greater than the other free spin feature peaks.
13 Free spin species C present.
14 Free spin species C peak relatively greater than the other free spin feature peaks.
15 Free spin species D present.
16 Free spin species D peak relatively greater than the other free spin feature peaks.
Figures 37, 38, and 40 illustrate the types of spectra detected. The ESR signals can readily be assigned to the paramagnetic ions Mn2+ and Fe3+, together with four discrete features in the region of free spin (g = 2.0023). The Mn2+ spectra are of two types corresponding to Mn2+ in a symmetric Ca-site as found in calcite (Figure 37) and to Mn2+ in an asymmetric Mg-site as found in dolomite (Figure 39). These two types of spectra are well documented in the literature (Ghosh et al., 1970; Schindler and Ghose, 1970; Wildeman, 1970; Low and Zeire, 1972). Although the presence of Fe3+ ions is known to produce dipole broadening effects that obliterate weak Mn2+ signals (Wildeman, 1970), the majority of shale samples show strong Mn2+ spectra with Fe3+ forming the background (Figure 41).
Figure 37--ESR spectra of sample 281 illustrating a six-peak Mn2+ spectrum (calcite-structure) and free spin feature.
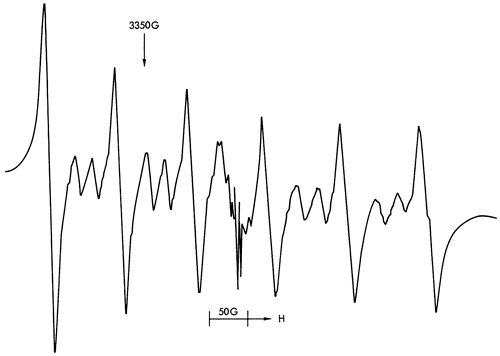
Figure 38--ESR spectra of sample 125 illustrating an Fe3+ spectrum (found in illite) at approximately 200OG and free spin features at approximately 3400G,
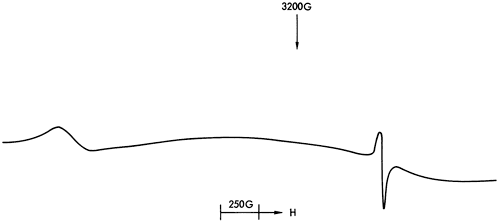
Figure 39--ESR spectrum of Mn2+ in dolomite.
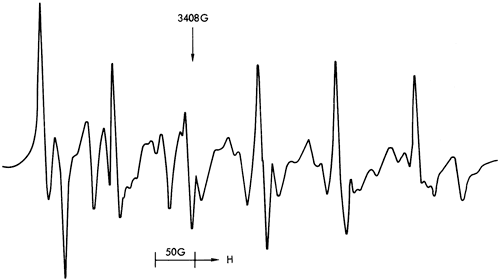
Figure 40--ESR spectra of sample 300 illustrating a six-peak Mn2+ spectrum (dolomite structure).
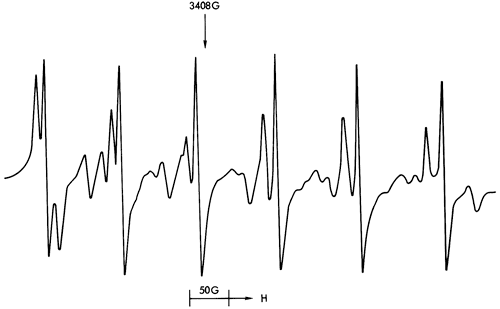
Figure 41--ESR spectra of sample 238 illustrating a Mn2+ spectrum (calcite structure) and free spin feature with a background Fe3+ spectrum manifested in the gradual downwards drift of the Mn2+ spectrum towards the higher field values.

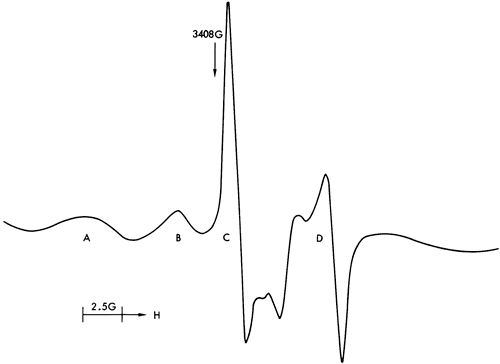
The free spin features bear some resemblance to room temperature ESR spectra of certain clay minerals (Friedlander et al., 1963; Wauchope and Hague, 1971; Boesman and Schoemaker, 1961; Angel and Hall, 1972; Hall et al., 1974). These features can be seen in Figure 42 with species A, B, and D corresponding to a paramagnetic center in illite (probably Fe3+), and species C to a Cr3+ ion. An examination of a variety of carbonates, sulphates, and clay minerals by ESR (Appendix 2) supported these conclusions. Samples of kaolinite, dickite, halloysite, vermiculite, illite, montmorillonite, strontionite, rhodochrosite, barites, celestine, and anhydrite were obtained from Dr. R. J. King of the Department of Geology, Leicester University, and run under the same experimental conditions as the shale samples. The ESR spectra showed that only the illite and montmorillonite specimens produced the free spin features described above. As montmorillonite is found in few of the shale samples, and then only in minor quantities, it was concluded that illite provided the free spin spectra detected.
Figure 42--Free spin feature in the ESR spectra of sample 86. See text for explanation of diagram.
The ESR spectra also indicate that the only structural site occupied by Mn2+ is in the lattice of carbonate minerals substituting for Ca2+ and is not associated with the clay minerals. This supports the conclusions drawn concerning the environment of deposition of calcareous shales inferred from the stratigraphic distribution of Mn. The conditions indicated by the Sr distribution must therefore be treated with skepticism.
The remainder of this section concentrates on a statistical analysis of the ESR spectra and a verification of the geochemical and mineralogical classifications previously developed. For such a study, the uncertain nature of the species causing ESR absorptions is not a major obstacle as precise identification of each species is unnecessary for classification purposes.
Analysis of the ESR Spectral Data
The accumulation of a large number of ESR spectra made visual comparison of spectral characteristics difficult. Consequently, these characteristics (presence or absence of a signal and relative intensity values) were coded (Table 13) and compared using a computer method developed for taxonomic classification (Sokal and Sneath, 1963). The computer programs (ITBNTOMT and ITBNCLST) calculate similarities between the samples using the simple matching coefficient (SM) and then cluster the similarity values using an unweighted average linkage method (Sokal and Sneath, 1963). The resulting hierarchical classification (dendrogram) is illustrated in Figure 43.
Figure 43--Dendrogram of ESR data calculated using an unweighted average linkage algorithm. Clusters produced are indicated on the left.
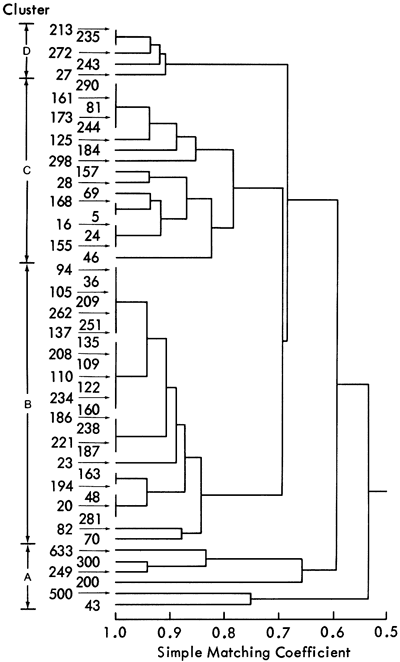
The computer classification shows that the shale samples form four groups, A-D. However, this classification is still empirical as it is based solely on similarities between samples. To assess the geological significance of these groups, a direct comparison with the mineralogical classification was attempted. This classification yielded a seven-fold subdivision of the shale samples having a two-space distribution shown in Figure 18. This figure also shows the primary original variables which have been superimposed on this distribution to indicate the mineralogical nature of each group. In this classification, therefore, the geological significance of each group is known. Comparison of shale samples contained in ESR groups A-D, with their position in the mineralogical groups A-H, is summarized in Table 14. This table, combined with Figure 18, indicates the geological nature of the four ESR groups. Group C consists predominantly of shales within the mineralogical groups A, B, and C. By examining Figure 18, it is apparent that mineralogical groups A, B, and C have high quartz values. Group C samples, therefore, must be predominantly quartz rich. Similarly, ESR group A samples are predominantly dolomitic and groups B and D samples are high in calcite. The distinction between groups B and D arises from different site symmetries for Mn2+ in these shales.
Table 14--A comparison of the position of samples in ESR groups A-D with their position within the mineralogical classification (e.g., of the five samples constituting group D in the ESR classification, four were classified in group E of the X-ray diffraction classification and one in group B).
| X-Ray Diffraction Groups | |||||||||
|---|---|---|---|---|---|---|---|---|---|
| A | B | C | D | E | G | H | Standards | ||
| ESR Groups |
A | 2 | 2 | 2 | |||||
| B | 7 | 4 | 13 | 2 | |||||
| C | 2 | 13 | 1 | 1 | |||||
| D | 1 | 4 | |||||||
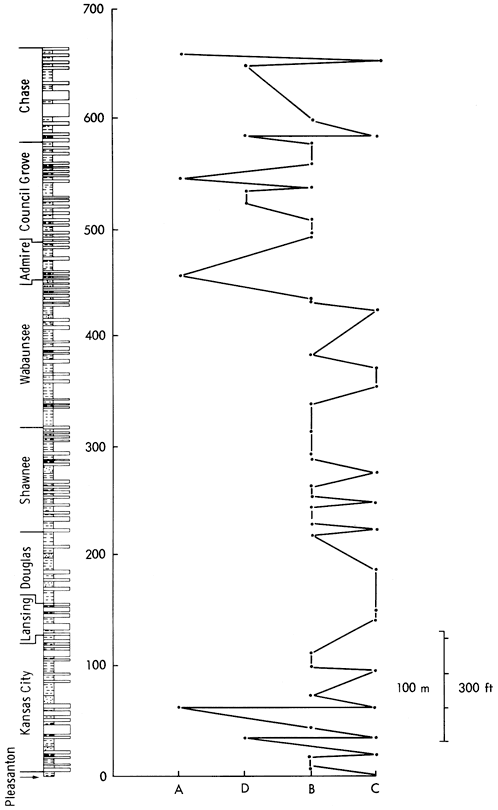
As the mineralogical classification is, obviously, based on mineralogical data, the groups derived from this analysis must represent geologically meaningful subdivisions of the shale sample collection. As the ESR and mineralogical groups correspond, it is also probable that the parameters controlling these groups are equivalent. This assumption is supported by a plot of the samples in the four ESR groups against stratigraphical position (Figure 44), which is very similar to equivalents for the mineralogical and geochemical classifications and indicates major breaks just below the base of the Permian, at the Wabaunsee-Shawnee boundary, at the top of the Douglas, and the base of the Lansing, producing a five-fold division of the stratigraphic column. The Pleasanton and Kansas City (Lower and Middle) Groups are characterized by alternations of samples from all four clusters. The Upper Kansas City, Lansing, and Lower Douglas Groups only contain samples of group C, indicating clastic deposition throughout this period. The succeeding Upper Douglas and the Shawnee Groups consist of group B and occasionally group C samples, reflecting the general calcareous nature of the sediments. Samples in the Lower Wabaunsee Group region are also exclusively from clusters B and C. However, they are developed in different proportions to the Shawnee, indicating a higher detrital content for the beds. The Permian and Upper Wabaunsee shale samples fall into all four categories with A, D, and B predominating. Here is further support for the hypothesis that the Permian/ Pennsylvanian boundary marks a change in sedimentological conditions from the clastic deposition of the Upper Pennsylvanian to the carbonate-evaporite deposits of the Permian era.
Figure 44--A plot of the stratigraphic position of shale samples against their ESR cluster. The horizontal scale is arbitrary but may give some indication of increasing carbonate content to the left.
Discussion
Although electron spin resonance has been employed widely in geological fields (Cubitt, 1975b), the technique has been mainly applied by physicists and chemists to geological material. Consequently, the potential of ESR as a geological tool is almost unknown. From a geological point of view the primary function of the technique is to detect certain ionic species in rocks and minerals and to define the structural sites of these ions. As a speedy, non-destructive, highly sensitive instrumental technique applicable to nearly 50 percent of all the ions in the periodic table, ESR can be used to supply supplementary information for the interpretation of shale geochemistry. A classification of the Upper Pennsylvanian and Lower Permian shale samples based on ESR detection of minor impurities in mineral constituents has been developed that shows similarity to the mineralogical and geochemical classifications. The classification produced from presence/absence spectral data has shown that the shales can be divided into four groups--a detrital shale group, a dolomitic shale group, and two calcite-rich shale groups. The distribution of these shale groups (Figure 44) revealed the following five subdivisions in the stratigraphy:
- A Pleasanton and Kansas City Group division;
- A Lansing and Lower Douglas division;
- An Upper Douglas and Shawnee division;
- A Wabaunsee division; and
- A Permian division consisting of the Admire, Council Grove, and Chase Groups.
The differences between the sections reflect basic changes in sedimentary depositional conditions, of which the most noticeable occurs at the base of the Permian where the detrital/calcareous shale sequence of the Upper Pennsylvanian is succeeded by the carbonate-evaporite environment of the Permian.
Finally, ESR spectra of Upper Pennsylvanian and Lower Permian shales have indicated that Mn2+ is associated with carbonate minerals rather than clay minerals. This supports conclusions drawn previously concerning the environment of deposition of calcareous shales, namely that the Shawnee, Upper Wabaunsee, and Admire Groups probably represent periods of deep-water sedimentation and the Kansas City Group, a period of shallow-water deposition.
Prev Page--Emission Spectroscopy || Next Page--Statistical Analysis
Kansas Geological Survey, Geology
Placed on web May 6, 2009; originally published December 1979.
Comments to webadmin@kgs.ku.edu
The URL for this page is http://www.kgs.ku.edu/Publications/Bulletins/217/05_elect.html