Kansas Geological Survey, Bulletin 187, part 2, originally published in 1967
Hydrologist, Wichita Water Department
Prepared by the United States Geological Survey and the State Geological Survey of Kansas, with the cooperation of the Division of Water Resources of the Kansas State Board of Agriculture, the Environmental Health Services of the Kansas State Department of Health, and the City of Wichita.
Originally published in 1967 as Kansas Geological Survey Bulletin 187, part 2. This is, in general, the original text as published. The information has not been updated. An Acrobat PDF version (12 MB) is also available.
The drought of the 1950's resulted in a continual water-level decline as reported in Kansas Geological Survey Bulletin 119, Part 1. Since 1957, however, substantial quantities of recharge have occurred, and as a result the water table has shown a net rise. In addition, Wichita's withdrawals from the newly completed surface-water reservoir, commencing in 1965, has resulted in a reduced and dispersed draft from the Equus-beds well field, thus affecting the water levels.
The maximum decline in water level since 1940 was 33 feet in 1956; by December 31, 1965, the maximum decline had decreased to approximately 20 feet. Thus, the maximum net rise in the center of the well field has been 13 feet. The zone of pumping influence encompassed an area somewhat in excess of 120 square miles by 1956, but by December 31, 1965, the affected area had been reduced to about 98 square miles. The storage capacity of the zone of pumping influence had dropped from 111,000 acre-feet in 1956 to 95,800 by the end of 1965, indicating that recharge more than balanced withdrawals. During this period, the City of Wichita had pumped 306,000 acre-feet of water from the well field.
From September 1940 to December 31, 1965, the historical period of pumping, the City of Wichita pumped 636,000 acre-feet of water from the well field. The reduction in storage amounted to 95,800 acre-feet. Thus, about 85 percent of the water pumped from the Wichita well field since 1940 has been replaced by recharge.
The Wichita well field, and certainly the greater Equus-beds area as a whole, can stand substantial increase in development. The full potential of the Equus beds will never be realized unless water levels are lowered to points lower than they have been in the past. The Little Arkansas River, the spillway to the Equus beds, is still a gaining stream, and thus considerable water is discharged from the Equus beds and flows from the area unused. Proper water management in the Equus-beds area must include the development of the unused surface waters of the Little Arkansas River.
This report is the second of a series of progress reports on the ground-water resources of the Equus-beds area, near Wichita, Kansas, and has been made as a part of the cooperative program of the City of Wichita and the State Geological Survey of Kansas, the Division of Sanitation of the State Department of Health, the Division of Water Resources of the State Board of Agriculture, and the Kansas Water Resources Board. The report has been reviewed by the U.S. Geological Survey and other cooperating agencies.
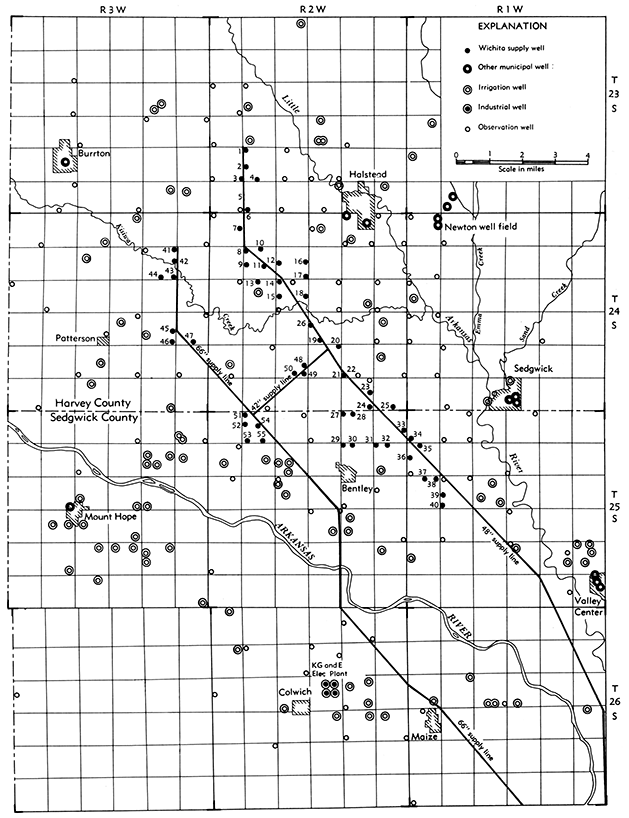
Williams and Lohman (1949) made an extensive study of the ground-water hydrology of the Equus-beds area of south-central Kansas. The field work done for that report led to the development of the Wichita well field in the southern part of Harvey County. In 1949, the well field was extended into the northern part of Sedgwick County, and in 1959 additional wells were installed in both Harvey and Sedgwick counties. Wells no. 1 to no. 25 (Fig. 1) belong to the original 1940 group, wells no. 26 to no. 35 were put into operation in 1949, and wells no, 36 to no. 55 were put into operation in 1959.
Figure 1--Locations of wells in the Wichita well-field area.
Stramel (1956) reviewed the effects of pumpage from the Wichita well field through January 1, 1955. This report included part of the severe drought of the 1950's when water levels were declining. The drought continued until the spring of 1957; since that time the well field has received nearly average or above-average precipitation with a resultant net rise in water level.
Much detailed information concerning pumping tests, test holes, quality of water, geology, artificial recharge, as well as other information contained in the files of the City of Wichita Water Department, have been utilized as reference material. These data are available in departmental reports in the Wichita Water Department, although they have not had formal publication and distribution.
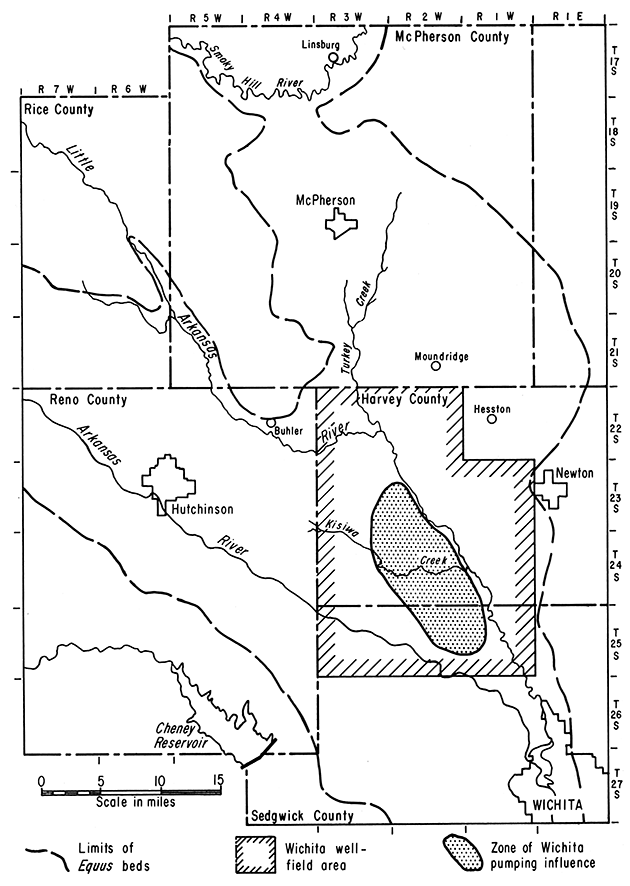
The Wichita well-field area includes only a part of the greater Equus-beds area (Fig. 2). The Wichita well field is in an area that has the greatest ground-water potential within the Equus beds. In this area the sand and gravel have the greatest thickness, lateral extent, and highest permeability, and conditions are favorable for a high rate of recharge.
Figure 2--Location of Equus-beds area.
This report is concerned with evaluating the effects of the recharge and pumping since January 1, 1955, and re-evaluating the long-range effects of pumping, recharge, and drought since 1940. In 1965, the City of Wichita began to divert water from the Cheney Reservoir, after which the draft from the Equus beds was reduced. The rate of water-level recovery in the Wichita well field, affected by the reduced draft, is also evaluated.
The monthly precipitation at the Wichita station for the period 1888-1954 was given by Stramel (1956), and monthly precipitation for the period 1955-1965 is given in Table 1. The precipitation records from three gages maintained by the City of Wichita and located in the heart of the Wichita well field are tabulated in Table 2. These data show the variations in rainfall totals between the Wichita and the well-field stations and also the variations within the well-field area. Figure 3 shows a bar graph of annual precipitation at the Wichita station, cumulative departure from calculated average precipitation, and a hydrograph of observation well no. 12 in the NW sec. 26, T 25 S, R 1 W.
Table 1--Monthly and annual precipitation, in inches, at Wichita, Kansas.
| 1955 | 1956 | 1957 | 1958 | 1959 | 1960 | 1961 | 1962 | 1963 | 1964 | 1965 | |
|---|---|---|---|---|---|---|---|---|---|---|---|
| January | 0.61 | 0.43 | 0.19 | 0.81 | 0.53 | 1.37 | 0.02 | 1.07 | 1.22 | 0.71 | 0.56 |
| February | 1.71 | .45 | .77 | 1.03 | .23 | 1.41 | 1.51 | .47 | .02 | .53 | 1.39 |
| March | .68 | .91 | 2.60 | 4.07 | .85 | 1.18 | 4.83 | .26 | 1.67 | .89 | .48 |
| April | .72 | 1.46 | 3.31 | 1.23 | 2.17 | 1.28 | 2.00 | 1.02 | .22 | 2.97 | 2.63 |
| May | 4.02 | 1.40 | 7.57 | 2.44 | 5.53 | 4.10 | 4.02 | .99 | 6.15 | 5.84 | 6.26 |
| June | 3.98 | 1.28 | 10.46 | 3.00 | 2.35 | 4.59 | 2.61 | 4.80 | 4.51 | 3.73 | 8.00 |
| July | 1.30 | 2.51 | 1.99 | 7.19 | 7.38 | 5.57 | 6.56 | 9.22 | 2.70 | 2.23 | 3.62 |
| August | 1.06 | .70 | .59 | 2.93 | 4.20 | 7.91 | 3.80 | 2.95 | 2.86 | 6.10 | 4.91 |
| September | 3.79 | .03 | 5.05 | 6.11 | 2.31 | 2.25 | 5.24 | 8.23 | 4.90 | 2.66 | 8.44 |
| October | 5.84 | 2.69 | 2.72 | T | 6.13 | 5.03 | 4.87 | 1.32 | 2.47 | 1.64 | .32 |
| November | .03 | .48 | 1.45 | 2.39 | .30 | .37 | 2.81 | 1.62 | 1.04 | 5.88 | .11 |
| December | .03 | .39 | .45 | .46 | 1.60 | 1.73 | 1.01 | .60 | .34 | 1.03 | 2.25 |
| Annual total | 23.77 | 12.73 | 37.15 | 31.66 | 33.58 | 36.79 | 39.28 | 32.55 | 28.10 | 34.21 | 38.57 |
| Records from U.S. Weather Bureau, Climatological data, Kansas section. | |||||||||||
Table 2--Monthly and annual precipitation, in inches, in the Wichita well field.*
| Year | Jan. | Feb. | Mar. | Apr. | May | June | July | Aug. | Sept. | Oct. | Nov. | Dec. | Annual total |
|---|---|---|---|---|---|---|---|---|---|---|---|---|---|
| Wichita Well 6 | |||||||||||||
| 1959 | 0.11 | 0.57 | 0.87 | 1.51 | 5.40 | 1.31 | 4.39 | 2.44 | 2.01 | 5.52 | 0.09 | 0.94 | 25.16 |
| 1960 | 1.09 | .99 | 1.20 | 1.12 | 3.85 | 4.14 | 2.25 | 5.51 | 4.10 | 2.88 | .23 | 1.62 | 28.98 |
| 1961 | .07 | .46 | 2.76 | 2.79 | 4.20 | 2.04 | 6.82 | 1.90 | 5.76 | 1.82 | 2.10 | .59 | 31.31 |
| 1962 | .46 | .53 | .51 | 1.09 | 6.60 | 8.77 | 6.68 | 2.69 | 4.23 | 2.21 | 1.21 | .32 | 35.30 |
| 1963 | .48 | .00 | 1.16 | .57 | 3.26 | 2.41 | 6.62 | 1.27 | 4.63 | 3.88 | .72 | .14 | 25.14 |
| 1964 | .48 | .25 | 1.22 | 2.14 | 5.16 | 3.03 | 1.45 | 6.37 | 2.67 | .41 | 5.68 | .84 | 29.70 |
| 1965 | .16 | .91 | .23 | 2.96 | 6.13 | 7.89 | 4.79 | 5.27 | 4.74 | .30 | .03 | 1.83 | 35.24 |
| Wichita Well 14 | |||||||||||||
| 1951 | 0.63 | 1.93 | 1.48 | 4.76 | 9.98 | 6.34 | 4.12 | 4.96 | 5.69 | 2.22 | 0.47 | 0.09 | 42.67 |
| 1952 | .23 | .55 | 1.90 | 2.16 | 3.60 | 1.30 | 1.19 | 1.13 | .62 | .00 | 1.74 | .83 | 15.25 |
| 1953 | .05 | .97 | 2.26 | 1.08 | 3.55 | 3.21 | 3.01 | .87 | 1.39 | 1.38 | 1.04 | ],10 | 19.91 |
| 1954 | .03 | 1.01 | .31 | 2.96 | 3.47 | 1.65 | .04 | 2.82 | 1.38 | 1.51 | .00 | .19 | 15.38 |
| 1955 | .66 | 1.17 | .31 | 2.17 | 2.94 | 3.62 | .71 | .96 | 4.72 | 3.33 | .05 | .01 | 20.65 |
| 1956 | .30 | .20 | .54 | 1.16 | 1.91 | 1.94 | 2.13 | .24 | .00 | 2.55 | .44 | .56 | 11.97 |
| 1957 | .05 | .43 | 3.77 | 3.52 | 10.30 | 7.73 | 1.51 | 1.64 | 4.44 | 2.09 | 1.66 | .39 | 37.53 |
| 1958 | .66 | 1.47 | 3.46 | 1.68 | 2.14 | 2.52 | 10.64 | 1.45 | 7.61 | .01 | 1.12 | .39 | 33.15 |
| 1959 | .18 | .43 | .99 | 1.77 | 5.65 | 2.07 | 5.40 | 3.07 | 2.45 | 6.11 | .12 | .89 | 29.13 |
| 1960 | .98 | .87 | 1.14 | 1.63 | 3.76 | 3.33 | 2.56 | 6.05 | 4.51 | 3.77 | .40 | 1.61 | 30.60 |
| 1961 | .23 | .79 | 2.56 | 3.00 | 4.91 | 2.76 | 7.33 | 1.73 | 5.93 | 1.57 | 2.30 | .79 | 33.90 |
| 1962 | .48 | .56 | .56 | 1.25 | 5.74 | 6.30 | 6.40 | 2.85 | 3.87 | 2.03 | 1.25 | .41 | 31.70 |
| 1963 | .67 | .01 | 1.33 | .49 | 3.36 | 2.34 | 7.61 | 2.25 | 3.66 | 2.75 | .69 | .11 | 25.27 |
| 1964 | .50 | .25 | 1.32 | 1.51 | 5.40 | 2.21 | 1.35 | 6.26 | 2.58 | .54 | 4.96 | .85 | 27.73 |
| 1965 | .30 | .96 | .20 | 2.71 | 4.35 | 7.21 | 4.75 | 5.21 | 5.55 | .25 | .01 | 2.10 | 33.60 |
| Wichita Well 23 | |||||||||||||
| 1959 | 0.11 | 0.46 | 0.83 | 1.66 | 6.03 | 2.16 | 4.89 | 3.84 | 2.51 | 6.25 | 0.09 | 0.74 | 29.57 |
| 1960 | 1.04 | .83 | 1.44 | 2.51 | 3.61 | 3.74 | 1.92 | 6.56 | 4.15 | 3.25 | .02 | 1.54 | 30.61 |
| 1961 | .12 | 1.48 | 2.46 | 3.19 | 5.93 | 4.53 | 8.95 | 2.71 | 4.07 | 2.46 | 2.11 | .76 | 38.78 |
| 1962 | .45 | .45 | .39 | 1.12 | 5.55 | 4.95 | 6.80 | 2.04 | 4.43 | 1.70 | 1.21 | .28 | 29.37 |
| 1963 | .64 | .00 | 1.22 | .46 | 2.54 | 2.49 | 6.52 | 1.48 | 3.13 | 2.41 | .70 | .08 | 21.67 |
| 1964 | .55 | .17 | 1.17 | 1.41 | 6.99 | 2.04 | 2.69 | 7.42 | 3.33 | .80 | 5.63 | .72 | 31.92 |
| 1965 | .07 | .90 | .16 | 2.58 | 4.18 | 8.71 | 4.20 | 3.94 | 6.92 | .22 | .00 | 2.83 | 34.71 |
| *Measurements made by Wichita Water Department personnel. | |||||||||||||
Figure 3--Precipitation, cumulative departure from calculated average precipitation (1888 to 1965), and water level in observation well no. 12.
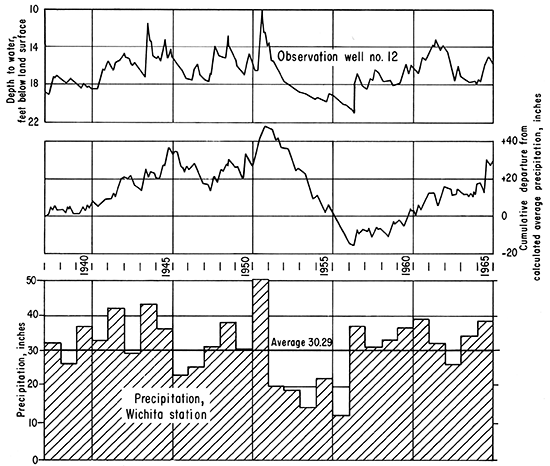
These data show the effects of the drought of the 1950's and the effects of recharge, which began in 1957. The length of record for both the precipitation and ground-water levels is long enough to provide a basis for predicting future changes. It is expected that precipitation in the future will follow the same general pattern that it has in the past. Thus, there will be irregular periods of high precipitation and periods of drought.
Monthly pumpage records for the City of Wichita from 1940 through 1954 are given by Stramel (1956, table 2). The pumpage records for the years 1955-1965 are given in Table 3.
Table 3--Pumpage* by the City of Wichita from the Equus-beds well field, 1955-65.
| 1955 | 1956 | 1957 | 1958 | 1959 | 1960 | 1961 | 1962 | 1963 | 1964 | 1965 | |
|---|---|---|---|---|---|---|---|---|---|---|---|
| January | 692.5 | 677.2 | 698.4 | 708.0 | 652.4 | 652.5 | 665.6 | 718.9 | 799.2 | 811.1 | 818.2 |
| February | 619.0 | 560.6 | 656.2 | 609.4 | 635.3 | 620.3 | 620.1 | 641.4 | 729.7 | 737.1 | 746.9 |
| March | 695.2 | 576.8 | 723.2 | 698.7 | 732.4 | 672.3 | 704.9 | 724.2 | 782.3 | 820.1 | 831.3 |
| April | 722.0 | 758.1 | 664.9 | 676.8 | 724.9 | 698.5 | 702.5 | 748.8 | 985.3 | 807.0 | 832.5 |
| May | 724.4 | 746.0 | 703.7 | 771.4 | 736.7 | 752.8 | 770.3 | 978.8 | 917.6 | 910.6 | 919.4 |
| June | 692.6 | 784.9 | 694.5 | 809.8 | 837.5 | 869.5 | 854.1 | 843.9 | 1017.5 | 946.6 | 838.1 |
| July | 812.3 | 829.4 | 856.4 | 811.8 | 796.6 | 786.1 | 872.7 | 924.7 | 1047.1 | 1174.3 | 788.6 |
| August | 844.8 | 938.6 | 1112.4 | 846.3 | 912.7 | 810.9 | 857.9 | 1020.4 | 1052.2 | 1014.8 | 798.1 |
| September | 735.7 | 859.1 | 783.1 | 731.4 | 777.3 | 751.3 | 712.0 | 771.4 | 841.7 | 913.8 | 575.7 |
| October | 578.1 | 804.5 | 733.4 | 719.3 | 679.1 | 727.9 | 710.6 | 798.1 | 926.7 | 870.5 | 552.6 |
| November | 635.5 | 682.9 | 690.9 | 667.0 | 639.1 | 663.2 | 687.8 | 725.9 | 755.5 | 808.1 | 533.3 |
| December | 668.9 | 580.1 | 709.0 | 690.1 | 662.0 | 660.2 | 694.3 | 742.0 | 790.8 | 815.6 | 474.3 |
| Annual Pumpage (in mg) |
8421.0 | 8798.2 | 9026.1 | 8740.0 | 8786.0 | 8665.5 | 8852.8 | 9638.5 | 10645.6 | 10629.6 | 8709.0† |
| Annual Pumpage (in 1,000s of acre-feet) |
25.8 | 27.0 | 27.6 | 26.8 | 26.9 | 26.6 | 27.2 | 29.6 | 32.6 | 32.6 | 26.7 |
| * In millions of gallons. † An additional 2,303.0 mg was obtained from Cheney Reservoir. |
|||||||||||
In addition to water from the Equus-beds well field, emergency wells in the water-plant area in Wichita were utilized when necessary. Since June 1965, partial supply has been derived from Cheney Reservoir.
All cities in the Equus-beds area derive their water supplies from the Equus-beds deposits. Most of these cities reach beyond their political boundaries for water supply. Water supplies are developed where the underlying deposits contain sufficient water of good quality to insure a dependable supply during extended dry periods. Newton obtains water from wells about 7 miles southwest of the city, Hesston and Moundridge both have wells about 4 miles west of their city limits, Buhler has wells 4 miles east of the city, and McPherson has wells at the west edge of the city.
Table 4 shows the principal assigned water rights that exist in the Equus-beds area, and also the actual water use as reported during a 6-year period. Those municipal water uses not shown are generally small.
Table 4--Municipal pumpage, in acre-feet, in the Equus-beds area.
| City | Assigned water right |
Water use reported | |||||
|---|---|---|---|---|---|---|---|
| 1959 | 1960 | 1961 | 1962 | 1963 | 1964 | ||
| Valley Center | 516* | 241 | 162 | 174 | 202 | ||
| Sedgwick | 46† | ||||||
| Halstead | 239* | 228 | 275 | 242 | 287 | 274 | |
| Newton | 6,194* | 2,474 | 2,110 | 2,273 | 2,374 | 2,640 | 2,466 |
| Mount Hope | 55† | 59 | 83 | ||||
| Buhler | 137* | 114 | 123 | 106 | 117 | 131 | 280 |
| Burrton | 123* | ||||||
| Hesston | 40† | 173 | 173 | ||||
| Moundridge | 92† | ||||||
| Hutchinson | 21,020* | 3,981 | 3,473 | 4,314 | 5,181 | 6,017 | |
| Inman | 40† | 275 | 55 | 85 | 101 | 107 | |
| McPherson | 4,768* | 2,335 | 2,159 | 1,948 | 1,805 | 2,760 | 1,199 |
| Wichita | 65,000* | 28,000 | 26,500 | 27,100 | 31,280 | 33,790 | 33,480 |
| Data provided by J. Maurice Street. Water Commissioner. Division of Water Resources, Kansas State Board of Agriculture. * Combined vested and appropriation right. † Vested right only. |
|||||||
The area Water Commissioner reports that by 1964 there were 7,889 acre-feet of industrial water rights assigned in McPherson County, 723 acre-feet in Harvey County, and 20,478 acre-feet in Sedgwick County. However, in 1964, there were only 2,950 acre-feet of water reported used in McPherson County, 623 acre-feet in Harvey County, and 5,066 acre-feet in Sedgwick County.
Established and pending rights for diversion of water for irrigation in Harvey, McPherson, and Sedgwick counties is given in Table 5. Most of the irrigation rights are from ground-water sources. Only a slight increase in irrigation pumpage has been experienced since 1957, due primarily to the above-average precipitation during that time. With the return of below-average precipitation, irrigation pumpage is expected to increase.
Table 5--Irrigation water rights, in acre-feet, established and pending in lower Arkansas unit as of July 1, 1959.
| County | Surface water | Ground water | Total |
|---|---|---|---|
| Harvey | 3,228 | 11,017 | 14,245 |
| Sedgwick* | 1,046 | 14,311 | 15,357 |
| McPherson† | 598 | 8,085 | 8,683 |
| Data provided by J. Maurice Street, Water Commissioner, Division of Water Resources, Kansas State Board of Agriculture. *Includes Townships 25 and 26 in Sedgwick County. †Includes only that area in the Little Arkansas River Drainage Basin. |
|||
Figure 1 shows the locations of irrigation wells in the Wichita well-field area. The amount of water rights assigned to each irrigation plant in this area is based on an annual application of 1.5 acre-feet of water per acre. Thus, the amount of water right per well depends on the number of acres irrigated. Since 1957, the amount of water used for irrigation has been small. Table 6 provides data to show the extent of irrigation use during the years 1959-1964. The total uses reported are shown; however, there were many irrigators who did not report. There is no way of knowing the amount used, although it is believed that most of the irrigators who did not report used little, if any, water.
Table 6--Irrigation use in Harvey, Sedgwick, and McPherson counties.
| Year | ||||||
|---|---|---|---|---|---|---|
| 1959 | 1960 | 1961 | 1962 | 1963 | 1964 | |
| Harvey County | ||||||
| Number of irrigation rights | 75 | 75 | 75 | 75 | 75 | 76 |
| Number of irrigators reporting | 46 | 50 | 54 | 35 | 47 | 40 |
| Number of irrigators reporting no use | 7 | 12 | 21 | 10 | 10 | 7 |
| Total use reported (acre-feet) | 2,356 | 2,199 | 1,182 | 812 | 2,668 | 2,343 |
| Sedgwick County (Townships 25 and 26 only) |
||||||
| Number of irrigation rights | 70 | 72 | 72 | 75 | 77 | 79 |
| Number of irrigators reporting | 30 | 32 | 35 | 37 | 36 | 34 |
| Number of irrigators reporting no use | 7 | 9 | 10 | 13 | 12 | 10 |
| Total use reported (acre-feet) | 1,741 | 1,114 | 732 | 822 | 2,072 | 1,464 |
| McPherson County (Little Arkansas Drainage Basin only) |
||||||
| Number of irrigation rights | 49 | 50 | 52 | 52 | 52 | 52 |
| Number of irrigators reporting | 29 | 35 | 40 | 31 | 40 | 28 |
| Number of irrigators reporting no use | 5 | 5 | 8 | 10 | 9 | 5 |
| Total use reported (acre-feet) | 1,671 | 1,395 | 1,540 | 856 | 2,010 | 1,530 |
Probably less than 100 acre-feet of water per year is used in the Wichita well-field area for farm, domestic, and livestock uses. This quantity, although necessary for rural uses, is very small when compared to the total amount of water pumped for municipal and irrigation use.
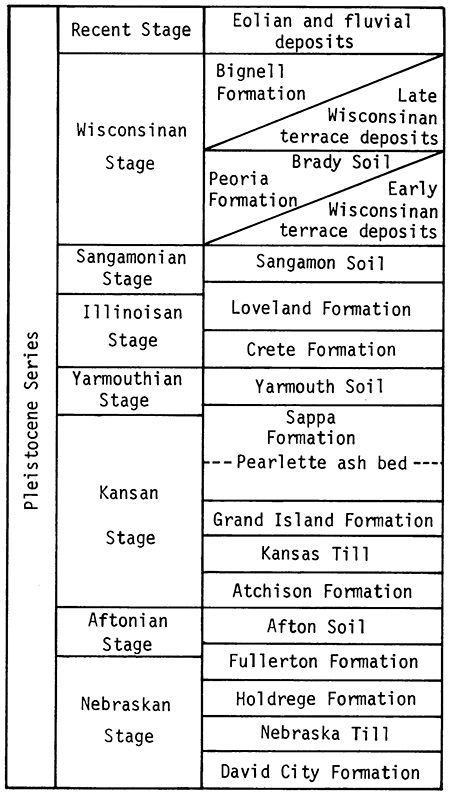
Note: The Pleistocene classification and nomenclature used in this report is that of the State Geological Survey of Kansas and differs somewhat from that of the U.S. Geological Survey.
Detailed knowledge of the geology (Table 7) provides a better understanding of the variations in yields of wells, transmissibility values, and quality of water from the lenticular water-bearing zones in the unconsolidated sediments.
Table 7--Classification of Pleistocene deposits used by the State Geological Survey of Kansas (modified from Frye, 1952).
A considerable number of test holes and production wells have been drilled in the Wichita well-field area since the publication of Kansas Geological Survey Bulletin 119, Part 1. Drill cuttings from most of these holes have been collected and studied either by a staff member of the U.S. Geological Survey or by the author. Most of the samples have been preserved and are on file in the Kansas Geological Survey well-sample library at Lawrence, Kansas. Some of the samples collected in the original study of 1938-1940 were restudied by U.S. Geological Survey personnel. In addition to the data collected in the Wichita well field, geology and ground-water resources reports have recently been published by the Kansas Geological Survey for Kingman, Reno, Harper, Sumner, Cowley, and Sedgwick counties.
In the past all the unconsolidated deposits in the well field were considered to be of Pleistocene age. These deposits are now considered to be of Pleistocene age in the upper part and Pliocene age in the lower part (Lane and Miller, 1965). These conclusions are based primarily on stratigraphy, as few fossil data are available. Volcanic ash deposits presumed to be of Kansan age have been observed in some recent drill cuttings. In reports of the surrounding counties deposits of Pleistocene age have been identified, and these have allowed some extrapolation into the Equus-beds area.
In Bulletin 119, Part 1, the deposits of Pleistocene age in the McPherson Valley are, in ascending order, the Blanco Formation (Nebraskan age), the Meade Formation (Kansan age), the Sanborn Formation (Illinoisan and Wisconsinan ages), and alluvium and dune sand (Wisconsinan and Recent ages). In the present report the deposits formerly labeled as Nebraskan in age are considered Pliocene in age (Lane and Miller, 1965). The age of the materials lying above the Pliocene deposits is considered to be Kansan, Illinoisan, Wisconsinan, and Recent.
During early Pliocene time a deep incision was made in the Permian deposits by a stream flowing from the north. The resulting valley is known in the literature as the "McPherson Valley." A gradual lowering of the underlying Permian bedrock probably occurred as a result of the solution of salt beds in the Wellington Formation directly underlying the valley. The McPherson Valley was subsequently filled with sedimentary deposits during the late Pliocene and the Pleistocene. Part of the late Pliocene deposits probably was removed during early Pleistocene time. Lane and Miller (1965) believe that deposits of Nebraskan age were present at one time but were partially removed prior to Kansan deposition. Throughout much of the well-field area, deposits of Kansan age lie directly on Pliocene deposits. At the end of the Illinoisan Stage, the well-field area was probably mantled with material of Illinoisan age, as was most of the Equus-beds area. By this time, drainage from the north through the McPherson Valley had ceased. No major stream action has taken place in the north part of the McPherson Valley since late Illinoisan time, although in the southern part of the area during Wisconsinan time, the Little Arkansas River developed its present drainage system.
During Wisconsinan time a major stream flowed southeastward from the Hutchinson, Kansas, area across the southern part of the Wichita well field. Frye (1952, p. 197) states, "It is in south-central Kansas that the Wisconsinan drainage presents the most striking contrast to the Illinoian pattern. Arkansas River became integrated on the surface of the Illinoian alluvial plain, perhaps in latest Illinoian time, and certainly by early Wisconsinan time and has undergone slight modification since." This stream cut through the Illinoisan deposits in much of the well-field area and into the underlying Kansan deposits. Much of the Illinoisan material in the well field was removed, and extensive deposits of very coarse, highly permeable material were laid down. The Wisconsinan deposits are incised into older deposits, many of the contacts are sharply defined, and differences in lithology are apparent in drill cuttings from wells only relatively short distances apart.
The deposits in the well-field area are unconsolidated sand, silt, and clay in various proportions. In some localities in the well field the vertical section is composed primarily of sand and gravel down to the top of the Permian. In other localities, layers of sand and gravel lie between layers of silt and clay. In still other areas, silt and clay are dominant.
The undifferentiated surficial material in the northern part of the well field is Illinoisan in age (personal communication, C_ K. Bayne, 1956) and is composed of a relatively thick mantle of silt. Underlying these deposits is sand and gravel of the Crete Formation of Illinoisan age. South of well no. 5, the Illinoisan deposits and much of the Sappa Formation were removed by erosion, and thick deposits of coarse sand and gravel of Wisconsinan age were laid down. These deposits, for the most part, lie directly on material of Kansan age.
The sand and gravel of the Kansan deposits are dominantly "Rocky Mountain" derived material consisting of quartz, feldspar, and other minerals typical of igneous rocks. This material is strikingly different from the underlying Pliocene and Nebraskan deposits in the well-field area and in adjacent uplands which contain many fragments derived from local rocks. This locally derived material is rare in Kansan deposits in McPherson Valley. The principal source of "Rocky Mountain" material in the Kansan deposits is probably the Ogallala Formation of Pliocene age.
The Pliocene sand and gravel is mostly whitish-gray quartz, in part iron-stained, that probably was derived from the Cretaceous rocks to the north and northwest. The sand and gravel beds generally lie between lenses of silt, clay, and sandy clay.
The Pliocene deposits contain many layers of silt, clay, and sandy silt, and the water-bearing zones contain much fine to coarse sand but only a few gravel lenses. The Pleistocene deposits are made up predominantly of thick beds of sand and much gravel with only few clay lenses. Although the Pliocene deposits generally are lenticular, they contain more and thicker beds of silt and clay in the western part of the well field than in the eastern part.
Wisconsinan deposits lie directly on Kansan deposits in most of the well-field area. They are difficult to separate in the field, because they have the same general appearance, and both are composed of "Rocky Mountain" derived material. It is likely that the Wisconsinan deposits may in part be reworked Kansan deposits. Volcanic ash of Kansan age has recently been identified by the U.S. Geological Survey in well no. 45 and in several test holes in the area, and it aids in the differentiation of Kansan and Wisconsinan deposits. The sediments are heterogeneous and irregular in distribution, and there is some indication that the older deeper-lying deposits contain more fine material, which has a lower permeability and transmissibility.
In general, the hydrology of the Wichita well field is simple, yet in detail, it is extremely complex. The unconsolidated deposits represent a huge storage reservoir with a "leaky roof," and containing many temporary confining, or "leaky" beds. The voids in the materials below the water table are everywhere saturated with water. The sand and gravel zones readily give up the stored water to wells; other material, such as the silt, clay, and sandy clay, although they contain large quantities of water, give up the water more slowly.
The hydrology of the Wichita well field is such that at some places the water is under temporary artesian head and at other places it is under water-table conditions. For the most part, the aquifers in the Wichita well-field area are of the "leaky" artesian type. That is, during a short time after pumping commences, the screened aquifer acts as an artesian aquifer and water flows laterally to the wells.
Wichita began its pumping operation in the Equus-beds well field in September 1940. Before 1940, small quantities of ground water were withdrawn from the ground-water reservoir for domestic use and for the few irrigation systems that were in operation. Thus, prior to the well-field development by the City of Wichita, the aquifer was in an approximate state of equilibrium.
Recharge is the addition of water to the ground-water reservoir. In the Wichita well field it results primarily from precipitation that falls near or within the well-field area. Recharge is intermittently high from Kisiwa Creek, and some recharge is occasionally received from the Little Arkansas and Arkansas rivers. In the area outside of the zone of pumping influence, water levels decline during periods of no recharge and rise during periods of recharge. This mayor may not be the case inside the zone of pumping influence, as water levels may continue to decline during periods of recharge because of a continuous pumping draft in excess of the recharge rate. Factors that control the amount of recharge are: position within the well field, temperature, conditions of the soil, and the amount and intensity of precipitation.
Recharge occurs more readily in some parts of the well field than in others. Williams and Lohman (1949) assumed that in the dune area near the north end of the well field extremely high rates of recharge to the lower aquifers were occurring. It is true that the dune sand absorbs most of the precipitation that falls; however, because much of this area is underlain by the relatively impermeable Sappa Formation of Kansan age, much of this water never reaches the underlying water-bearing zones. The Sappa Formation impedes the water in its downward course, and a perched water table builds up in the sand and gravel of the overlying Crete Formation of Illinoisan age. Most of the water then moves laterally and ultimately discharges along the west bank of the Little Arkansas River or returns to the atmosphere. Thus, the effective recharge to the pumped aquifer is low in areas underlain by the Sappa Formation.
Although recharge is lower in areas underlain by the Sappa Formation, it must be acknowledged that considerable recharge does occur in these areas. For example: if we assume that the Sappa Formation in the north end of the well field has an average vertical permeability of 0.02 gpd/ft2 under a 10-foot hydraulic head differential and a thickness of 30 feet, the quantity of flow per day through one square foot of the clay would be equal to 0.007 gpd/ft2. A total of 194,000 gallons per day would flow through 1 square mile of area. If the north end of the well field is underlain by 15 square miles of clay bed, the leakage through it would amount to 2.91 million gallons per day. It is likely that the average vertical permeability of the clay is greater than 0.02 gpd/ft2, and under pumping conditions the head differential across the confining bed increases. Thus, although the Sappa Formation impedes recharge, appreciable quantities of water are added to the underlying sand and gravel. Most of the semiconfining zones in the subsurface probably have a higher permeability than the Sappa Formation.
In most of the well field where Wisconsinan deposits are present and the Sappa Formation has been removed, recharge is directly into the Wisconsinan materials, and good hydraulic communication exists between the Wisconsinan deposits and the underlying gravels of Kansan age. Therefore, recharge rates are high in this area.
The discharge of the Little Arkansas River during base-flow periods is directly related to the height of the water table in the Equus beds, and the river is a natural spillway or drain for the Equus beds. Water levels in the well-field area adjacent to the river must be lowered 15-20 feet below the January 1966 level before the flow of water into the river on the west side of the Little Arkansas River ceases. Should the ground-water levels fall below the level of the water in the river for several years, water would then move from the river to the well field. The effectiveness of the recharge from the river would depend on the degree of hydraulic communication between the river and the underlying aquifer.
Direct use of the Little Arkansas River by the City of Wichita, varying from full supply to zero diversion, depending on the flow and quality of the river water, offers considerable potential. This type of intermittent use must be considered in any water-management scheme for full development of the Equus-beds area.
Prior to pumping, the ground water moved across the well field from northwest to southeast. Part of the flow found its way into the Little Arkansas River. A large part of the underflow in the areas of shallow water levels was discharged by evapotranspiration and never reached the river. Presently, in those areas within the zone of pumping influence where water levels are more than about 10 feet below the land surface, it is assumed that there is little loss by evapotranspiration. Although water levels have been lowered in the well field, some flow continues southeastward into the Little Arkansas River.
In the Wichita well field, static water levels in wells screened in the lower zones (Fig. 4) are lower than the static water levels in the upper zones. In general the deeper the aquifer zone, the lower the static water level. The difference in static water level is very pronounced between the lower aquifer and an overlying aquifer where they are separated by thick beds of material of low permeability. Where the vertical sections of the aquifers contain few or no thin lenses of material of low permeability, only small differences in water level exist. Thus, when comparing water levels in wells, one must be sure that the wells represent the same water-bearing horizons. Where wells have multiple screens, the static water level is a composite water level that is not a true water level for anyone zone screened.
Figure 4--Geologic section through wells no. 41, 42, 43, and 44.
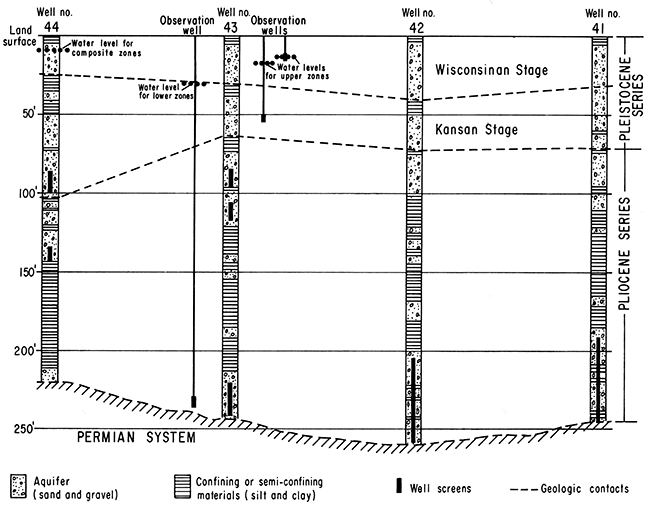
At well no. 39, where few beds of low permeability occur, an observation well 52 feet deep had a water level on January 2, 1963, only 1.65 feet higher than that in a well 143 feet deep. Near well no. 43 the water levels in observation wells having depths of 55 and 235 feet differed by 11.17 feet; the lower water level was in the deeper well. As shown by Figure 4 semi-confining materials at this site are present at several levels in the subsurface.
The presence of the lenticular zones of relatively low permeability, which cause differences in water level, should not be mistaken for permanent confining beds. Actually water moves through the beds of low permeability very slowly, and in time the whole lenticular vertical section acts as a water-table reservoir. The loss in head caused by the movement through the confining beds causes the differences in static water level.
In most of the north end of the well field, little evapotranspiration has taken place from the ground-water body because the depth of water has been beyond the reach of all evaporation and most transpiration forces. In the remainder of the area, as the water level declined due to increased pumping, much of the water formerly discharged by evapotranspiration was added to the ground-water supply. In order to prevent consumption of ground water by evapotranspiration, it is necessary to lower the water level in the ground-water reservoir.
For example, the analysis of data collected in the Wichita well field since 1940 indicates that the decline in the water level has resulted in an increased amount of water available for pumping. If pumpage had not occurred, all or most of this recharge would have been rejected or discharged from the area either through evapotranspiration or into the Little Arkansas River. Thus, the creation of a depression in the zone of pumping influence has, in effect, made more ground water available.
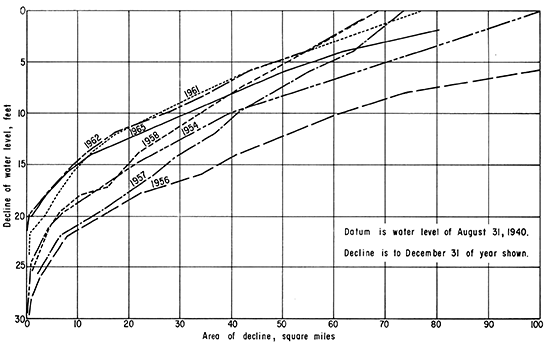
To understand the hydrology of the well field, it is helpful to review the record of water levels since 1940. Water-level change maps for the periods from September 1, 1940 to December 31, 1943, December 31, 1947, December 31,1951, and December 31, 1954, respectively, were published in Bulletin 119, Part 1. These data are continued on 11 maps in this report on an annual basis for the period August 30, 1940 to December 31 of the years 1955 to 1965, inclusive (Fig. 5-15). Selected data are converted into another form in Figure 16. The area contained within a given line of equal change is plotted against the quantity of equal change in water level. The data are plotted as a group of curves, and this represents the volume of the dewatered zone in the well field at the given times. The curves indicate changes in the areal extent and depth of the zone of influence resulting from the shift in pumping patterns and changes in recharge that have occurred in the well field.
Figure 5--Change in water level from August 30, 1940, to December 31, 1955, Wichita well-field area.
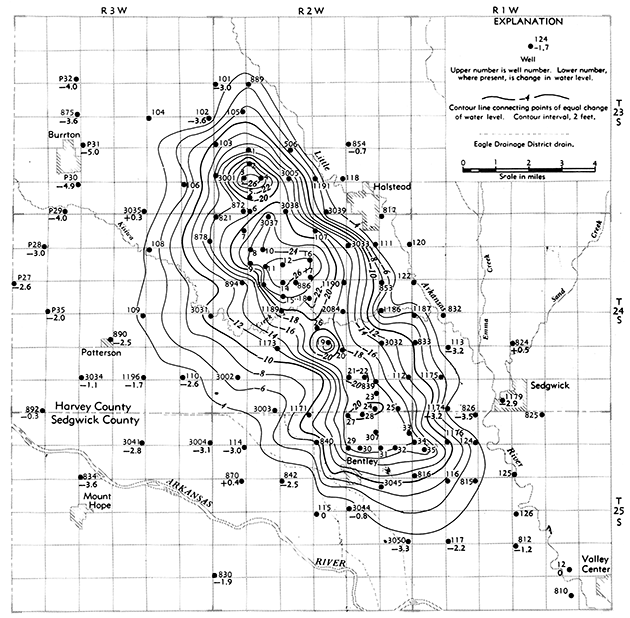
Figure 6--Change in water level from August 30, 1940, to December 31, 1956, Wichita well-field area.
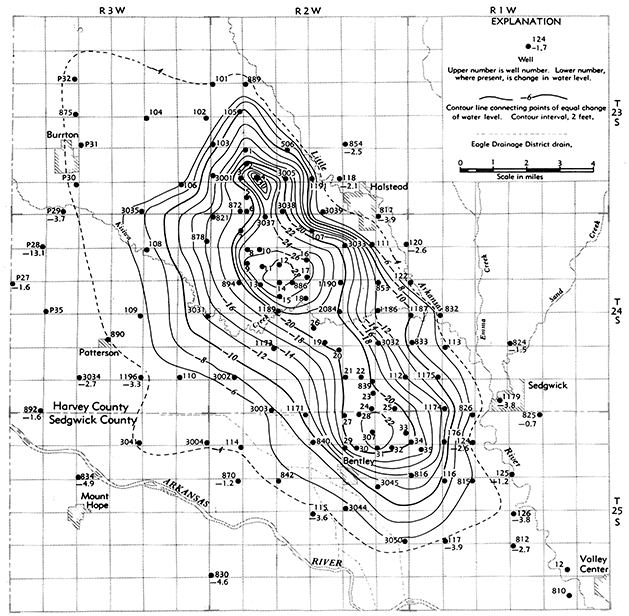
Figure 7--Change in water level from August 30, 1940, to December 31, 1957, Wichita well-field area.
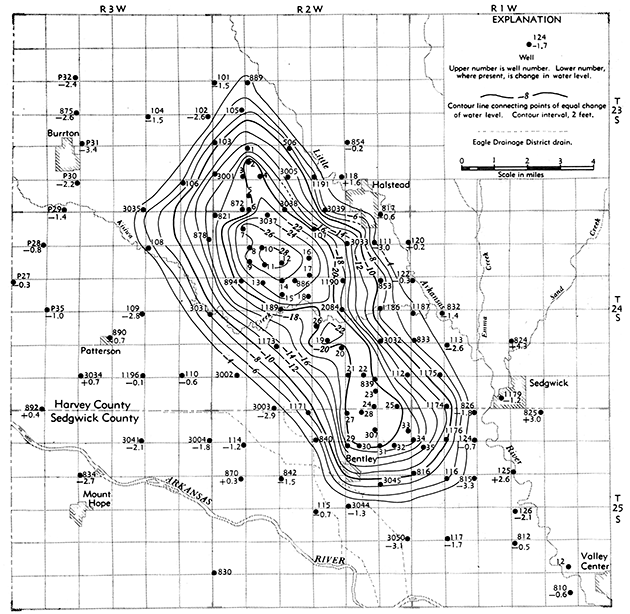
Figure 8--Change in water level from August 30, 1940, to December 31, 1958, Wichita well-field area.
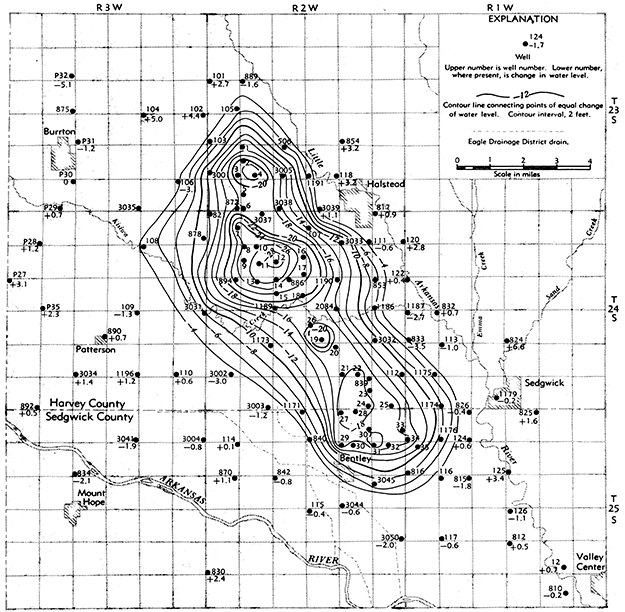
Figure 9--Change in water level from August 30, 1940, to December 31, 1959, Wichita well-field area.
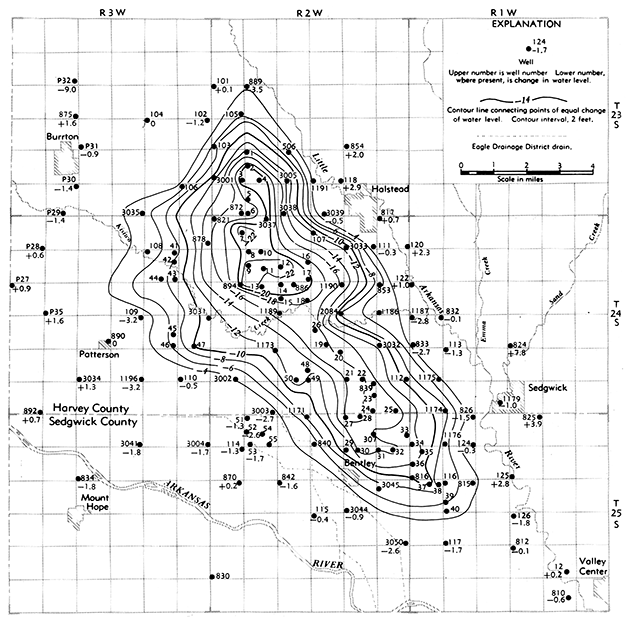
Figure 10--Change in water level from August 30, 1940, to December 31, 1960, Wichita well-field area.
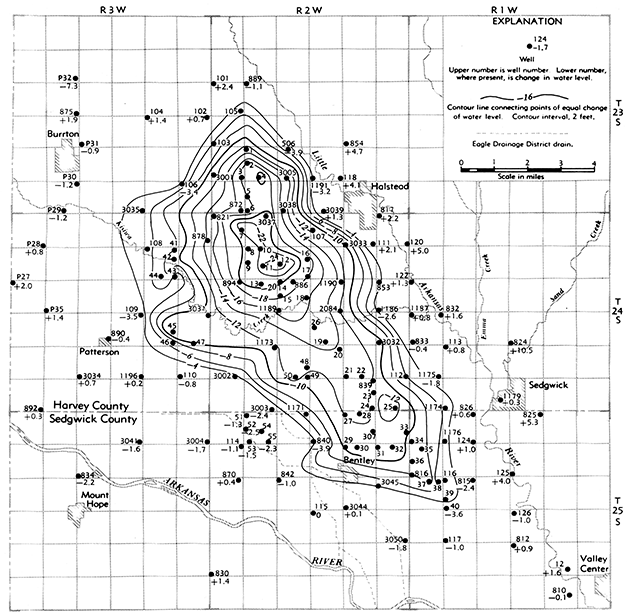
Figure 11--Change in water level from August 30, 1940, to December 31, 1961, Wichita well-field area.
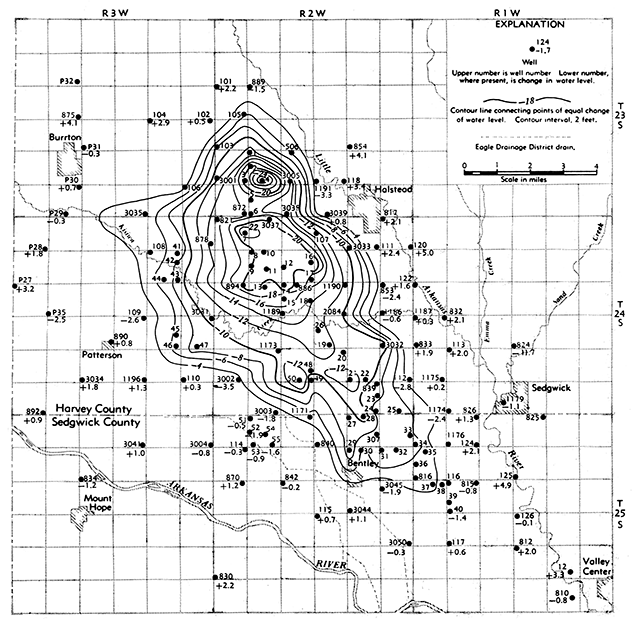
Figure 12--Change in water level from August 30, 1940, to December 31, 1962, Wichita well-field area.
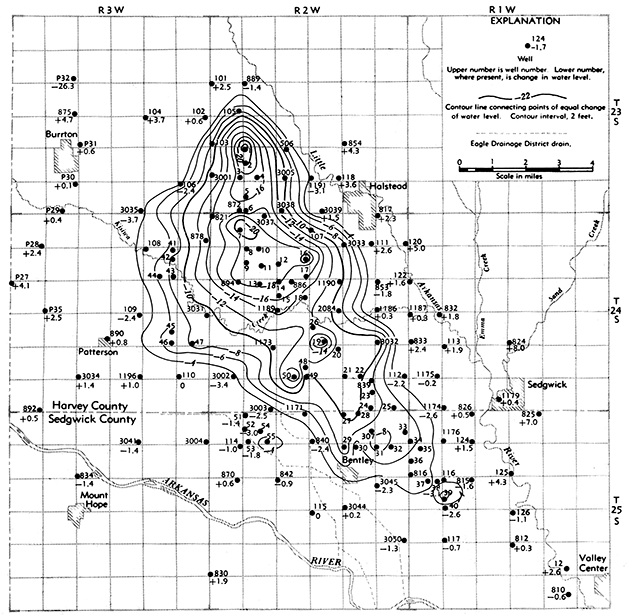
Figure 13--Change in water level from August 30, 1940, to December 31, 1963, Wichita well-field area.
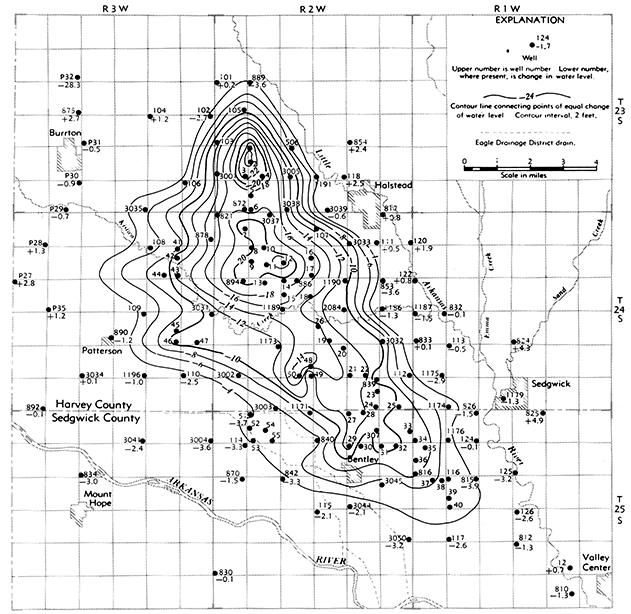
Figure 14--Change in water level from August 30, 1940, to December 31, 1964, Wichita well-field area.
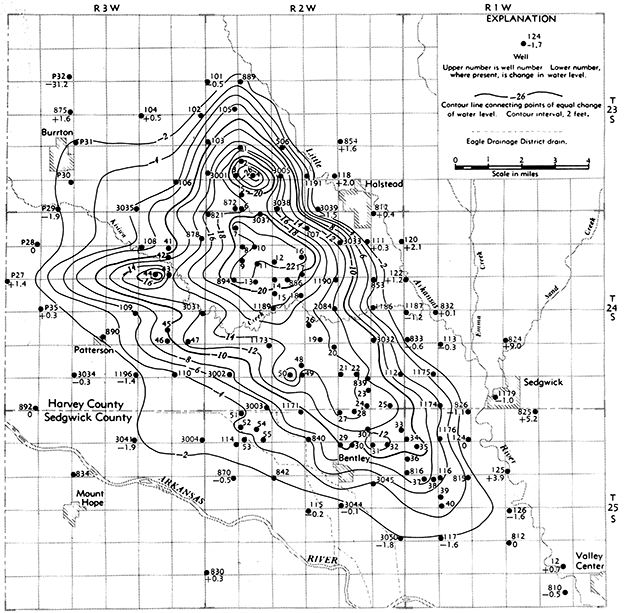
Figure 15--Change in water level from August 30, 1940, to December 31, 1965, Wichita well-field area.
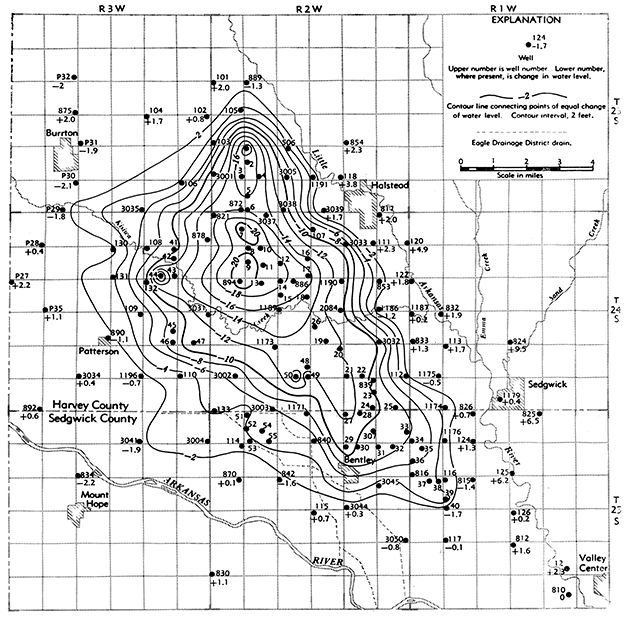
Figure 16--Areal decline of the water table in the Wichita well-field area.
The size and shape of the zone of pumping influence will depend on the degree of dispersal of pumpage, the rate of withdrawals, and the rate of recharge. If the rate of withdrawal increases and recharge remains constant, the water level will decline, and the zone of pumping influence will expand. Conversely, if the rate of withdrawal decreases and recharge remains constant, the water table will rise, and the zone of pumping influence will shrink. As long the pumpage continues, water level in the zone of pumping influence will remain below the 1940 water-level datum.
The zone of pumping influence broadened and deepened from December 31, 1954 to December 31, 1956, as a result of the continuing withdrawals and lack of recharge. Precipitation and subsequent recharge increased in the spring of 1957, and the area of influence began to be reduced. Only small recovery of water levels was experienced in the deeper part of the zone of pumping influence in 1957 and 1958. In 1959, the pumping load was dispersed over a larger area, and by 1961 the area of pumping influence had grown slightly, but at the same time the water level in the deeper part of the zone of influence recovered substantially. During 1962, only slight recovery was experienced in the center of the well field, and other parts of the well field remained relatively stable, During 1962, recharge essentially balanced discharge, and the zone of pumping influence was relatively stable. A slight decline occurred in 1963 and 1964 with substantial recovery in 1965 resulting from above-average precipitation and reduced withdrawals.
Table 8 shows a summary of changes in storage in the well field, using August 30, 1940, as a datum. The data through December 30, 1955, were included in Bulletin 119, Part 1. The report of the Kansas Water Resources Board on Unit 4, the lower Arkansas River (1960), provided data patterned after Bulletin 119, Part 1; however, the recomputed net reduction in storage is reported to be slightly smaller than that indicated in Bulletin 119, Part 1. This is the result of the refinement of the original method used in computing the volume of the zone of pumping influence. The data listed in Table 8 of this report were computed using the W.R.B. method. (The storage coefficient used is still 0.20.)
Table 8--Summary of changes in storage in the Wichita well field.
| Period from 8/30/40 to |
Area affected by pumping, acres |
Accumulated net reduction in storage, acre-feet |
Accumulated water discharged by pumping,* acre-feet |
Total water pumped from storage, percent |
|---|---|---|---|---|
| Dec. 31, 1943 | 32,300 | 33,390 | 51,600 | 66 |
| Dec. 31, 1947 | 34,700 | 49,800 | 135,800 | 37 |
| Dec. 31, 1951 | 32,400 | 50,200 | 230,000 | 21 |
| Dec. 31, 1954 | 66,000+ | 111,000 | 330,000 | 33 |
| Dec. 31, 1957 | 47,000 | 115,000 | 409,000 | 28 |
| Dec. 31, 1958 | 44,200 | 102,000 | 435,800 | 23 |
| Dec. 31, 1959 | 57,000 | 107,000 | 462,700 | 23 |
| Dec. 31, 1960 | 58,000 | 98,000 | 489,300 | 20 |
| Dec. 31, 1961 | 50,000 | 80,400 | 516,500 | 16 |
| Dec. 31, 1962 | 48,000 | 79,000 | 544,100 | 15 |
| Dec. 31, 1963 | 59,000 | 576,700 | ||
| Dec. 31, 1964 | 63,000 | 114,225 | 609,300 | 19 |
| Dec. 31, 1965 | 63,000 | 95,800 | 636,000 | 15 |
| * Pumpage from well field by City of Wichita. | ||||
As of December 31, 1965, only 15 percent of the water pumped since 1940 by the City of Wichita has come from storage, and 85 percent has been replaced by recharge. As the zone of pumping influence grows and the period of pumping increases, the percentage of water pumped from storage may become less. This percentage can approach, but not reach, zero. So long as pumping continues, some of the aquifer will remain dewatered; on the other hand, should pumping be reduced substantially during a few wet years or for some other reason, the shape of the zone of pumping influence might be changed significantly. This is happening presently as the city shifts some of its pumping load to the Cheney surface-water reservoir.
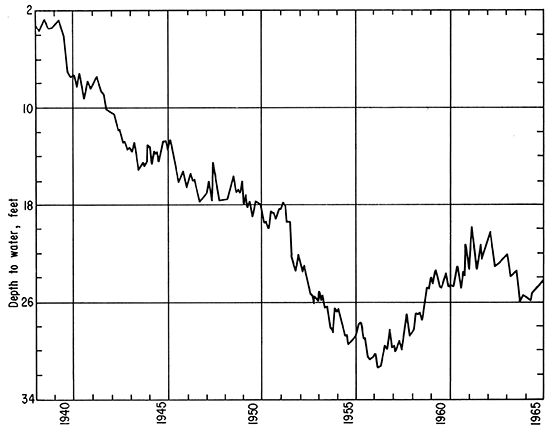
Figure 17 is a hydrograph of federal observation well no. 886, in the heart of the well field, showing the change in water level in response to both discharge and recharge. The curve shows continuous decline until the spring of 1957 when recharge began to exceed discharge and recovery of the water table began. Note the decreasing rate of recovery by 1962.
Figure 17--Hydrograph of well no. 886, Wichita well field, showing typical decline of the water table in the zone of pumping influence.
The average rate of recharge in the Wichita well field has been considered to be about 6 inches per year. A brief analysis of Table 8 shows that at least 540,000 (636,000 minus 95,800) acre-feet of recharge has occurred in the past 25 years. The size of the zone of pumping influence by December 31, 1965, was 63,000 acres; thus, the recharge was about 4 inches per year. In this computation, the author has assumed that the 95,800 acre-feet of loss in storage resulted from pumping by the City of Wichita. This is not entirely true, as allowance should be made for some, perhaps considerable, loss in storage caused by evapotranspiration in the shallow-water areas and for small amounts of irrigation. The loss by irrigation represents only a small percentage of the total withdrawal; therefore, the original value of 6 inches for average annual recharge or 320 acre-feet per square mile per year as computed by Williams and Lohman (1949) and recomputed by Stramel (1956) is in the correct order of magnitude.
Whether or not a decline in water levels should be allowed and under what conditions are questions which are beyond the scope of this report. They are legal and social questions as well as technical. The question of land damage or land benefits resulting from pumping should be the basis for a comprehensive study in the future. However, it is a certainty that if the Equus-beds are to be developed to their full potential, water levels must be allowed to fluctuate, and some permanent water-level decline will result.
In order to develop a maximum quantity of water, both ground water and surface water must be considered as interrelated. It is not suggested that all of the water in underground storage be withdrawn, but rather that levels be determined within which the water level may be allowed to fluctuate between periods of drought and subsequent recharge.
The hydrology of the Wichita well field can best be described as simple in general yet extremely complex in detail. Although hydrogeologic details are not available for the greater Equus-beds area, it is assumed that the same holds true for the whole area. The Equus beds can be described as a huge underground reservoir with a "leaky roof."
The Pleistocene deposits contain only a few lenses of silt and clay, whereas the Pliocene contains numerous and sometimes thick and extensive lenses. The water in the Pleistocene deposits generally is under water-table conditions, although in some places it is under temporary or leaky-artesian conditions; water in the Pliocene section occurs under temporary or leaky-artesian conditions throughout the well field. Under these conditions, considerable vertical leakage from one zone to another is expected under the differential heads discussed on page 12.
On December 31, 1954, water levels in the Wichita well field were declining, primarily because of extensive pumping and a lack of precipitation for recharge. This declining phase continued until April 1957, when average or above-average precipitation occurred, resulting in considerable recharge.
Irrigation pumpage since the drought years (1952-56) has decreased as a direct result of the near or above-average precipitation; however, water demand for irrigation from the Equus beds is expected to increase substantially in the future.
Decline in the water level in those parts of the well field near the Arkansas and Little Arkansas rivers has not progressed sufficiently to assure recharge from either of the rivers, although there may be some recharge through the lower artesian zones. The Little Arkansas River is the natural spillway of the Equus beds and continues to be a gaining stream; that is, water is being discharged from the aquifer to the stream.
In the shallow-water (less than 7-15 feet) areas of the well field considerable water is still being discharged by evapotranspiration.
The area of the zone of pumping influence was smaller in December 31, 1965, than it was December 31, 1954-its areal extent reached a maximum near the end of 1956. Water levels have recovered about 13 feet in the center of the zone of pumping influence, and the area has been reduced from greater than 120 square miles to 98 square miles in the past 8 years. This is the result of the high rate of precipitation and recharge and the transfer of part of the pumping to the Cheney Reservoir since the spring of 1957. However, if the water levels had not been drawn down by pumping, it is probable that much of this recharge would have been rejected or lost to evapotranspiration.
As of December 31, 1965, only 15 percent of the water pumped by the City from the well field since 1940 has come from storage and 85 percent of the water pumped has been replaced by recharge or salvaged from evapotranspiration.
Recharge to the principal aquifers in the northern one-third of the Wichita well field is less than the recharge in the southern two-thirds of the well field. The recharge rate since about 1937 has averaged about 6 inches per year. The recharge rate in the area north of the Little Arkansas River is believed to be somewhat less than the average rate in the Wichita well field. Dewatering of the aquifers during periods of drought creates a place to store water.
The Equus beds will support the present ground-water development for municipal, industrial, and irrigation purposes. As only a part of the potential yield of the aquifer has been developed, the Equus-beds can produce perennially a volume of water considerably larger than that presently produced. The maximum annual development that can be supported by the Equus beds will depend on the water-management practices undertaken in the Little Arkansas River basin and the methods of development, including the intermittent use of surface water from the Little Arkansas River.
Appraisal of the effects of future pumpage and recharge on the water table in the well field should be continued, and periodically the results of these studies should be published.
Bayne, C. K., 1956, Geology and ground-water resources of Reno County, Kansas: Kansas Geol. Survey, Bull. 120, 130 p., 23 fig. 3 pl. [available online]
Bayne, C. K., 1960, Geology and ground-water resources of Harper County, Kansas: Kansas Geol. Survey, Bull. 143, 184 p., 17 fig., 5 pl. [available online]
Bayne, C. K., 1962, Geology and ground-water resources of Cowley County, Kansas: Kansas Geol. Survey, Bull. 158, 219 p., 8 fig., 11 pl. [available online]
Broeker, M. E., and Fishel, V. C., 1961, Ground-water levels in observation wells in Kansas, 1960: Kansas Geol. Survey, Bull. 153, 183 p., 27 fig.
Broeker, M. E., and Fishel, V. C., 1962, Ground-water levels in observation wells in Kansas, 1961: Kansas Geol. Survey, Bull. 159, 166 p., 28 fig.
Broeker, M. E., and Winslow, J. D., 1963, Ground-water levels in observation wells in Kansas, 1962: Kansas Geol. Survey, Bull. 167, 89 p., 23 fig.
Broeker, M. E., and Winslow, J. D., 1964, Ground-water levels in observation wells in Kansas, 1963: Kansas Geol. Survey, Bull. 173, 94 p., 21 fig.
Broeker, M. E., and Winslow, J. D., 1965, Ground-water levels in observation wells in Kansas, 1964: Kansas Geol. Survey, Bull. 177, 93 p., 15 fig.
Fent, O. S., 1950, Geology and ground-water resources of Rice County, Kansas: Kansas Geol. Survey, Bull. 85, 142 p., 11 fig., 1 pl. [available online]
Fishel, V. C., and Broeker, M. E., 1960, Ground-water levels in observation wells in Kansas, 1959: Kansas Geol. Survey, Bull. 146, 174 p., 25 fig.
Fishel, V. C., Gulley, E. L., and Reavis, E. L., 1959, Ground-water levels in observation wells in Kansas, 1958: Kansas Geol. Survey, Bull. 141, 146 p., 24 fig.
Fishel, V. C., and Mason, B. J., 1957, Ground-water levels in observation wells in Kansas, 1956: Kansas Geol. Survey, Bull. 125, 158 p., 22 fig.
Fishel, V. C., and Mason, B. J., 1958, Ground-water levels in observation wells in Kansas, 1957: Kansas Geol. Survey, Bull. 131, 152 p., 24 fig.
Frye, J. C., and Leonard, A. B., 1952, Pleistocene geology of Kansas: Kansas Geol. Survey, Bull. 99, 230 p., 17 fig., 19 pl. [available online]
Kansas Water Resources Board, 1960, Preliminary appraisal of Kansas Water problems, Section 4, Lower Arkansas unit: Kansas Water Resources Board, 177 p., 44 fig., 7 pl.
Lane, C. W., 1960, Geology and ground-water resources of Kingman County, Kansas: Kansas Geol. Survey, Bull. 144, 171 p., 13 fig., 3 pl. [available online]
Lane, C. W., and Miller, D. E., 1965, Geohydrology of Sedgwick County, Kansas: Kansas Geol. Survey Bull. 176, 100 p., 30 fig., 4 pl. [available online]
Lohman, S. W., and Frye, J. C., 1940, Geology and ground-water resources of the "Equus Beds" area in south-central Kansas: Economic Geol., v. 35, no. 7, p. 839-866, 5 fig.
Stramel, G. J., 1956, Progress report on the ground-water hydrology of the Equus beds area, Kansas: Kansas Geol. Survey, Bull. 119, pt. 1, p. 1-59, fig. 1-31. [available online]
Stramel, G. J., Various departmental file reports of the Wichita Water Department, 1956-66.
U.S. Geological Survey, Water levels and artesian pressure in observation wells in the United States, pt. 3, North Central states: Issued annually 1935-55 as Water-Supply Papers.
Walters, K. L., 1961, Geology and ground-water resources of Sumner County, Kansas: Kansas Geol. Survey, Bull. 151, 198 p., 11 fig., 4 pl. [available online]
Williams, C. C., 1946, Ground-water conditions in Arkansas River valley in the vicinity of Hutchinson, Kansas: Kansas Geol. Survey, Bull. 64, pt. 5, p. 149-216, fig. 1-11. [available online]
Williams, C. C., and Lohman, S. W., 1947, Methods used in estimating the ground-water supply in the Wichita, Kansas well-field area: Am. Geophys, Union Trans., v. 28, no. 1, p. 120-131, fig. 1-10.
Williams, C. C., and Lohman, S. W., 1949, Geology and ground-water resources of a part of south-central Kansas, with special reference to the Wichita municipal water supply: Kansas Geol. Survey, Bull. 79, 455 p., 31 fig., 34 pl. [available online]
Kansas Geological Survey
Placed on web May 26, 2015; originally published May 1967.
Comments to webadmin@kgs.ku.edu
The URL for this page is http://www.kgs.ku.edu/Publications/Bulletins/187_2/index.html