![]()
Prev Page--Water-bearing Materials || Next Page--Chemical Character
Water Table and Movement of Ground Water
The depth to the water table in the Ingalls area ranges from about 5 to 140 feet below the land surface. The Arkansas River valley is a shallow-water area where the depth to the water table is generally less than 30 feet and, in much of the area, particularly south of the river, less than 10 feet. North of the river the water table is slightly deeper.
The depth to the water table in the dune-sand area ranges from about 10 to 80 feet below the land surface and may range widely within relatively short distances because of local relief of the dune topography. In the upland north of Arkansas River, the depth to the water table in the Ogallala formation ranges from about 90 to 140 feet.
Plate 1 shows the configuration of the water table in the Ingalls area by means of water-table contours. The slope of the water table determines the rate and direction of movement of ground water; the movement is always down slope at right angles to the water-table contours, as shown in Plate 1 by light dashed lines referred to as "flow lines." In the Ingalls area it is generally eastward.
The unequal additions of water to the ground-water reservoir and the differences in permeability of the water-bearing materials are probably the most significant reasons why the shape of the water table is irregular. Ground water in the Ingalls area moves generally toward Arkansas River, and the water table as shown by the contours has a tendency to steepen as it approaches the river. This steepening is apparent south of Ingalls.
Discharge of ground water into Arkansas River is the only discharge into a stream in the area, and it affects the slope of the water table near the river. The slope of the water table toward the river from the north is less than the slope from the south. If the transmissibility of the water-bearing materials is equal, the greater slope from the south indicates that more water is draining to Arkansas River from the dune-sand area south of the river. Ground water discharges perennially into Arkansas River from the south. At times during the irrigation season, the water table on the north side of the river is lowered enough by pumping to induce some infiltration of river water into the ground-water reservoir.
The slope of the water table ranges from about 30 feet to about 3 feet per mile, and it averages about 8 feet per mile. The average gradient of Arkansas River is 7 feet per mile. The quantity of ground water moving through a given cross-sectional area of water-bearing material can be calculated from the following formula:
Q = pAv = PIA,
where: Q = the quantity of water,
p = the porosity of the material,
P = the coefficient of permeability,
v = the velocity of the ground water,
I = the hydraulic gradient, and
A = the cross-sectional area.
The approximate rate of movement of water through the water-bearing materials is calculated by applying the above formula transposed as follows:
v = (PI / p)
If P is expressed as gpd/ft2 (Meinzer's unit), I in feet per mile, and p in percent, then v, in feet per day, is given by the following formula:
v = (PI / 395p)
In the alluvial deposits the hydraulic gradient is about 8 feet per mile, the porosity is about 30 percent, and aquifer tests indicate that the average permeability is about 5,000 gpd/ft2; therefore, the average velocity of the ground water is
v = [(5,000 X 8) / (395 X 30)] = 3.4 feet per day.
Owing to the high permeability of the alluvium, ground water moves readily through the water-bearing material in the valley.
The rate of movement of the water in the Ogallala formation, however, is slower than in the alluvium. In the Ogallala the average gradient is about 8 feet per mile, the porosity is about 30 percent, and aquifer tests indicate that the permeability averages about 200 gpd/ft2. Hence, the velocity of the ground water in the Ogallala formation is:
v = [(200 X 8) / (395 X 30)] = 0.14 foot per day, or 1.6 inches per day
Thus, in material of low permeability the velocity of ground water becomes very low. Even in material of high permeability the velocity of ground water is relatively low as compared to that of surface water. Low ground-water velocity explains why the water table under the sand dunes had not declined greatly in 1956 even after 4 years of drought. Water-table contours south of the river indicate also that in many places the vertical permeability beneath the dune sand is low. Logs of test holes show that beds of silt underlie much of the dune sand and retard the downward percolation of water. After periods of heavy precipitation, a semiperched water table exists under at least parts of the dune area. The horizontal permeability of the terrace deposits is probably very high, and water that enters the dune-sand area discharges at the base of the terrace as seepage springs, thus helping to recharge the alluvium.
Availability of Ground Water
The availability of ground water in the Ingalls area depends on the quantity of water in storage in the ground-water reservoir, recharge from precipitation, and flow of Arkansas River. Streamflow records have been studied by the Bureau of Reclamation and therefore have not been discussed in this report. The quantity of water in storage and the quantity of recharge are discussed below.
Quantity of Water in Storage
The saturated-thickness map (Fig. 20), prepared by superposing the water-table contour map (Pl. 1) on the bedrock contour map (Fig. 5) and drawing contours through points of equal thickness, shows that the saturated materials in the area have a minimum thickness of 110 feet. The deposits are thinnest in the northeastern part of the area and thickest in the southwest. The saturated thickness beneath the Arkansas valley ranges from about 110 to 200 feet.
The total volume of saturated material in the alluvium, Kansan deposits, and Ogallala formation in the area designated A-B-C-D on Figure 20 has been computed as about 28,000,000 acre-feet. The alluvium is about 1 1/4 miles wide, has an average thickness of 35 feet, and contains about 670,000 acre-feet of the saturated material. The Kansan deposits and Ogallala formation together contain somewhat more than 27,000,000 acre-feet of the saturated material.
The specific yield, the amount of water that will drain out of saturated material by gravity, has been estimated as 20 percent for the alluvium and 10 percent for the Kansan deposits and Ogallala formation. On the basis of a specific yield of 20 percent, the total amount of water available in the alluvium is about 130,000 acre-feet; on the basis of a specific yield of 10 percent, the total amount of water available in the Kansan deposits and Ogallala formation is about 2,700,000 acre-feet. Thus, a total of about 2,800,000 acre-feet of water would be available if the area A-B-C-D were drained completely. Obviously only a part of this quantity could be recovered practicably. In the Arkansas Valley the yields of wells screened in both the alluvium and the Ogallala formation would diminish very sharply if the alluvium were drained, because the Ogallala formation is much less permeable than the alluvium.
The 670,000 acre-feet of saturated alluvium lies along 24 miles of the valley length; thus there is about 28,000 acre-feet of saturated volume per mile of valley length. If 11 miles of valley length is used, as considered by the Bureau of Reclamation, there would be in this reach about 310,000 acre-feet of saturated alluvium. On the basis of a specific yield of 20 percent, the amount of water available from storage in the alluvium in the 11 miles of valley is about 62,000 acre-feet.
Recharge from Precipitation
The normal annual precipitation at Cimarron is 19.93 inches. Of the total precipitation, a part runs off directly on the surface, a part is evaporated, a part is transpired by plants from the zone of soil moisture, and a small part moves downward to the zone of saturation.
All recharge to the aquifer in the Ingalls area is derived from precipitation that falls within the area or areas to the west. Once the water becomes a part of the main ground-water body, it moves down gradient perpendicular to the water-table contours (Pl. 1) to points of discharge.
The amount of water added to or discharged from the groundwater reservoir is reflected in the fluctuations of the water levels in wells (Fig. 31). From 1940 through 1951 precipitation at Cimarron was above normal, and the trend of the water levels was upward during most of that period.
Figure 31—Five hydrographs showing fluctuations of water table in Ingalls area, one typical hydrograph at Garden City, and precipitation and cumulative departure from normal at Cimarron.
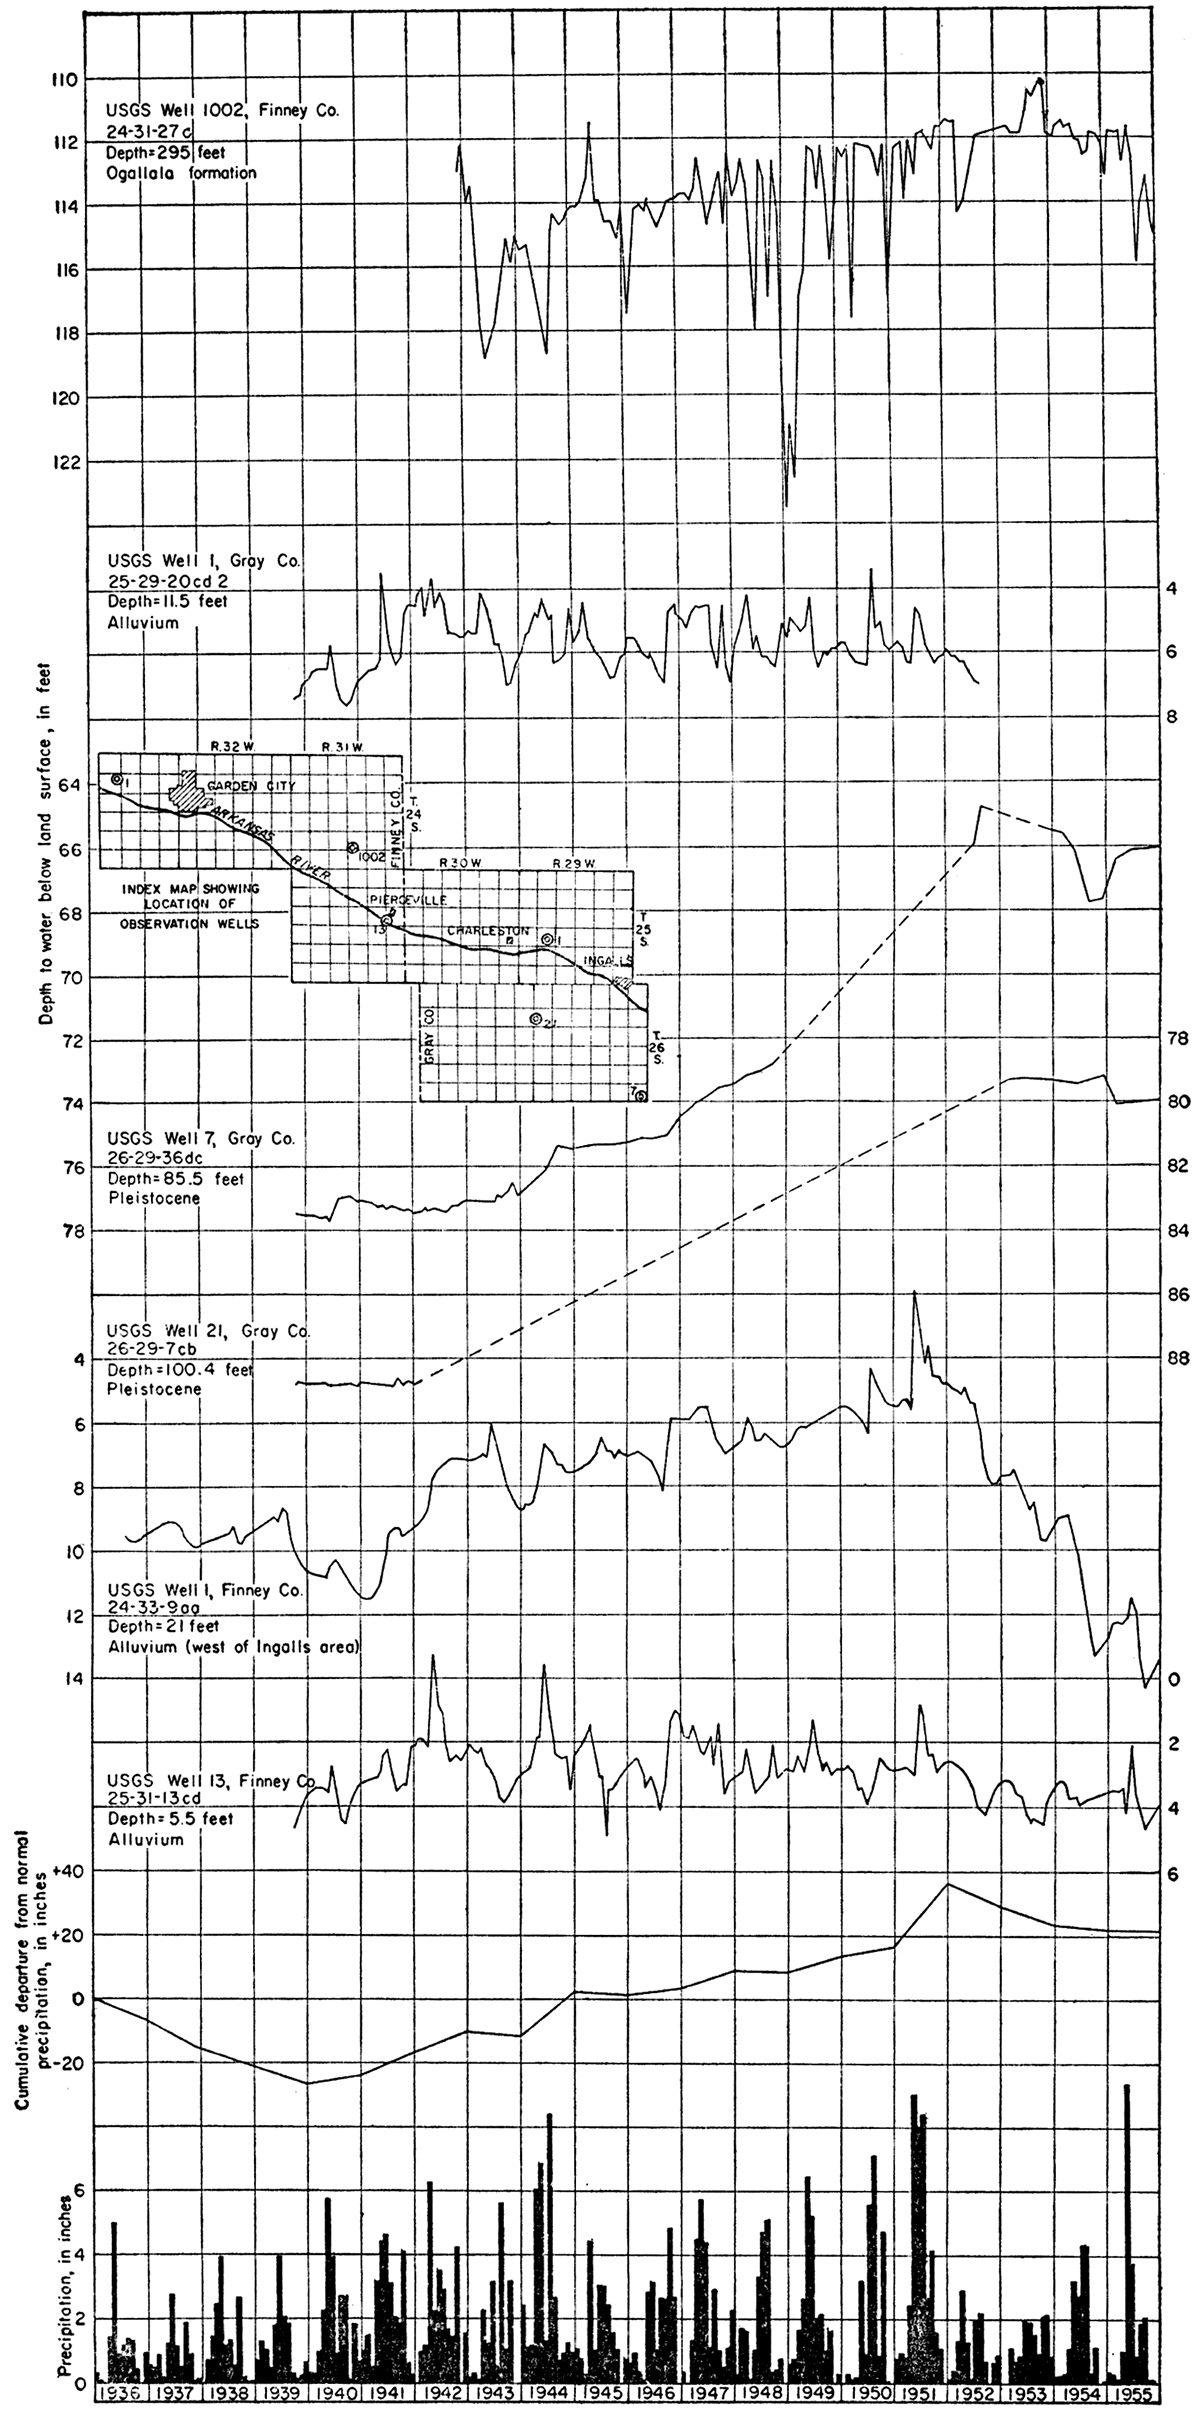
The water level in well 24-31-27c, which is in the Ogallala formation, rose steadily during the 1940's and had reached a record-high stage by November 1953. Owing to drought conditions since that time, the water level had declined about 5 feet by December 1955. In general, the hydrograph of this well shows that the amount of water in storage in 1956 was about the same as at the beginning of the period of record, but that during the period there has been some recharge and discharge. The amount of recharge probably is small, owing to the depth to water and the relatively impermeable material above the water table.
Although runoff from the upland north of the river is small, most of the water that infiltrates the ground is later evaporated or transpired by plants. The annual rate of recharge to the Ogallala formation is generally reported to be less than half an inch per year (Theis, 1937). Sufficient data are not available to determine the recharge in this area, however, and until such time as an accurate figure can be determined, a value of less than half an inch a year is assumed.
The hydrographs of two wells (26-29-36dc and 26-29-7cb) in the dune-sand area south of Arkansas River are shown in Figure 31. The dune sands are very permeable and readily absorb the precipitation that falls in the area. Much of the precipitation percolates downward rapidly and escapes evaporation and transpiration. After 1943 the water levels under the dunes rose steadily until they attained a record high in 1951. Since 1951 the rainfall has been deficient, and during much of that period the water levels have declined; nevertheless at the end of 1955 they were as much as 10 feet higher than at the end of the drought period in the 1930's.
The accumulation of ground water under the sand dunes and the slow release of that water to Arkansas River provide much of the increase in river flow between Pierceville and Cimarron. Data are not available to determine the amount of recharge in the dune sands, but it is much more than in the upland north of the river.
Much of the precipitation that falls on the valley alluvium readily passes through the porous soil and percolates downward to the water table. The water levels in the valley respond quickly to recharge but also recede sharply after recharge periods because the permeable alluvium allows water to move readily toward the river. The hydrographs of three wells (25-29-20cd2, 25-31-13cd, and 24-33-9aa) in the alluvium of the Arkansas Valley are given in Figure 31 and show the fluctuations of water level caused by recharge and discharge. They also show some interference from irrigation pumping and some rises and declines caused by rises and declines of Arkansas River.
When the water table is lowered below river stage by heavy pumping, Arkansas River is a source of recharge to alluvial deposits. During the irrigation season, pumping causes a drawdown of water levels in the valley on the north side of the river. During heavy pumping, the water level in the alluvium is lower than the river stage, and water from the river moves northward toward centers of pumping. Although considerable water is discharged into the alluvium from the dune sands and terrace deposits, probably little water moves into the alluvium from the Ogallala formation north of Arkansas River.
Considerable recharge occurs in irrigated fields from water that percolates through the sandy soil and back to the water table. The percentage of return water from irrigation is not known, but it probably amounts to as much as 20 percent. Most irrigation in the valley is by ditch irrigation and flooding. Considerable loss of water by downward percolation results generally from these methods of irrigation.
Additional Development of Water Supplies from Wells
The amount of water that can be pumped perennially from an underground reservoir depends not only on the amount of water in storage in the reservoir and the amount of recharge, but also on the ability of the reservoir to release water to wells.
Sufficient saturated material is available in the Ingalls area for the development of irrigation wells in most of the area. In part of the upland, however, wells having large yields cannot be developed from the Ogallala formation because of the low permeability locally. Well 25-29-14ab, one of the best irrigation wells pumping from the Ogallala formation in the upland, is 308 feet deep and yields 1,600 gpm. In general, the water-bearing materials become thinner east of this well, but sufficient saturated material is available to yield satisfactory supplies for some additional irrigation wells, if it contains permeable beds.
In the dune-sand area south of Arkansas River, the water-bearing materials are thick and fairly permeable, and many wells having yields of about 1,500 gpm can be developed. Little irrigation development has taken place south of Arkansas River, but the area is capable of supplying much additional water.
Many thousands of acre-feet of water have been pumped from the alluvium in the Arkansas valley in the last 50 years, and present data indicate that water is available for much additional pumping. Fluctuations of the water table in the Arkansas valley are influenced by use of the water for irrigation, but for the most part these are seasonal. To prevent overdevelopment, wells should be spaced so as to minimize mutual interference. Single-cased wells of good construction can be expected to yield as much as 1,000 gpm, and a battery of shallow wells, as much as 3,000 gpm. If declines of water levels in the valley alluvium are regionally great, the yields from wells can be expected to decline also, because the saturated alluvial material in the valley is relatively thin.
Arkansas River is cut into the alluvium and is hydraulically connected to the water in the alluvium. Therefore, the possibility of developing additional supplies from the alluvium is very closely related to the discharge of Arkansas River. In general, the water table slopes toward the river, and ground water discharges into the stream. This seepage of ground water into the river constitutes the streamflow during periods of drought. Water that is now being discharged into the river can be intercepted by wells. If enough water is pumped from storage, the water-table gradient will be reversed, and water will flow from the river toward areas of pumping. Hydrogeologic conditions are excellent for induced infiltration throughout the length of the river in the Ingalls area, and the alluvium can be made to function as a surface reservoir. The Renick and Norbert Irsik aquifer tests of the alluvium indicate that water can move readily from the river to a pumped well. The amount of induced infiltration will be limited by streamflow. How much of the total flow of the river can be salvaged is primarily a problem of design and of existing water rights, as possibly all base flow in the river could be captured. It is very doubtful, however, that all the flood flows could be captured by pumping from wells, as a large percentage of the floodwaters doubtless will move out of the area unless held or diverted by dams and levees.
Prev Page--Water-bearing Materials || Next Page--Chemical Character
Kansas Geological Survey, Geology
Placed on web Sept. 10, 2017; originally published July, 1958.
Comments to webadmin@kgs.ku.edu
The URL for this page is http://www.kgs.ku.edu/Publications/Bulletins/132/06_table.html