![]()
Prev Page--Water Table || Next Page--Well Records
Chemical Character of Water in the Ingalls Area
The chemical character of ground water is indicated by 12 analyses of water samples collected from wells in the Ingalls area and by two samples of water from Arkansas River. The analyses (Table 9) were made by H. A. Stoltenberg, Chemist, in the Water and Sewage Laboratory of the State Board of Health. The results of the analyses are given in parts per million; factors for converting parts per million of mineral constituents to equivalents per million are given in Table 10.
Table 9—Analyses of water from wells and river in Ingalls area. Analyzed by H. A. Stoltenberg. Dissolved constituents given in parts per million*.
| Well Number |
Location | Depth, feet |
Geologic source |
Date of collection |
Temp. (°F) |
Dissolved solids |
Silica (SiO2) |
Iron (Fe) |
Calcium (Ca) |
Magnesium (Mg) |
Sodium and potassium (Na + K) |
Bicarbonate (HCO3) |
Sulfate (SO4) |
Chloride (Cl) |
Fluoride (F) |
Nitrate (NO3) |
Hardness as CaCO3 | ||
|---|---|---|---|---|---|---|---|---|---|---|---|---|---|---|---|---|---|---|---|
| Total | Carbonate | Non- carbonate |
|||||||||||||||||
| T. 24 S., R. 30 W. | |||||||||||||||||||
| 24-30-32ca | NE SW sec. 32 |
303 | Ogallala formation |
4-11-1956 | 528 | 31 | 0.37 | 92 | 31 | 34 | 224 | 186 | 28 | 1.3 | 15 | 357 | 184 | 173 | |
| T. 25 S., R. 29 W. | |||||||||||||||||||
| 25-29-14ab | NW NE sec. 14 |
308 | Ogallala formation |
4-11-1956 | 523 | 29 | .06 | 84 | 33 | 39 | 227 | 178 | 30 | 0.9 | 17 | 345 | 186 | 159 | |
| 25-29-27cd | SE SW sec. 27. |
15 | Alluvium | 4-10-1956 | 1,530 | 14 | .14 | 194 | 62 | 208 | 251 | 822 | 68 | 1.0 | 40 | 739 | 206 | 533 | |
| T. 25 S., R. 30 W. | |||||||||||||||||||
| 25-30-19ad | SE NE sec. 19 |
15 | Alluvium | 4-10-1956 | 1,580 | 12 | 8.9 | 168 | 71 | 246 | 288 | 858 | 80 | 1.1 | 0.8 | 711 | 236 | 475 | |
| 25-30-19dd2 | SE SE sec. 19 |
15 | Alluvium | 4-10-1956 | 168 | 13 | .08 | 37 | 6.2 | 13 | 144 | 11 | 6 | .4 | 10 | 118 | 118 | 0 | |
| 25-30-22ac | SW NE sec. 22 |
41 | Alluvium | 4-10-1956 | 700 | 23 | .08 | 119 | 38 | 51 | 218 | 296 | 37 | .8 | 28 | 453 | 179 | 274 | |
| 25-30-24ca1 | NE SW sec. 24 |
16.5 | Alluvium | 4-10-1956 | 880 | 24 | .29 | 120 | 52 | 87 | 232 | 391 | 47 | 1.3 | 44 | 513 | 190 | 323 | |
| 25-30-25bc | SW NW sec. 25 |
15 | Alluvium | 4-10-1956 | 258 | 23 | .05 | 58 | 10 | 18 | 221 | 25 | 9 | .6 | 5.3 | 186 | 181 | 5 | |
| T. 2., S., R. 31 W. | |||||||||||||||||||
| 25-31-13ca2 | NE SW sec. 13 |
180 | Ogallala formation |
4-10-1956 | 274 | 20 | .10 | 45 | 15 | 29 | 202 | 50 | 9 | .7 | 4.9 | 174 | 166 | 8 | |
| 25-31-24bb | NW NW sec. 24 |
Arkansas River |
4-10-1956 | 1,770 | 13 | .49 | 213 | 76 | 245 | 248 | 1,000 | 85 | .9 | 8.8 | 844 | 204 | 640 | ||
| T. 26 S., R. 28 W. | |||||||||||||||||||
| 26-28-11bd1 | SE NW sec. 11 |
205 | Ogallala formation |
6-3-1954 | 261 | 20 | .08 | 49 | 9.3 | 22 | 189 | 35 | 9 | .6 | 2.6 | 160 | 155 | 5 | |
| T. 26 S., R. 29 W. | |||||||||||||||||||
| 26-29-2ac | SW NE sec. 2 |
Arkansas River |
4-10-1956 | 1,480 | 14 | .37 | 182 | 63 | 205 | 244 | 814 | 74 | .8 | 7.1 | 713 | 200 | 513 | ||
| 26-29-22aa** | NE NE sec. 22 |
86.5 | Pleistocene deposits |
12-9-1956 | 234 | 1.3 | 60 | 10 | 13 | 202 | 20 | 13 | .3 | 15 | 190 | 166 | 24 | ||
| T. 26 S., R 30 W. | |||||||||||||||||||
| 26-30-1bc** | SW NW sec. 1 |
70 | Pleistocene deposits |
12-10-1956 | 233 | .15 | 59 | 9.8 | 15 | 208 | 22 | 10 | .4 | 13 | 188 | 170 | 18 | ||
| * One part per million is equivalent to one pound of substance per million pounds of water or 8.33 pounds per million gallons of water. ** Kansas Geological Survey Bulletin 55. |
|||||||||||||||||||
Table 10—Factors for converting parts per million of mineral constituents to equivalents per million.
| Cation | Conversion factor | Anion | Conversion factor | |
|---|---|---|---|---|
| Ca++ | 0.0499 | HCO3- | 0.0164 | |
| Mg++ | .0822 | SO4-- | .0208 | |
| Na+ | .0435 | Cl- | .0282 | |
| NO3- | .0161 | |||
| F- | .0526 |
The dissolved solids in water samples from the Ingalls area ranged from 168 to 1,770 ppm. The concentrations were relatively low in samples of ground water from the Ogallala formation, ranging from 261 to 528 ppm. Two samples of ground water from the Pleistocene deposits south of Arkansas River in the sand dune area contained small amounts of dissolved solids (233 and 234 ppm), and two samples from the alluvium south of the river also contained small amounts (168 and 258 ppm). Conversely, samples collected from the alluvium north of the river contained large amounts of dissolved solids (ranging from 700 to 1,580 ppm). The concentration of dissolved solids in ground water in the alluvium north of the river became increasingly greater toward the river. The two samples of water from Arkansas River contained large amounts of dissolved solids and were very similar to samples from the alluvium a short distance north of the river.
The total hardness of water samples from the Ingalls area ranged from 118 to 844 ppm. Samples of water from Arkansas River were high in total hardness, especially non carbonate hardness, because of the large content of calcium and magnesium sulfates. Samples of water from wells 25-30-19ad and 25-29-27cd, approximately 400 feet north of Arkansas River, were very similar in both carbonate and non carbonate hardness to samples from Arkansas River (25-31-24bb and 26-29-2ac). Water in the Ogallala formation and in the Pleistocene and alluvial deposits south of Arkansas River is much softer than water from the river.
The sulfate content of the water samples ranged from 11 to 1,000 ppm. With the exception of the samples from Arkansas River and the samples from the alluvium north of the river, the water in the Ingalls area was low to moderate in sulfate content. The iron content of the water samples ranged from 0.05 to 8.9 ppm, but only five samples contained more than 0.3 ppm of iron. The fluoride content ranged from 0.3 to 1.3 ppm; the nitrate content, from 0.8 to 44 ppm; and the chloride content, from 6 to 85 ppm.
In general, the analyses indicate that water from the Ogallala formation and the alluvium and Pleistocene deposits south of the river is of relatively good quality. The water in Arkansas River at low flow and in the alluvium north of the river is of relatively poor quality.
North of the river considerable ground water is pumped from the alluvium during the irrigation season; this pumpage results in a lowering of water levels. As a result, water from the river, which is of poor quality, moves northward from the river to areas of pumping. Figure 32 shows graphically the mineral constituents of water from wells and Arkansas River and indicates that water of poor quality from Arkansas River is the source of the water of poor quality in the alluvium north of the river.
Figure 32—Graphic representation of analyses of water from wells and Arkansas River in Ingalls area.
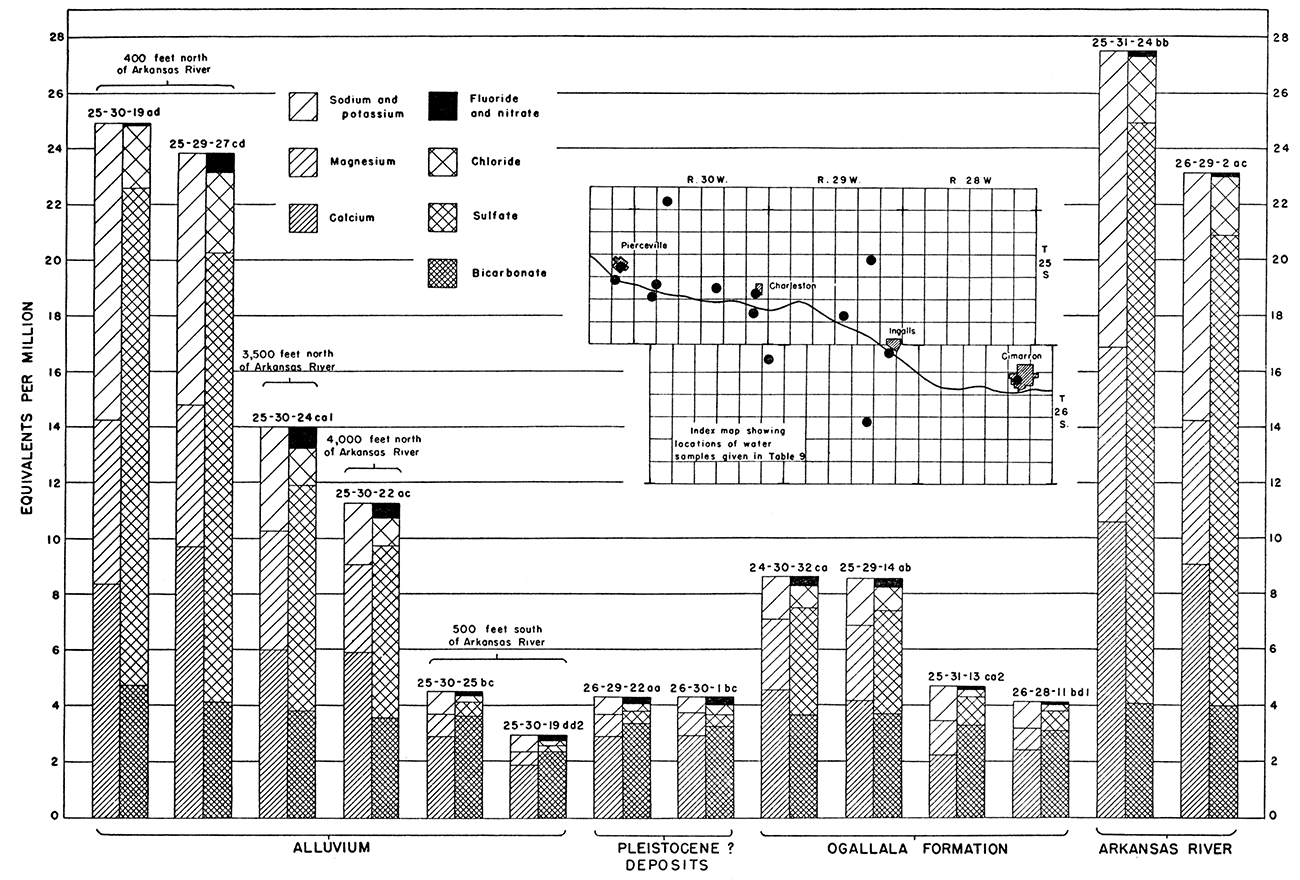
Water samples from wells 25-30-19ad and 25-29-27cd, about 400 feet north of Arkansas River, and from Arkansas River at Pierceville (25-31-24bb) and at Ingalls (26-29-2ac) are very similar in chemical quality (Fig. 32). The river sample taken at Ingalls is slightly better in quality than the river sample taken at Pierceville. Discharge of ground-water of good quality from the south probably dilutes the water in the river between Pierceville and Ingalls and accounts for the improved quality. Water in the river at the time of the sample collections was derived from ground-water discharge. The waters sampled from the two wells near the north bank of the river also differed slightly in quality.
Water samples from wells 25-30-24ca1 and 25-30-22ac are similar in quality. Both wells derive water from the alluvium. They are about 3,500 and 4,000 feet north of the river, respectively, and are near the north edge of the valley; water from Arkansas River has affected the quality very little, owing to dilution by recharge from precipitation and by inflow from the Ogallala formation to the north.
Water samples from wells 25-30-25bc, 25-30-19dd2, 26-29-22aa, and 26-30-1bc are similar in quality. These wells derive water from the alluvium, terrace deposits, and Pleistocene deposits south of the river where, in general, the quality is good. The ground-water gradient south of the river is for the most part toward the river, and water that moves into the alluvium south of the river is of good quality.
Water samples from wells 24-30-32ca and 25-29-14ab are similar in quality. These two wells obtain water from the Ogallala formation in the upland north of the river. Figure 32 shows that this water is better in quality than water in the alluvium north of the river but not so good as water in the alluvium south of the river.
Water samples from wells 25-31-13ca2 and 26-28-11bd1 are similar in quality. These two wells obtain water from the Ogallala formation underlying alluvium that contains water of poor quality. Water in the alluvium has been cased off in both wells, and the water obtained is of better quality than water from the Ogallala formation in the upland and is of about the same quality as water obtained south of the river. This suggests that most of the water in the Ogallala formation under the river moves from the dune-sand area and that the Ogallala formation below the valley alluvium contains confining layers.
Chemical Constituents in Relation to Irrigation
The evaluation of water with regard to its suitability for irrigation is based on methods outlined in Agricultural Handbook 60 of the U. S. Department of Agriculture (Richards and others, 1954).
Soil that was originally nonsaline and nonalkali may become unproductive if excessive soluble salts or exchangeable sodium are allowed to accumulate because of improper irrigation and soil-management practices or inadequate drainage. If the amount of water applied to the soil is not in excess of the amount needed by plants, water will not percolate downward below the root zone, . and an accumulation of mineral matter will form at that point. Likewise, impermeable soil zones near the surface can retard the downward movement of water and cause water logging of the soil and deposition of salts.
The characteristics of an irrigation water that seem to be most important in determining its quality are the total concentration of soluble salts and the relative activity of sodium ions in exchange 'reactions. For purposes of diagnosis and classification, the total concentration of soluble salts can be expressed in terms of electrical conductivity, which is a measure of the ability of the inorganic salts in solution to conduct an electrical current. The electrical conductivity can be determined accurately in the laboratory, or approximately by multiplying the total equivalents per million of calcium, magnesium, sodium, and potassium by 100, or by dividing the parts per million of total dissolved solids by 0.64. Water having an electrical conductivity of less than 750 micromhos per centimeter is generally satisfactory for irrigation insofar as the salt content is concerned, although salt-sensitive crops such as strawberries, green beans, and red clover may be adversely affected by water having an electrical conductivity of more than 250 micromhos per centimeter. Water in the range of 750 to 2,250 micromhos per centimeter is widely used, and satisfactory crop growth is obtained under good management and favorable drainage conditions, but saline conditions will develop if leaching and drainage are inadequate. Water having a conductivity of about 2,250 micromhos per centimeter has seldom been used successfully.
The sodium-adsorption ratio (SAR) of a water, which relates to the adsorption of sodium by the soil, may be determined by the formula
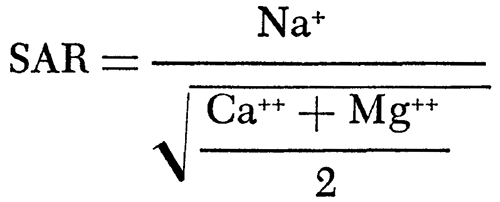
in which the ionic concentrations are expressed in equivalents per million. The sodium-adsorption ratio may be determined also by use of the nomogram shown in Figure 33. In using the nomogram, the concentration of sodium, expressed in equivalents per million, is plotted on the left-hand scale (A), and the concentration of calcium plus magnesium, expressed in equivalents per million, is plotted in reverse on the right-hand scale (B). The point at which a line connecting these two points intersects the sodium-adsorption-ratio scale (C) determines the sodium-adsorption ratio of the water. When the sodium-adsorption ratio and the electrical conductivity of a water are known, the suitability of the water for irrigation can be determined by graphically plotting the values on the diagram shown in Figure 34. Table 11 lists the sodium-adsorption ratios and approximate electrical conductivities of the 12 water samples plotted on Figures 33 and 34.
Figure 33—Nomogram for determining sodium-adsorption ratio of water.
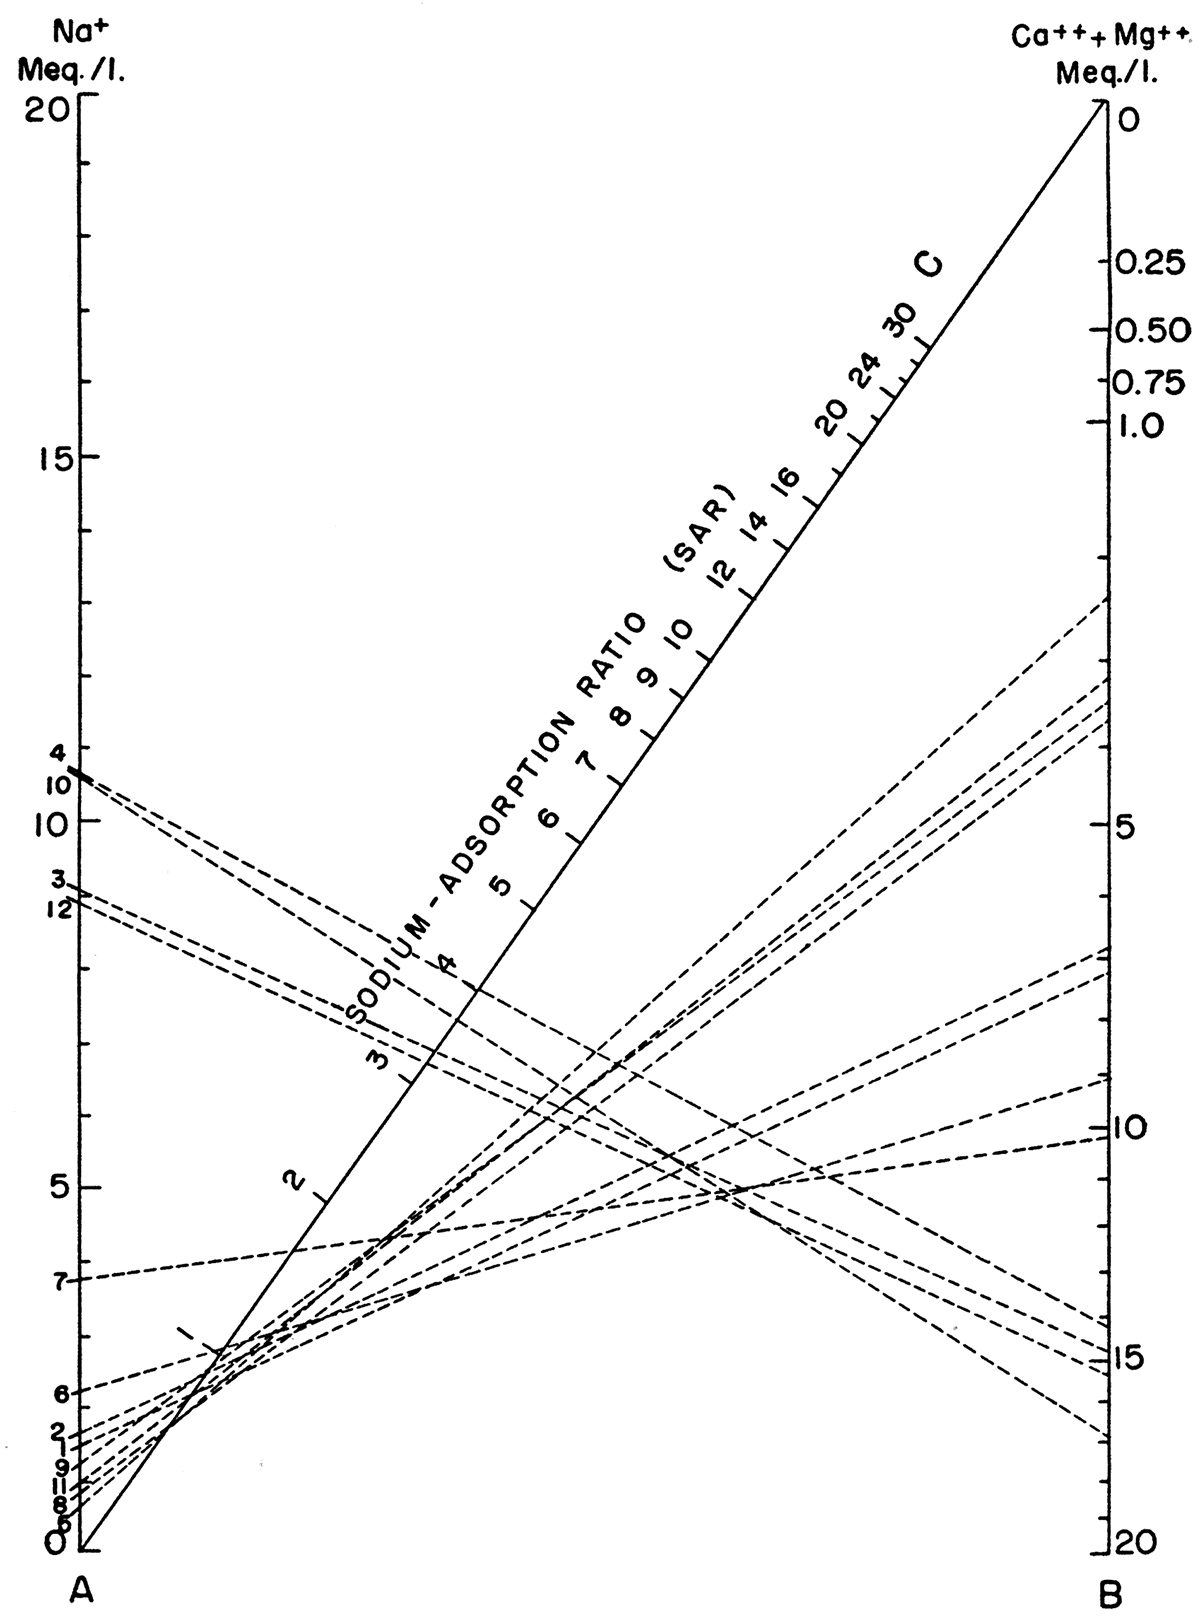
Figure 34—Classification of irrigation waters in the Ingalls area, (After Richards).
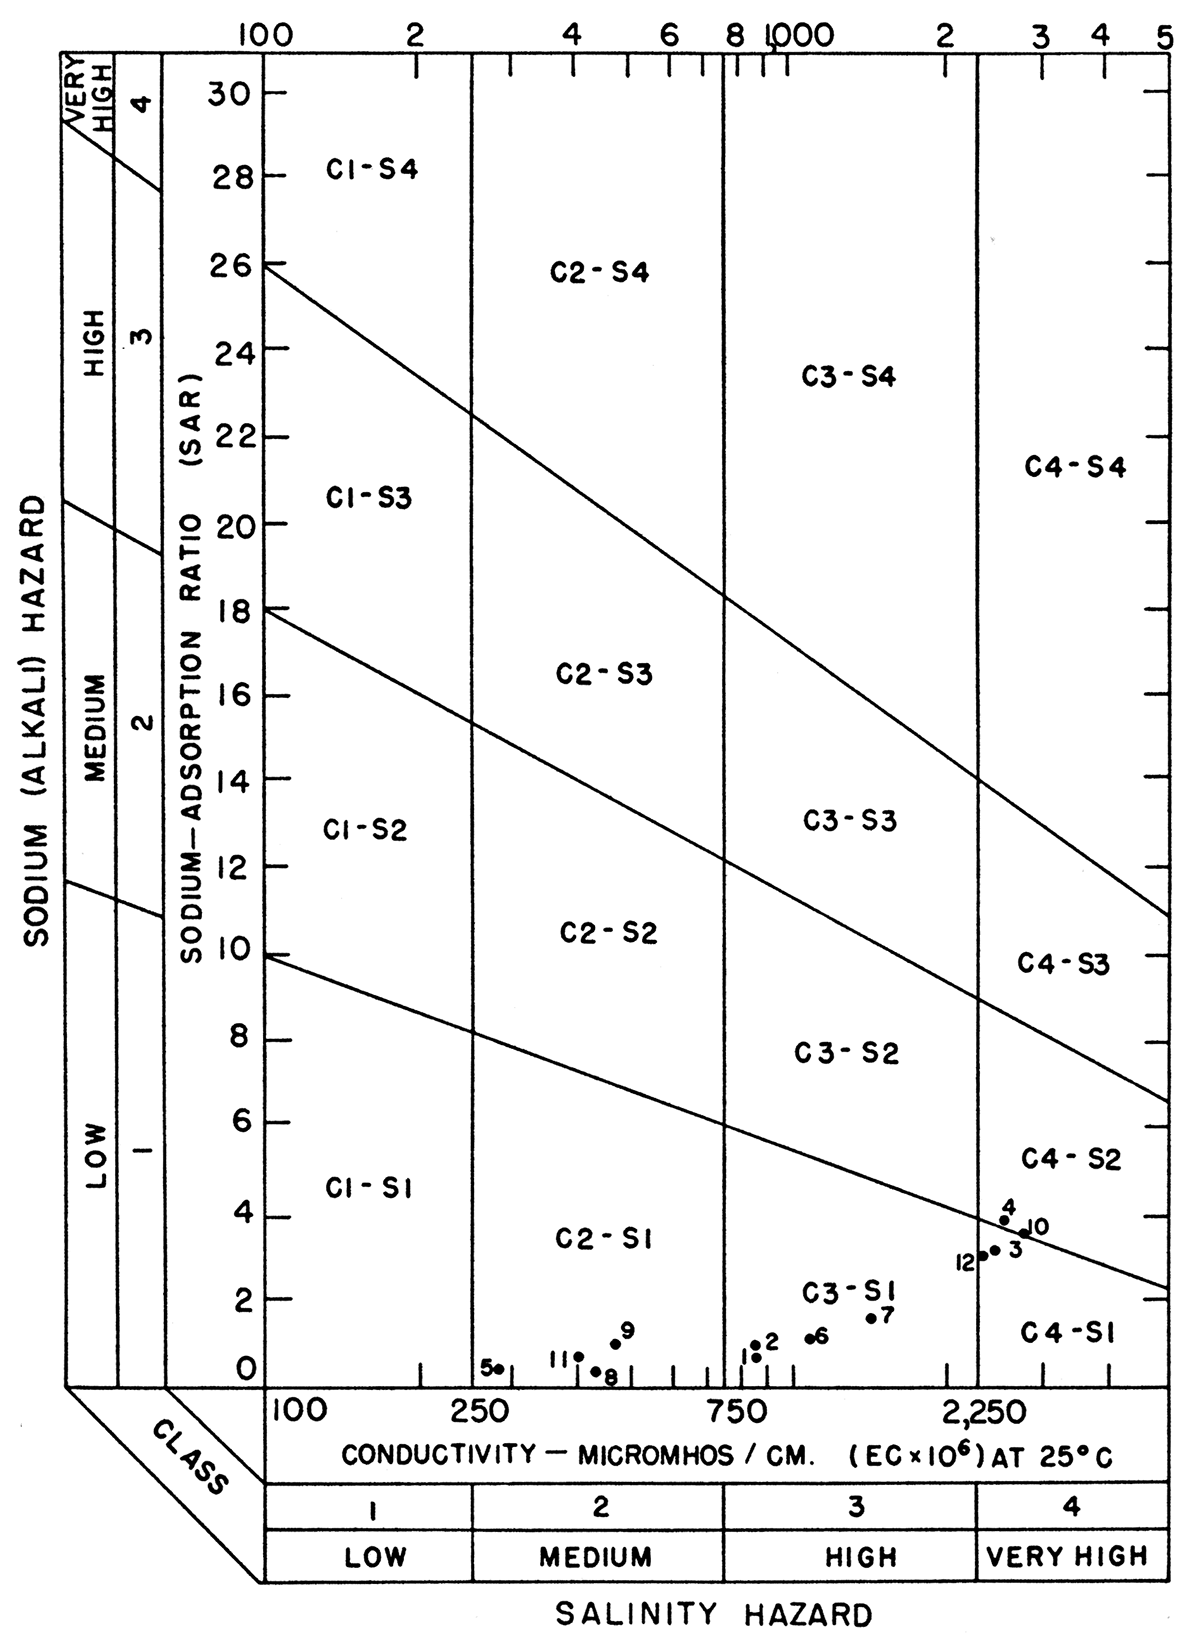
Table 11—Index numbers of samples shown in Figures 33 and 34 and sodiumadsorption ratio (SAR) and conductivity for which analyses are given in Table 9.
| Well Number |
Number used in figures 33 and 34 |
SAR | Approximate conductivity |
|---|---|---|---|
| 24-30-32ca | 1 | 0.7 | 850 |
| 25-29-14ab | 2 | .9 | 850 |
| 25-29-27cd | 3 | 3.3 | 2,400 |
| 25-30-19ad | 4 | 4.0 | 2,470 |
| 25-30-19dd2 | 5 | .5 | 275 |
| 25-30-22ac | 6 | 1.0 | 1,100 |
| 25-30-24ca1 | 7 | 1.7 | 1,400 |
| 25-30-25bc | 8 | .5 | 42.5 |
| 25-31-13ca2 | 9 | .9 | 450 |
| 25-31-24bb | 10 | 3.7 | 2,750 |
| 26-28-11bd1 | 11 | .7 | 400 |
| 26-29-2ac | 12 | 3.2 | 2,300 |
Low-sodium water (S1) can be used for irrigation on almost all soils with little danger of developing harmful levels of exchangeable sodium. Medium-sodium water (S2) can be used safely on coarsetextured or organic soils having good permeability, but it will present an appreciable sodium hazard in certain fine-textured soils, especially those not leached thoroughly. High-sodium water (S3) may produce harmful levels of exchangeable sodium in most soils and will require special soil management such as good drainage, thorough leaching, and addition of organic matter. Very high sodium water (S4) is generally unsatisfactory for irrigation unless special action is taken, such as addition of gypsum to the soil.
Low-salinity water (C1) can be used for irrigation of most crops on most soils with little likelihood that soil salinity will develop. Medium-salinity water (C2) can be used if a moderate amount of leaching occurs. Crops of moderate salt tolerance, such as potatoes, corn, wheat, oats, and alfalfa, can be irrigated with C2 water without special practices. High-salinity water (C3) cannot be used on soils with restricted drainage. Very high salinity water (C4) can be used only on certain crops and then only if special practices are followed.
In the diagram for the classification of irrigation waters in the Ingalls area (Fig. 34), samples 25-31-24bb and 26-29-2ac collected from Arkansas River and samples collected from wells 25-29-27cd and 25-S0-19ad, a short distance north of the river, are classed as of very high salinity (C4). The rest of the samples had a medium to high salinity hazard. All but one sample (4) had a low sodium hazard, however.
Prev Page--Water Table || Next Page--Well Records
Kansas Geological Survey, Geology
Placed on web Sept. 10, 2017; originally published July, 1958.
Comments to webadmin@kgs.ku.edu
The URL for this page is http://www.kgs.ku.edu/Publications/Bulletins/132/07_chem.html