State Production and Historical Info
Production data through November 2019 added February 26, 2020. Gas data for November is incomplete and will be corrected in future updates. County production is also available online.
Production
| Year | Oil | ||
|---|---|---|---|
| Production (bbls) |
Wells | Cumulative (bbls) |
|
| 2000 | 35,174,434 | 42,044 | 5,993,064,057 |
| 2001 | 34,124,322 | 41,445 | 6,027,188,379 |
| 2002 | 33,379,679 | 41,283 | 6,060,568,058 |
| 2003 | 33,972,033 | 41,173 | 6,094,540,091 |
| 2004 | 33,878,472 | 41,920 | 6,128,418,563 |
| 2005 | 33,619,258 | 43,012 | 6,162,037,821 |
| 2006 | 35,669,001 | 43,924 | 6,197,706,822 |
| 2007 | 36,590,232 | 43,411 | 6,234,297,054 |
| 2008 | 39,658,170 | 45,128 | 6,273,955,224 |
| 2009 | 39,472,421 | 45,634 | 6,313,427,645 |
| 2010 | 40,469,726 | 46,109 | 6,353,897,371 |
| 2011 | 41,499,072 | 47,164 | 6,395,396,443 |
| 2012 | 43,750,558 | 49,480 | 6,439,147,001 |
| 2013 | 46,845,544 | 51,817 | 6,485,992,545 |
| 2014 | 49,504,847 | 53,628 | 6,535,497,392 |
| 2015 | 45,467,244 | 53,573 | 6,580,964,636 |
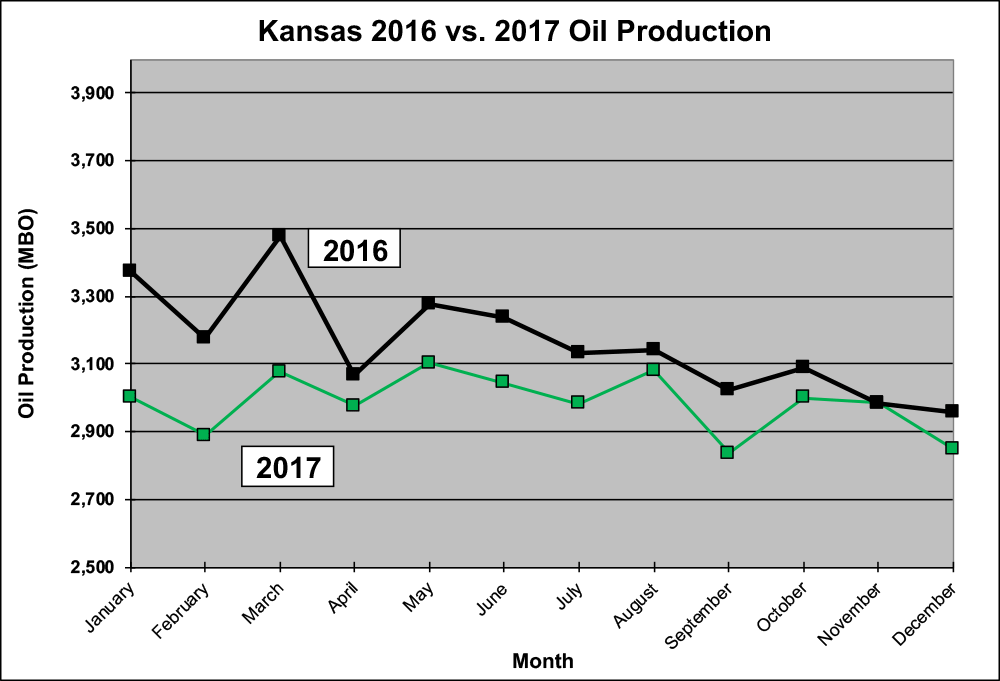
| 2016 | 37,943,896 | 52,889 | 6,618,908,532 |
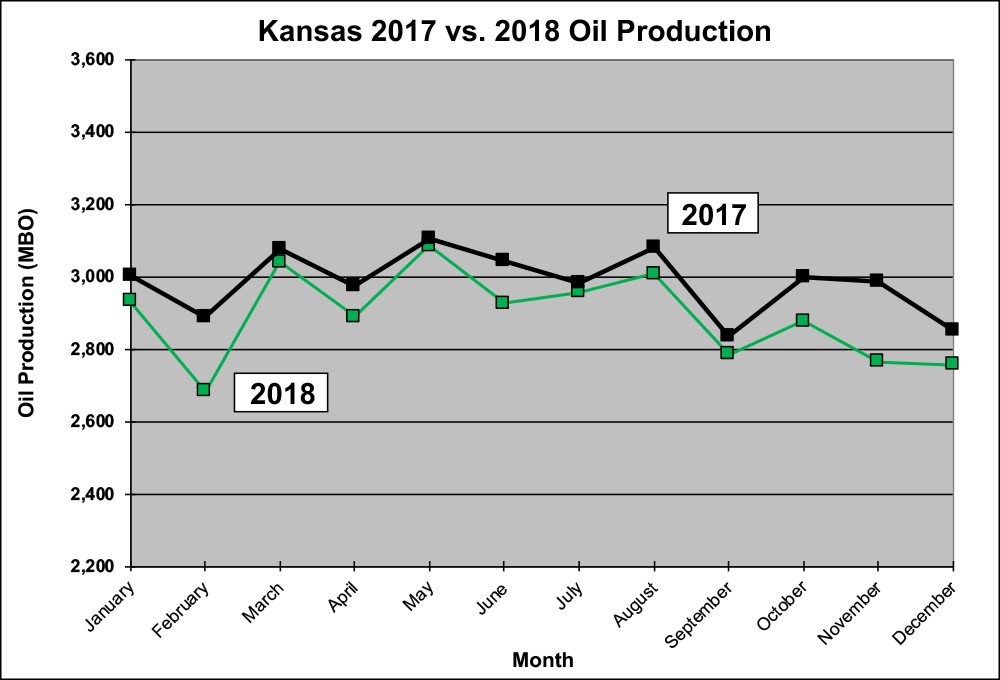
| 2017 | 35,824,866 | 52,758 | 6,654,733,398 |
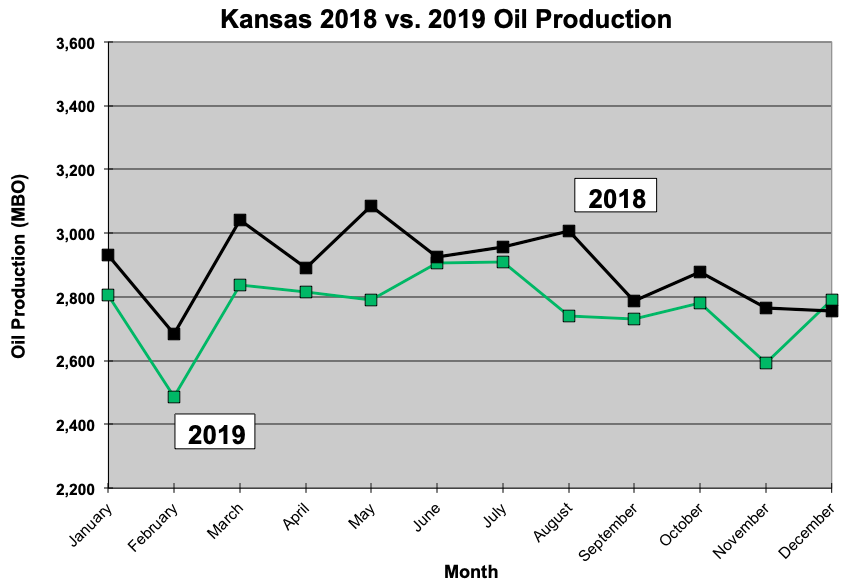
| 2018 | 34,715,789 | 52,278 | 6,689,449,187 |
| 2019 | 30,375,077 | 51,115 | 6,719,824,264 |
Data through November 2019.
Note: bbls is barrels.
| Year | Gas | ||
|---|---|---|---|
| Production (mcf) |
Wells | Cumulative (mcf) |
|
| 2000 | 533,658,257 | 17,097 | 35,090,589,589 |
| 2001 | 486,018,443 | 17,525 | 35,576,608,032 |
| 2002 | 458,920,155 | 17,883 | 36,035,528,187 |
| 2003 | 423,509,989 | 18,360 | 36,459,038,176 |
| 2004 | 400,593,044 | 19,145 | 36,859,631,220 |
| 2005 | 379,860,310 | 20,211 | 37,239,491,530 |
| 2006 | 375,433,250 | 22,553 | 37,614,924,780 |
| 2007 | 370,948,447 | 24,362 | 37,985,873,227 |
| 2008 | 378,718,724 | 25,613 | 38,364,591,951 |
| 2009 | 359,644,135 | 25,879 | 38,724,236,086 |
| 2010 | 334,365,998 | 25,319 | 39,058,602,084 |
| 2011 | 312,532,496 | 25,203 | 39,371,134,580 |
| 2012 | 299,051,000 | 24,866 | 39,670,185,580 |
| 2013 | 293,437,001 | 24,645 | 39,963,622,581 |
| 2014 | 288,090,641 | 24,764 | 40,251,713,222 |
| 2015 | 285,916,558 | 24,394 | 40,537,629,780 |
| 2016 | 246,716,821 | 23,478 | 40,784,346,601 |
| 2017 | 220,924,715 | 22,751 | 41,005,271,316 |
| 2018 | 202,467,692 | 22,020 | 41,207,739,008 |
| 2019 | 165,329,594 | 21,117 | 41,373,068,602 |
Data through November 2019.
Note: mcf is 1000 cubic feet.
November gas data is incomplete and will be corrected with future updates from KDOR.

Overview
- oil_gas_prod.ppt (PowerPoint file, updated March 4, 2014)
Files to download
Excel files with state and county annual production. Data from 1970 and after created from the lease-production database and aggregated into county form. Data for 1969 and before is typed in from published sources (Survey bulletins, special distribution publications, etc.).
Monthly production for all counties and state totals in Excel files. Previous decades grouped in ZIP archives.
- 1970s.zip
- 1980s.zip
- 1990s.zip
- 2000.xls
- 2001.xls
- 2002.xls
- 2003.xls
- 2004.xls
- 2005.xls
- 2006.xls
- 2007.xls
- 2008.xls
- 2009.xls
- 2010.xls
- 2011.xlsx
- 2012.xlsx
- 2013.xlsx
- 2014.xlsx
- 2015.xlsx
- 2016.xlsx
- 2017.xlsx (February 26, 2020)
- 2018.xlsx (February 26, 2020)
- 2019.xlsx (February 26, 2020)
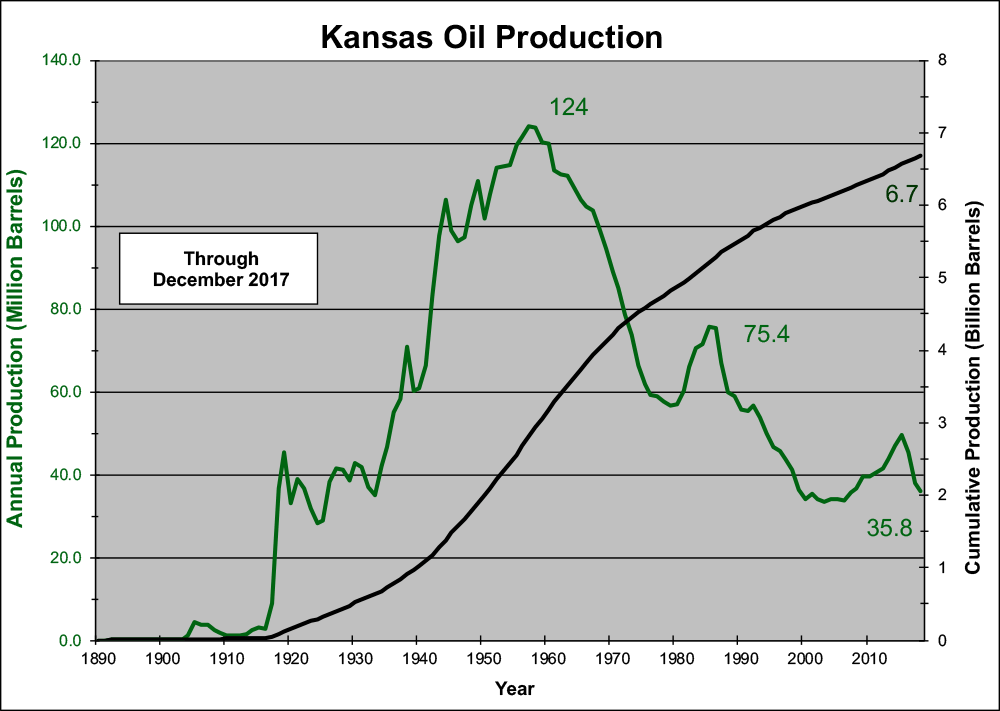
Historical Production
- history.xlsx--Excel file with total production since 1930 for entire state. (March 18, 2017)
- Yearly data until 1971.
- "Unattributed" oil and gas means historic production not assigned to any year.
- "Unattributed" data not added to cumulative columns.