KU Petroleum Engineering Field Trip

April 19, 2016

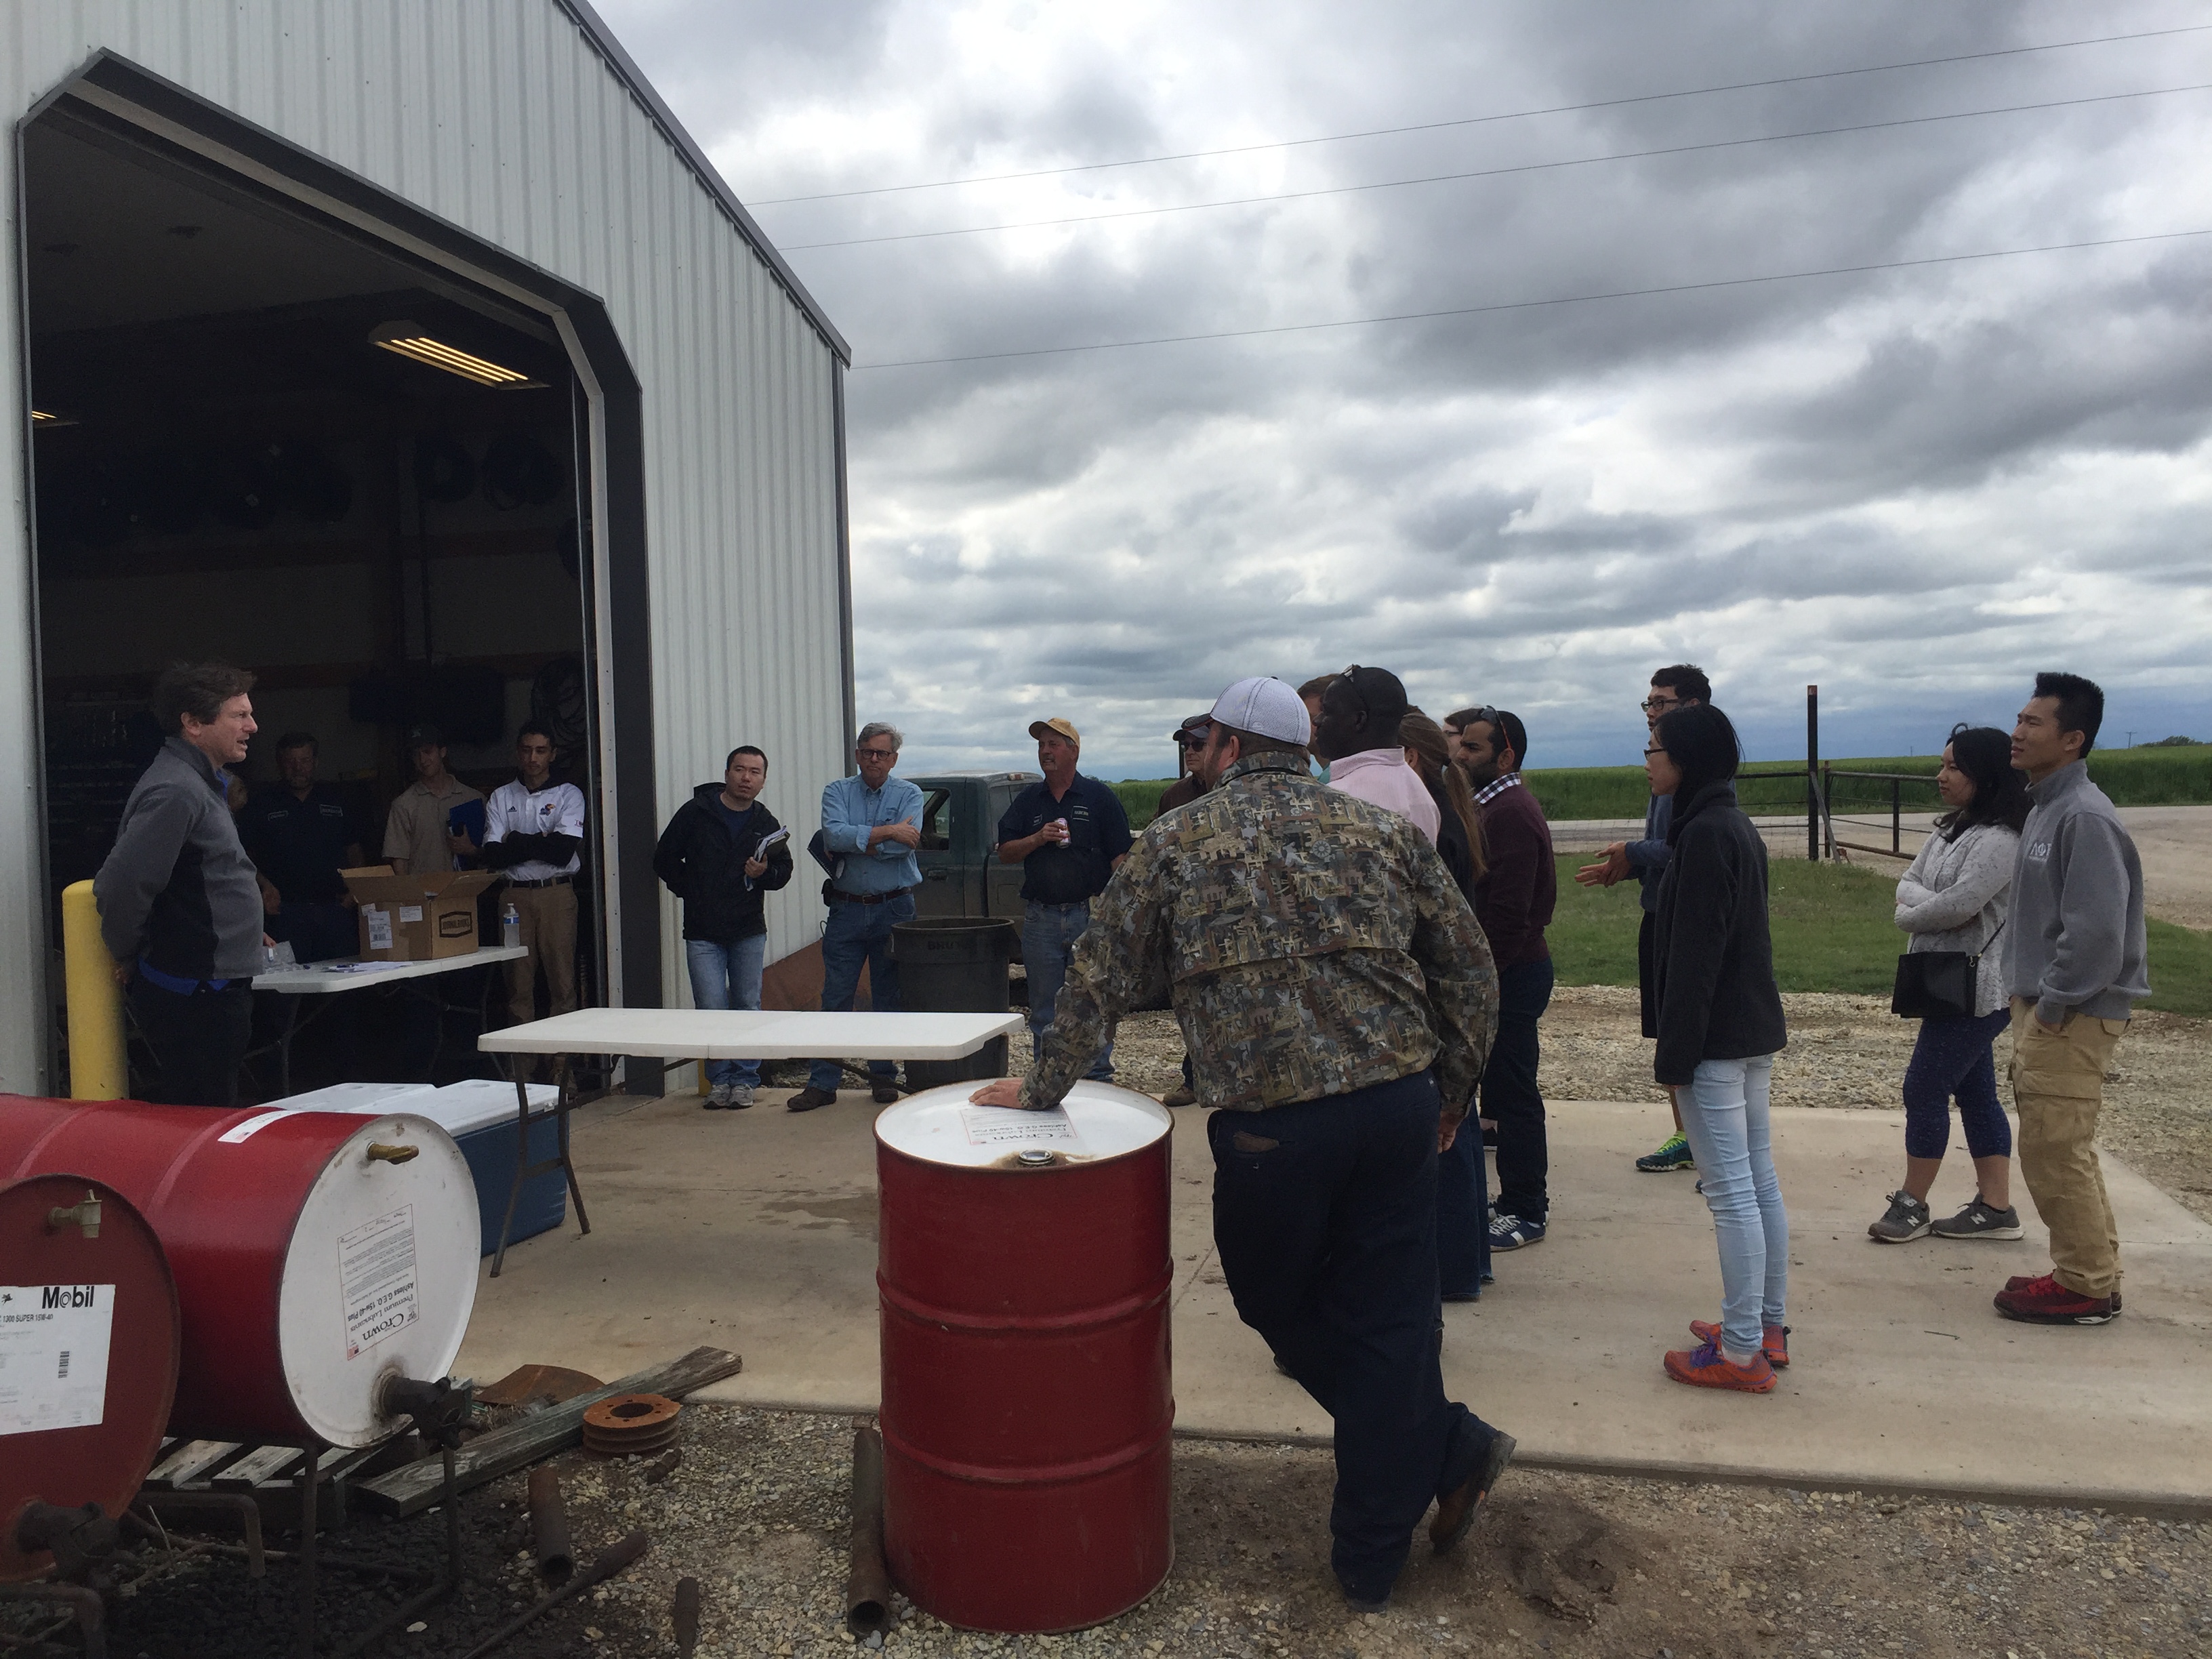
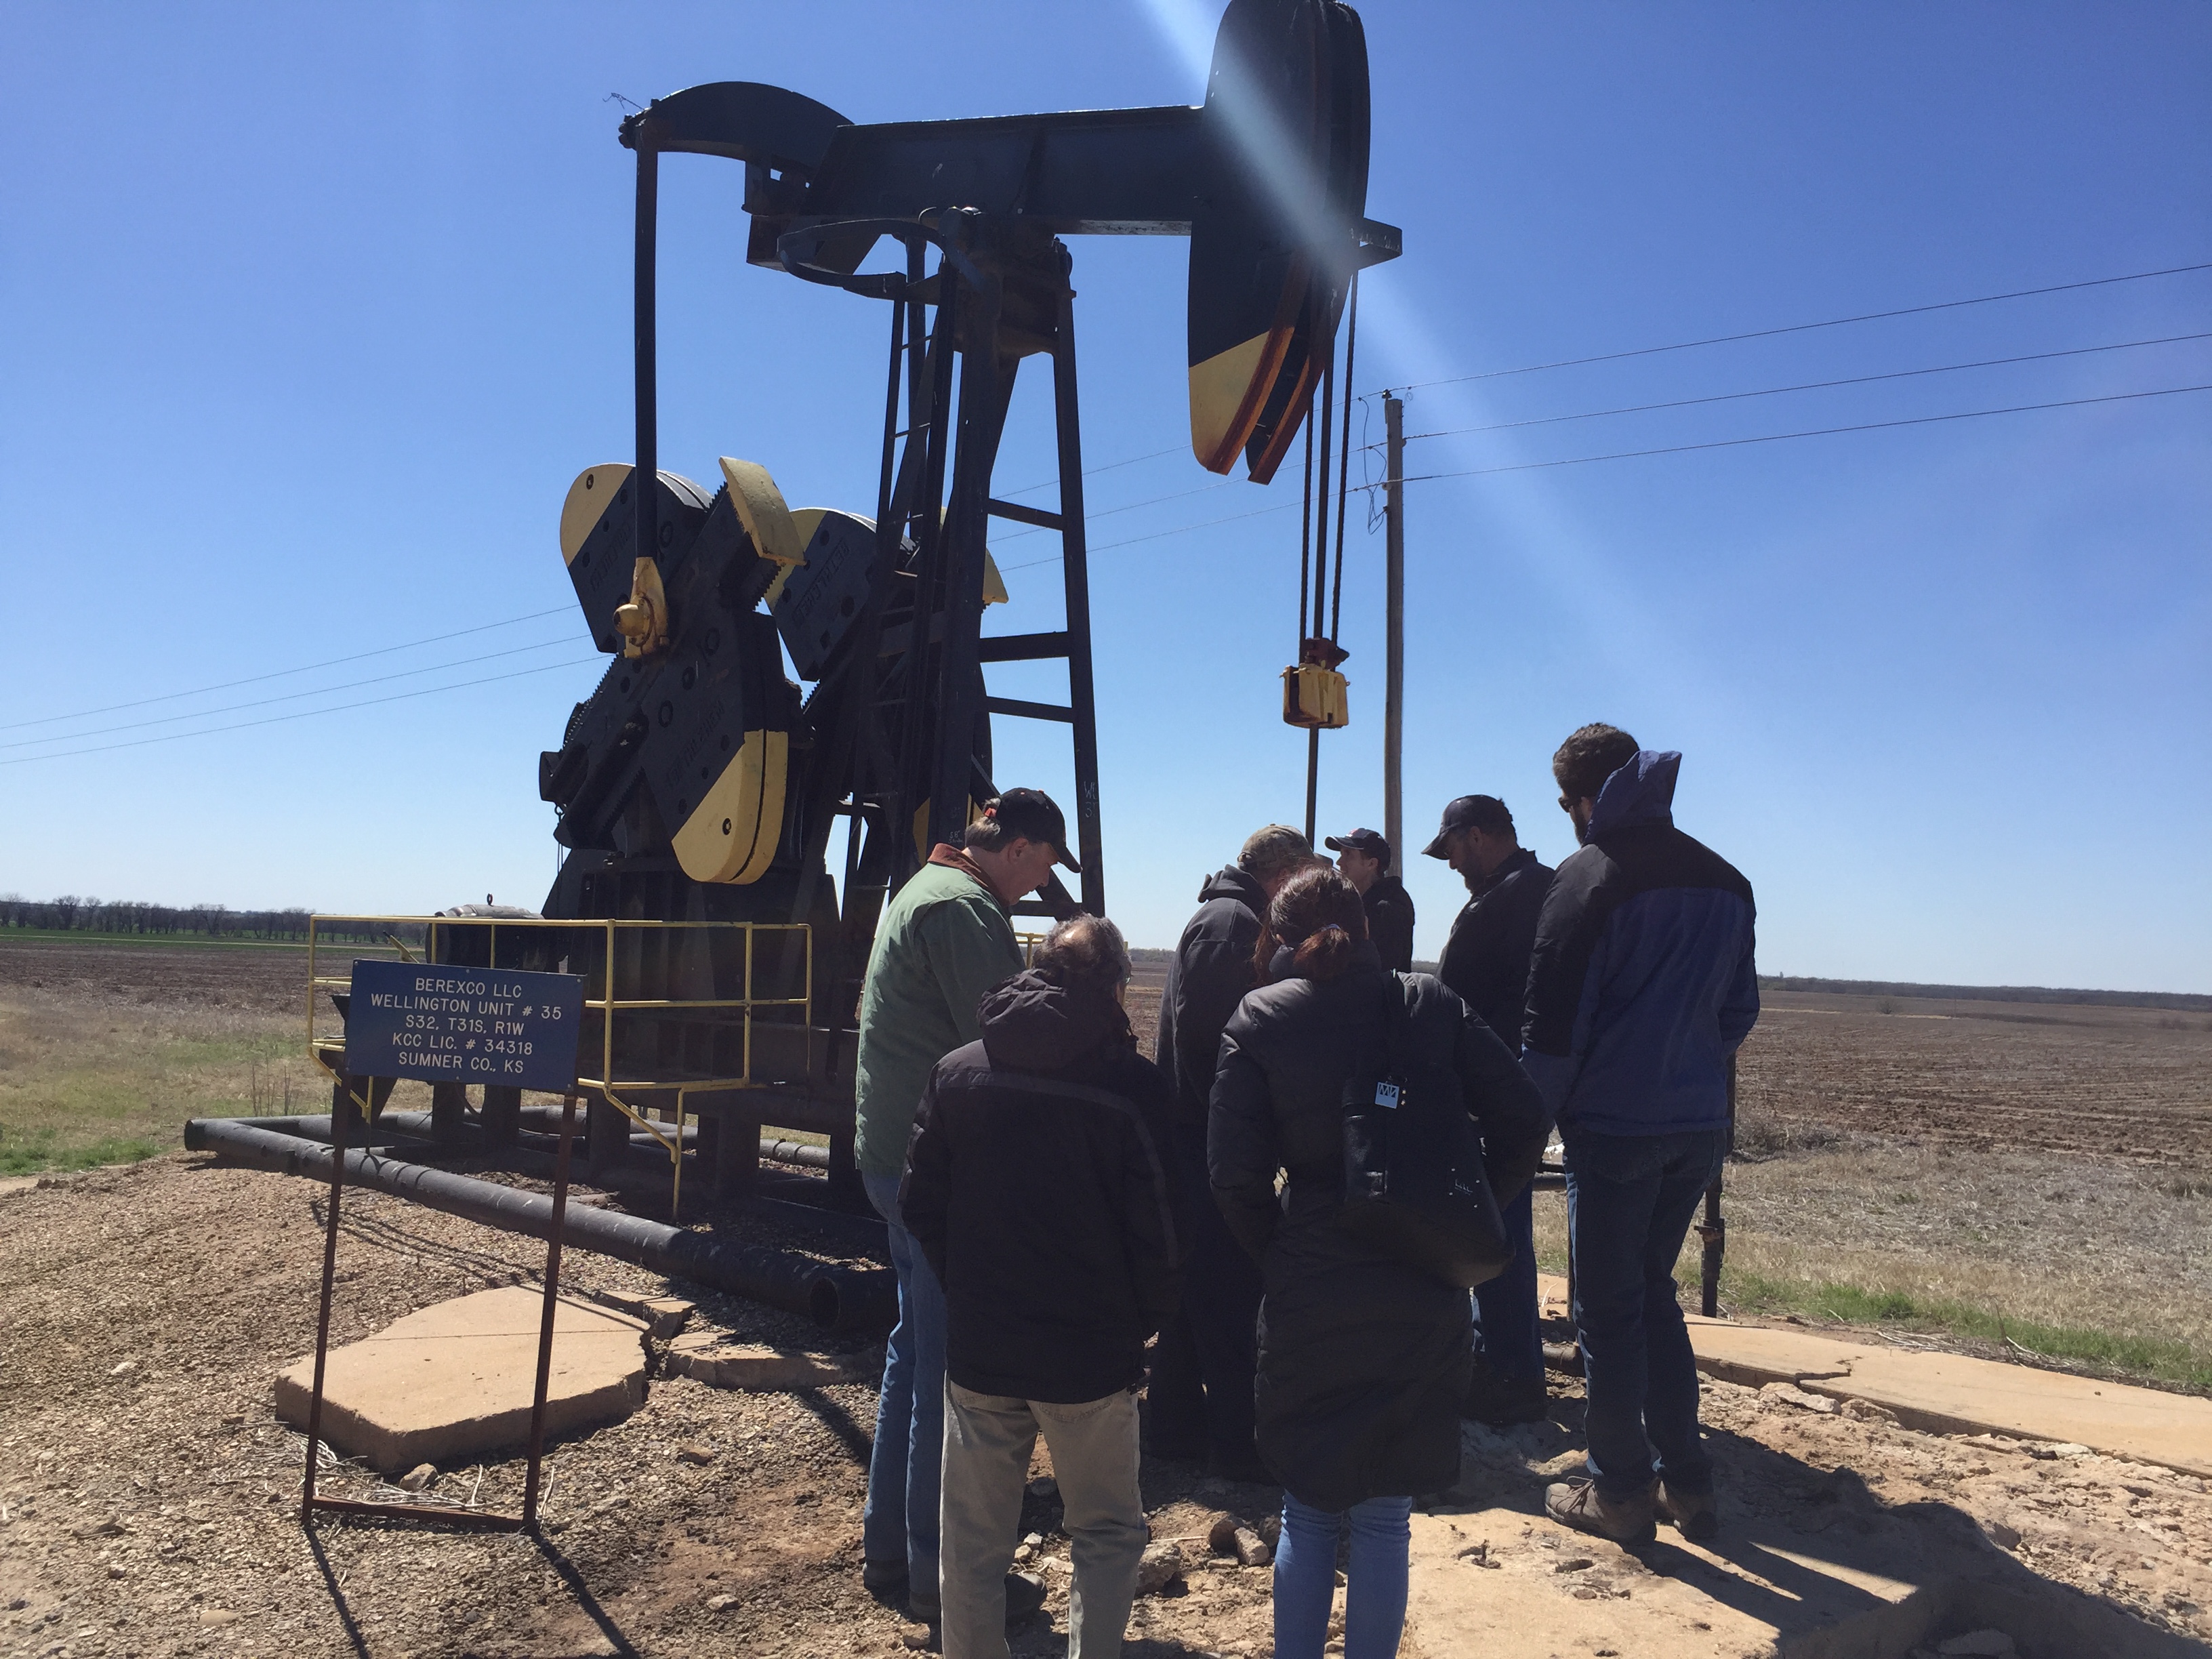
A group of KU Petroleum Engineering students and faculty participated in a field trip the Wellington Field CO2 injection site on April 19th, 2016. Berexco and KGS staff gave the students a first-hand look at the active injection operations and how the CO2-EOR flood technologies are being applied at Wellington Field.

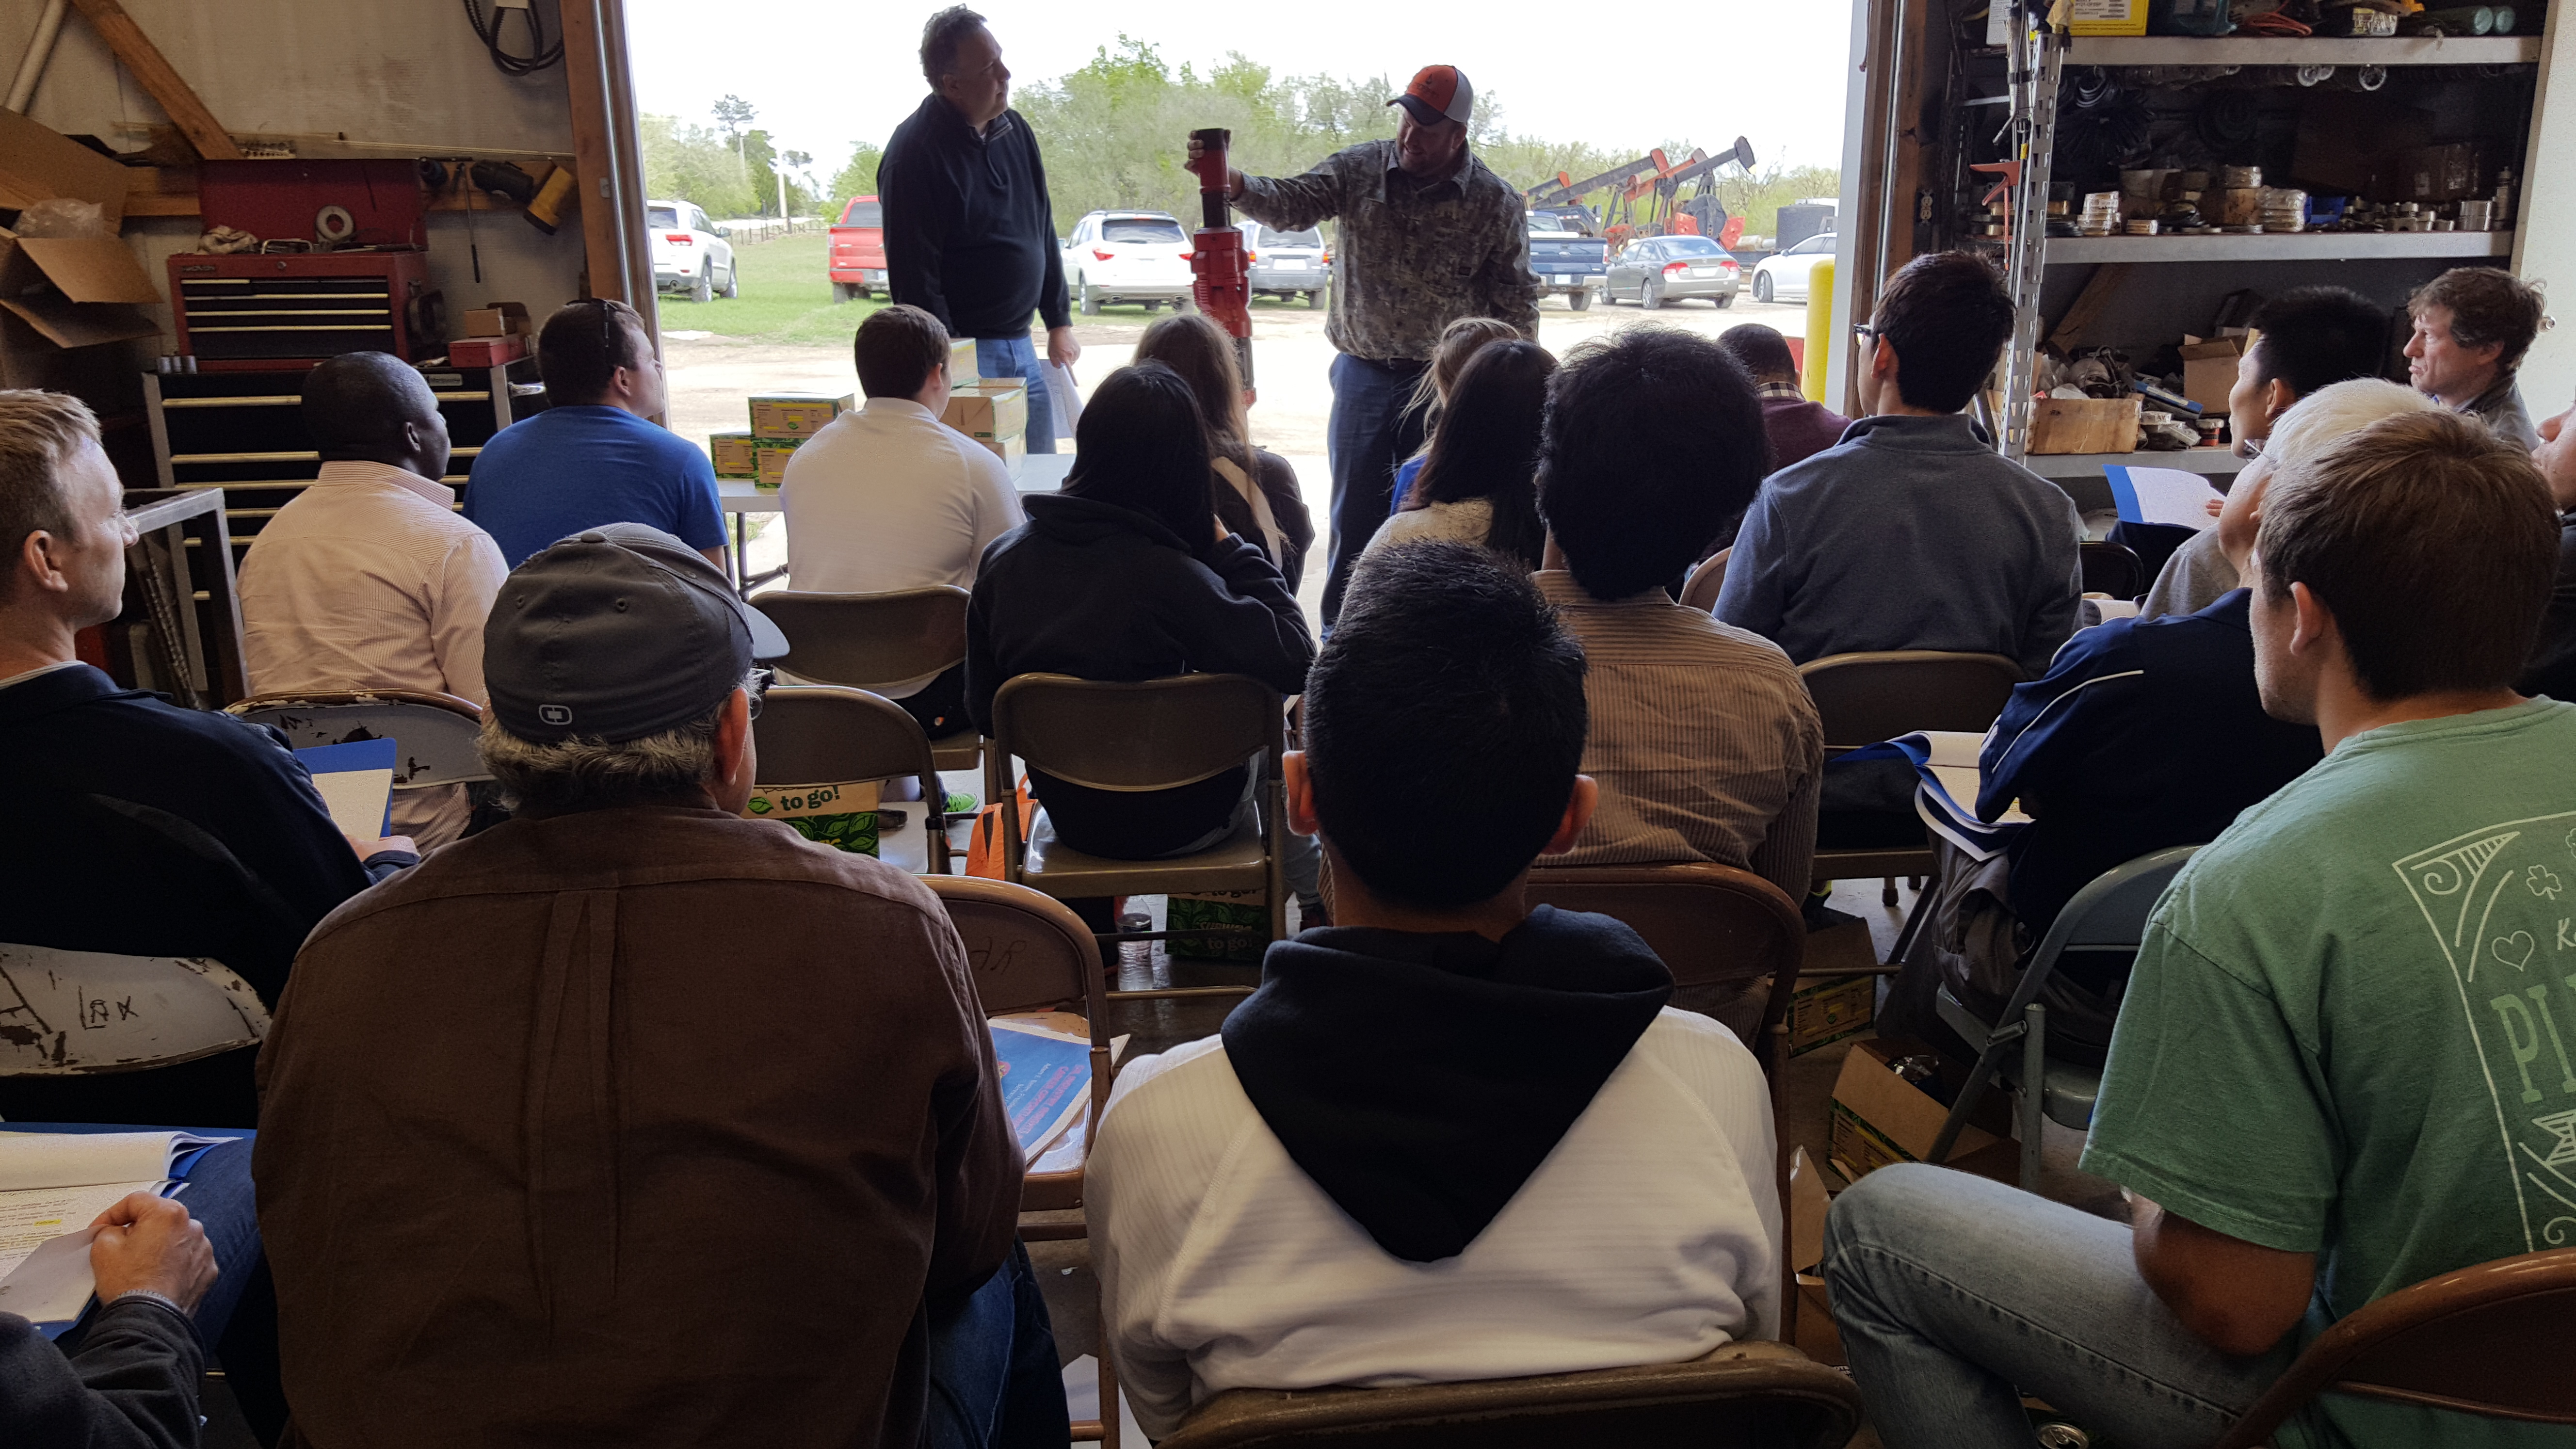
Dana Wreath and Jason Bruns show the group a typical down-hole packer that is commonly used in their Mississippian wells. For many, this was a rare opportunity to see an example of this tool up-close and hear a description of how the equipment is installed.

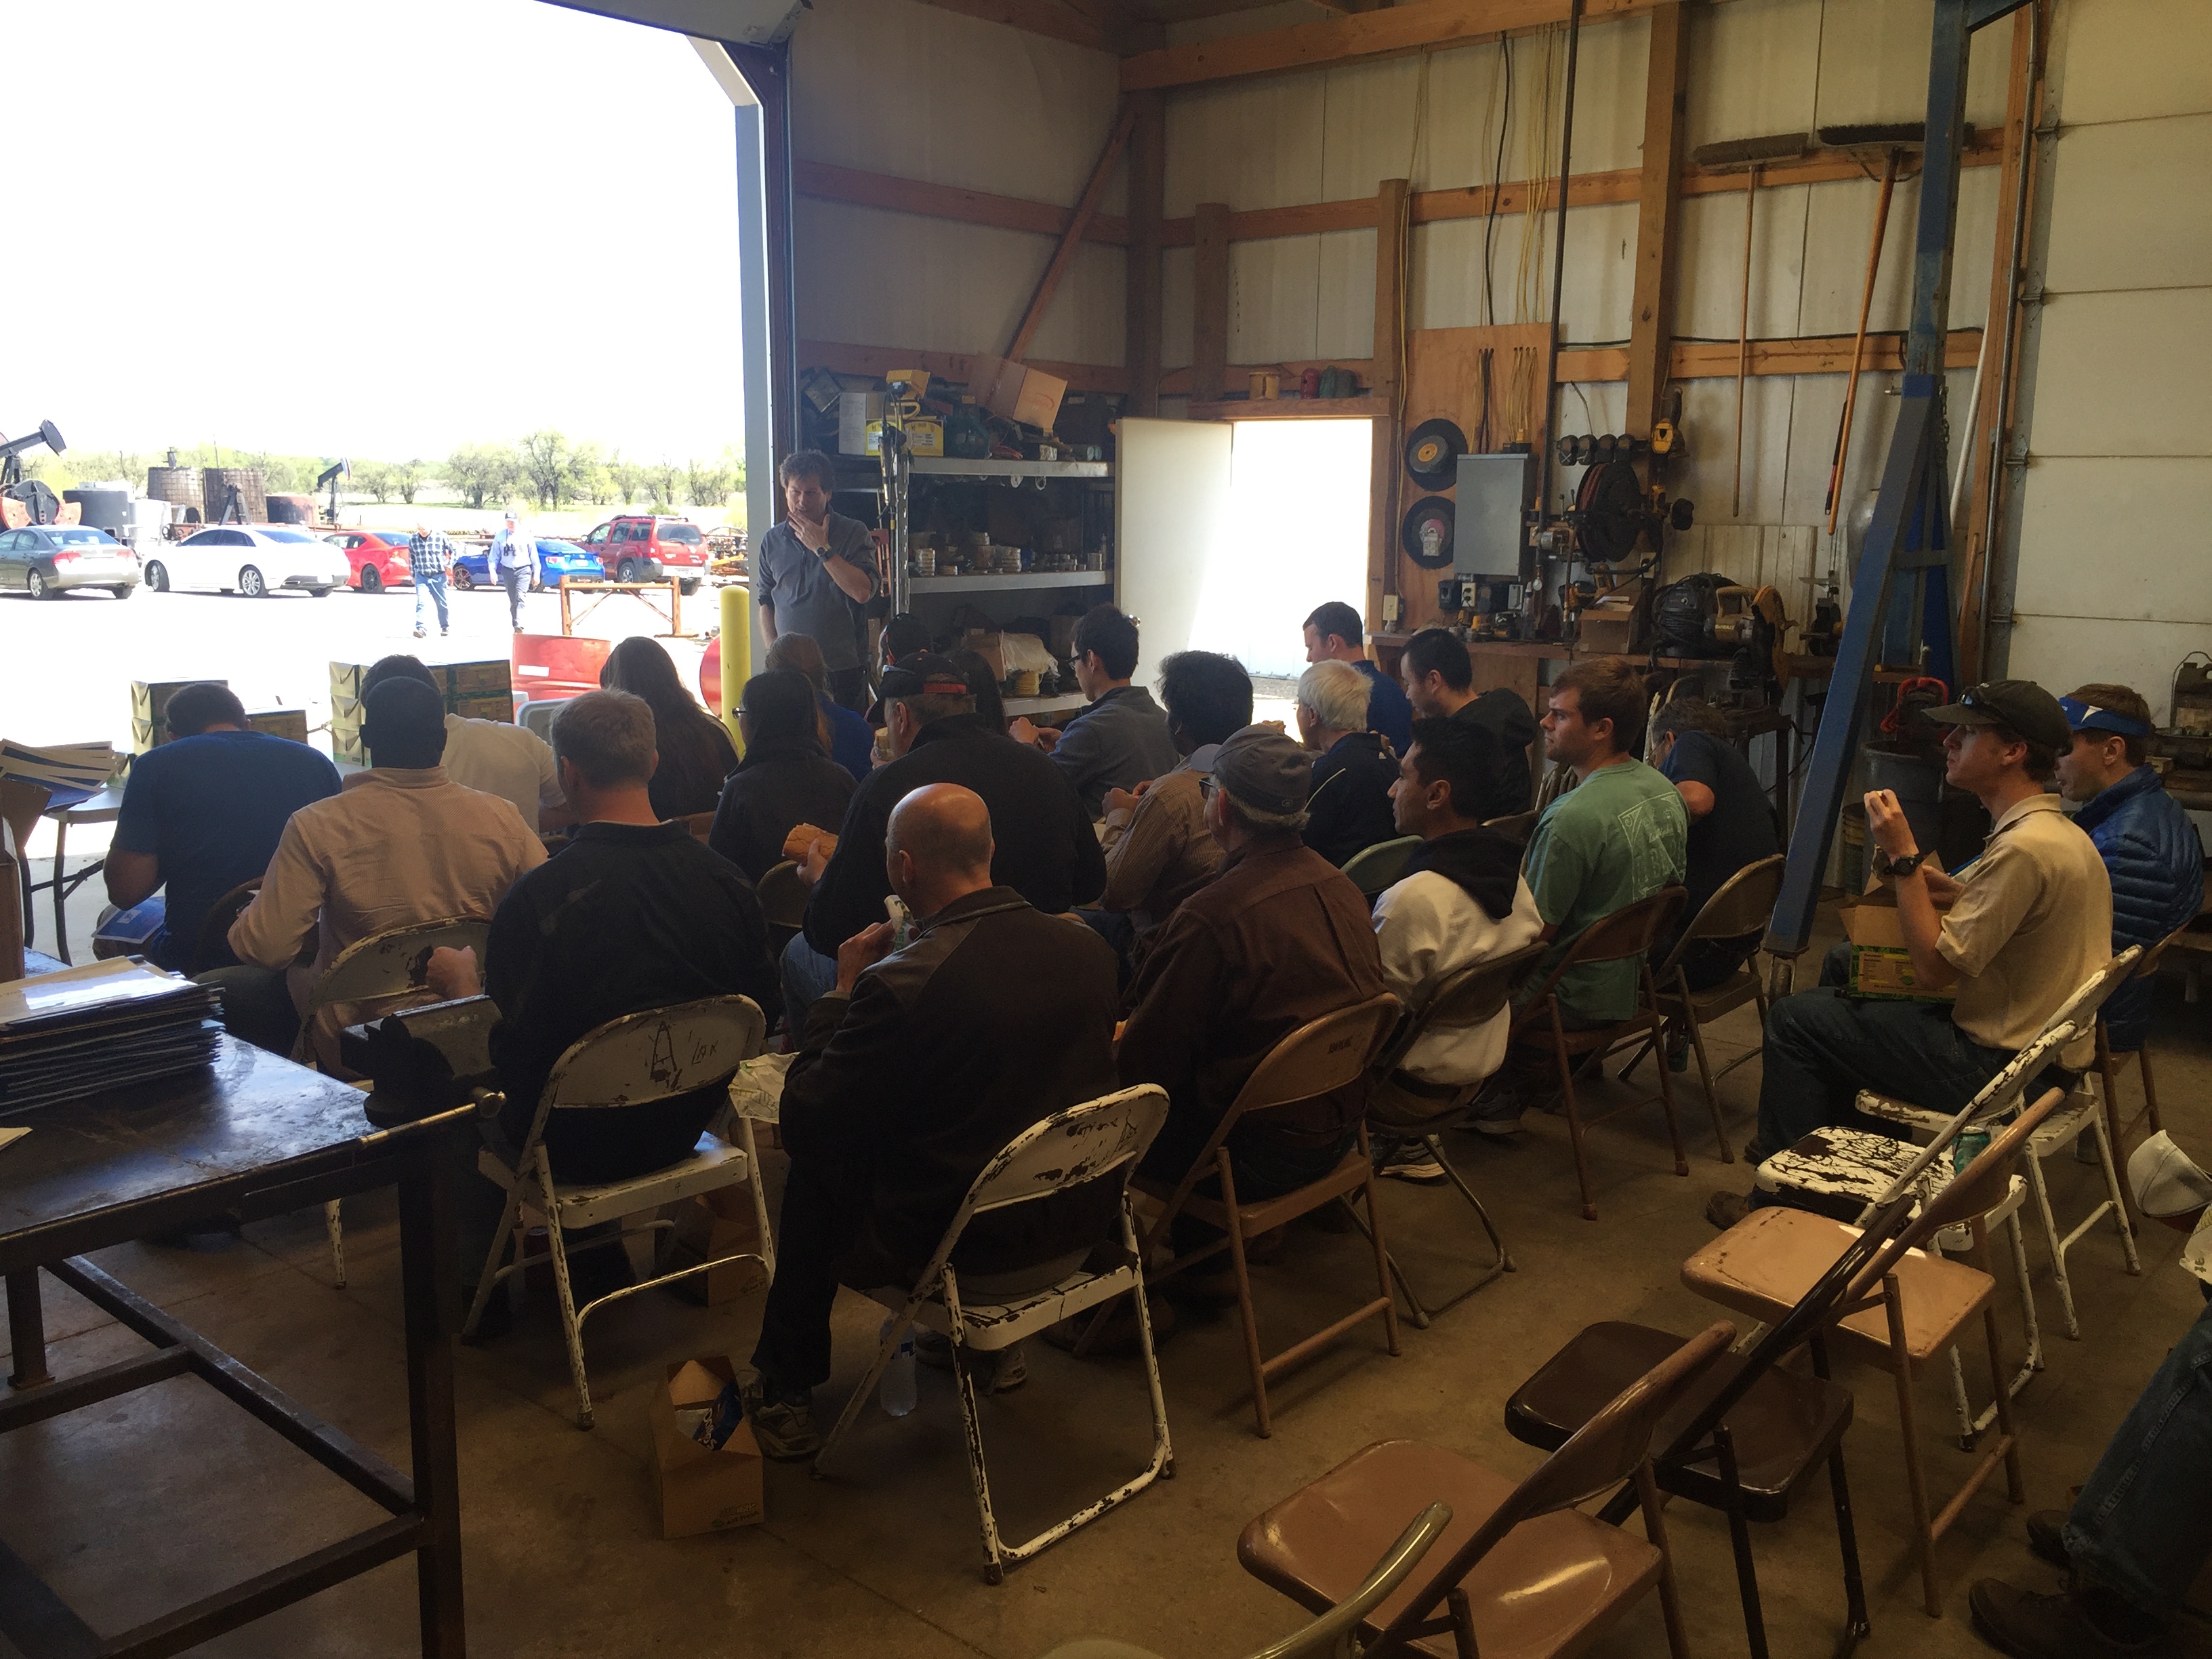
Adam Beren, President of Berexco, LLC. gave an informative presentation to the group about the history of Wellington Field and oil production trends in Kansas. A copy of the presentation is provided for reference.

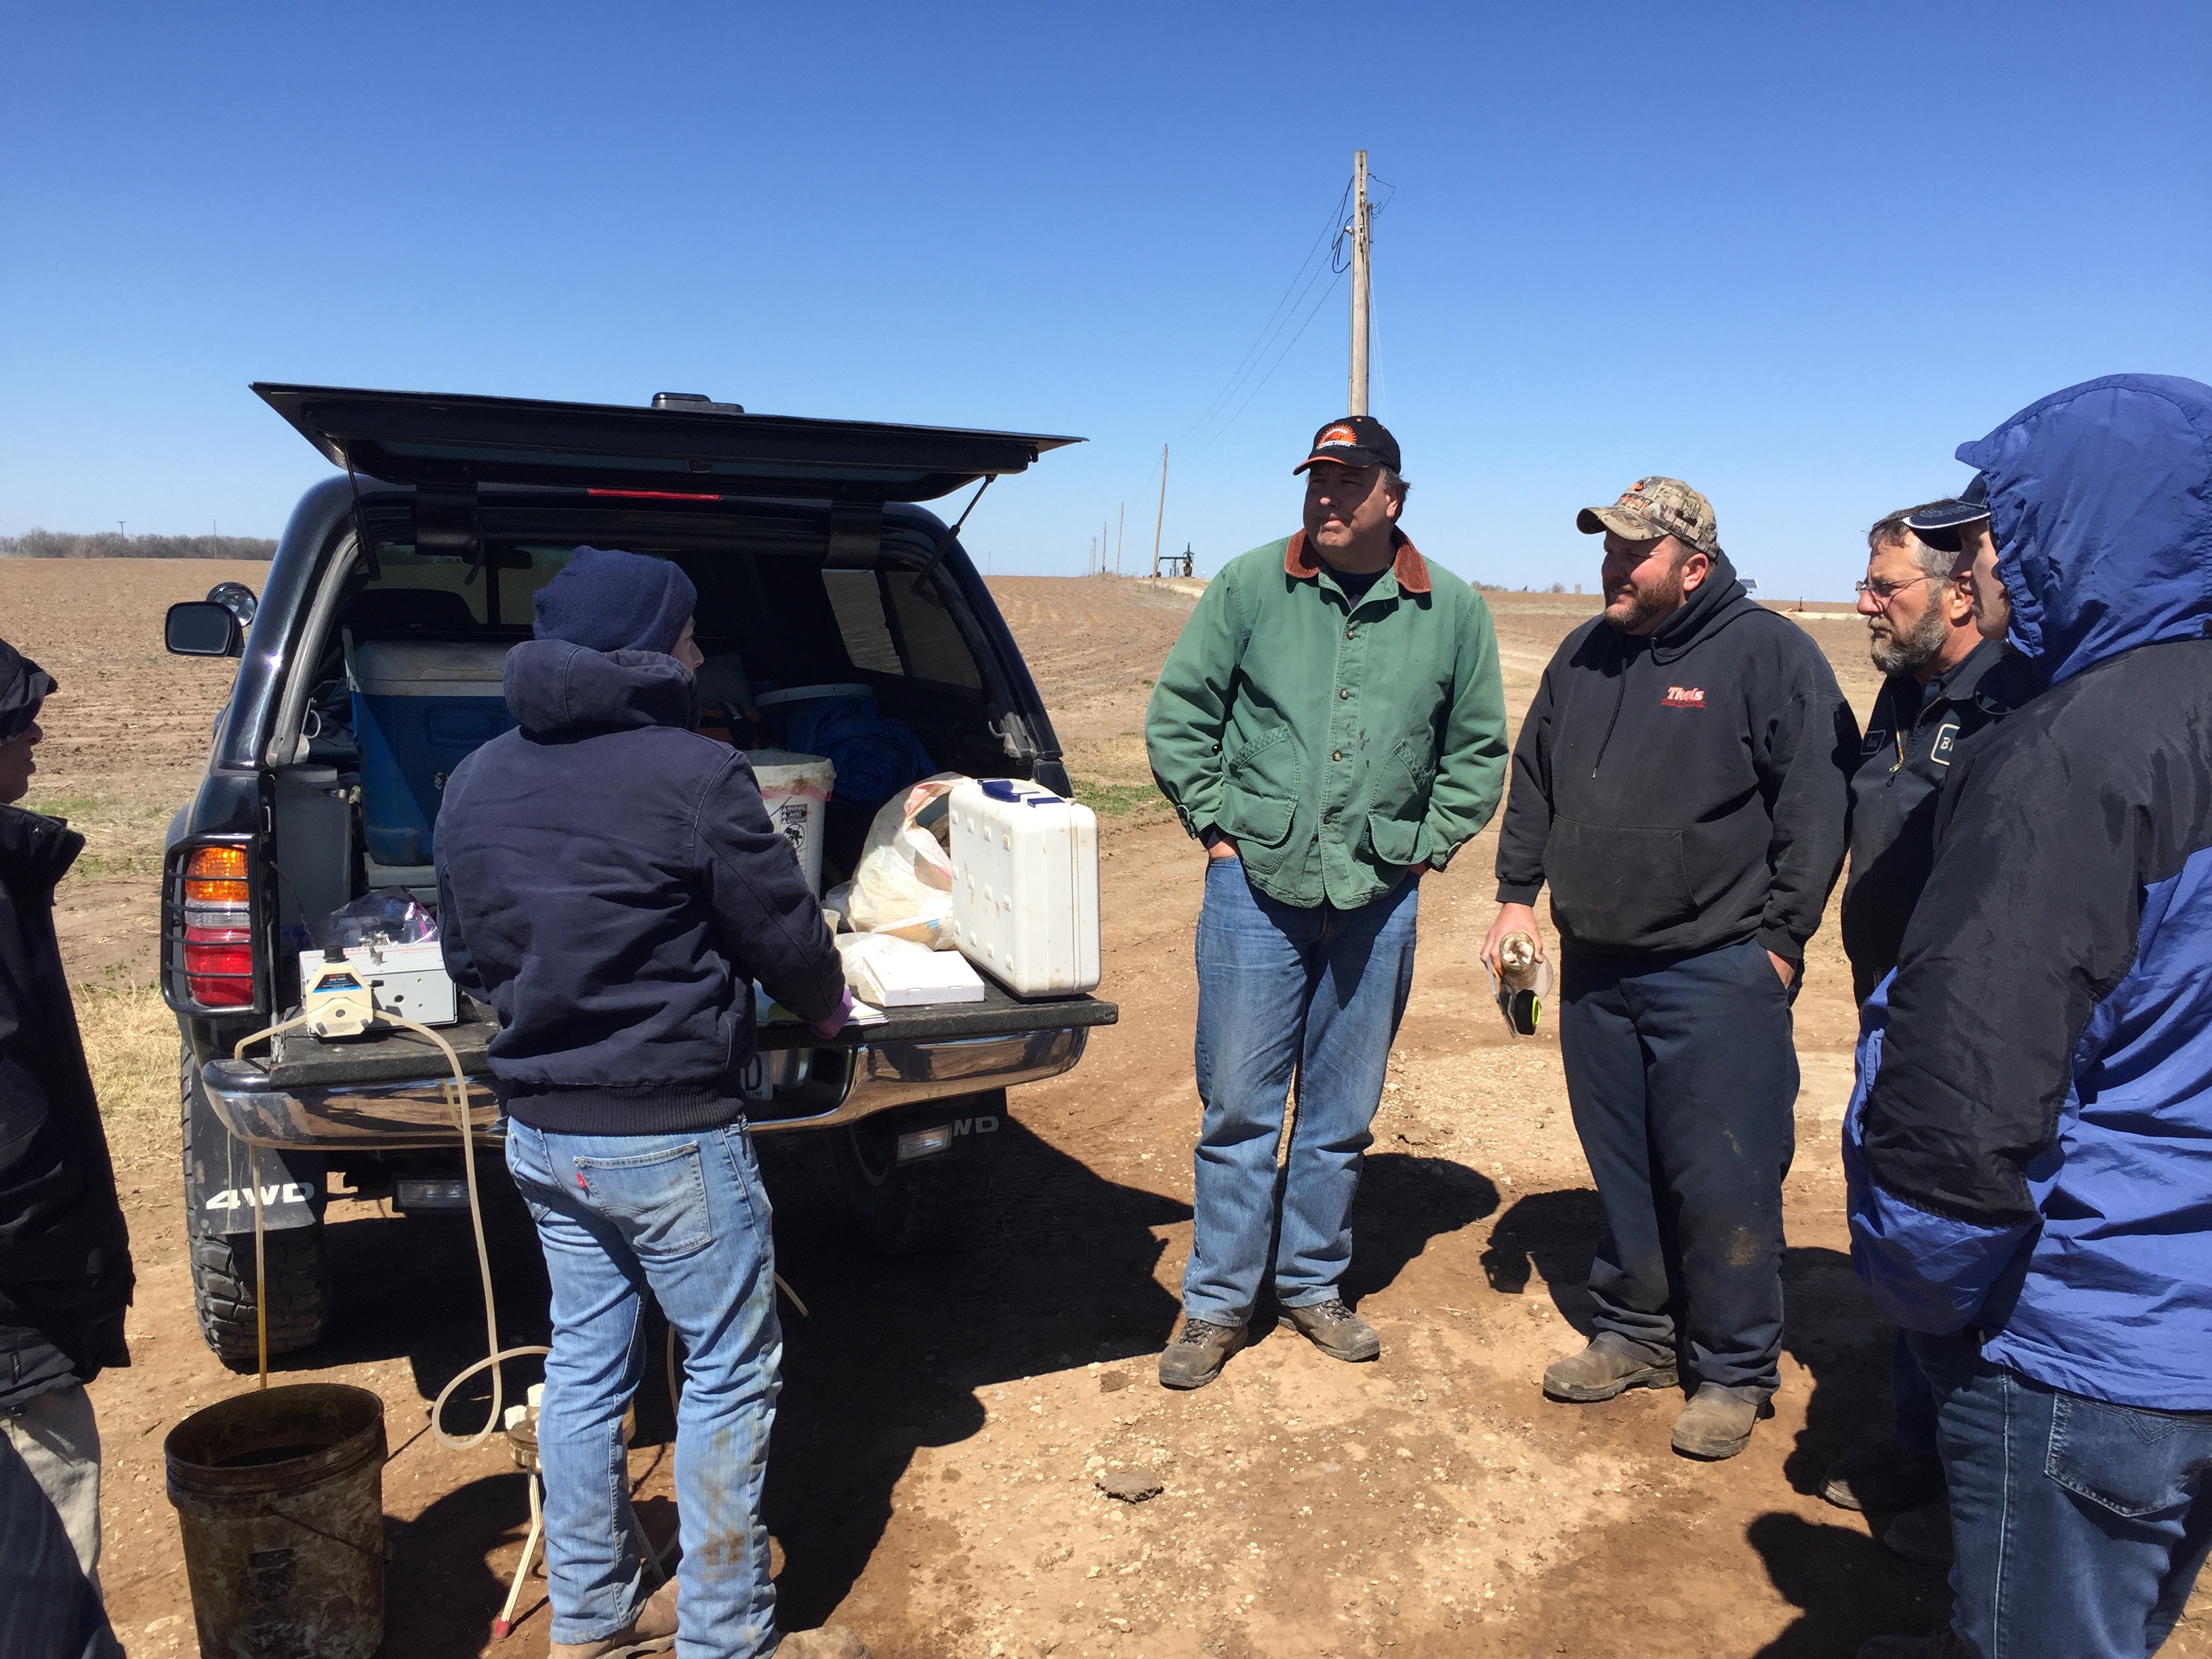
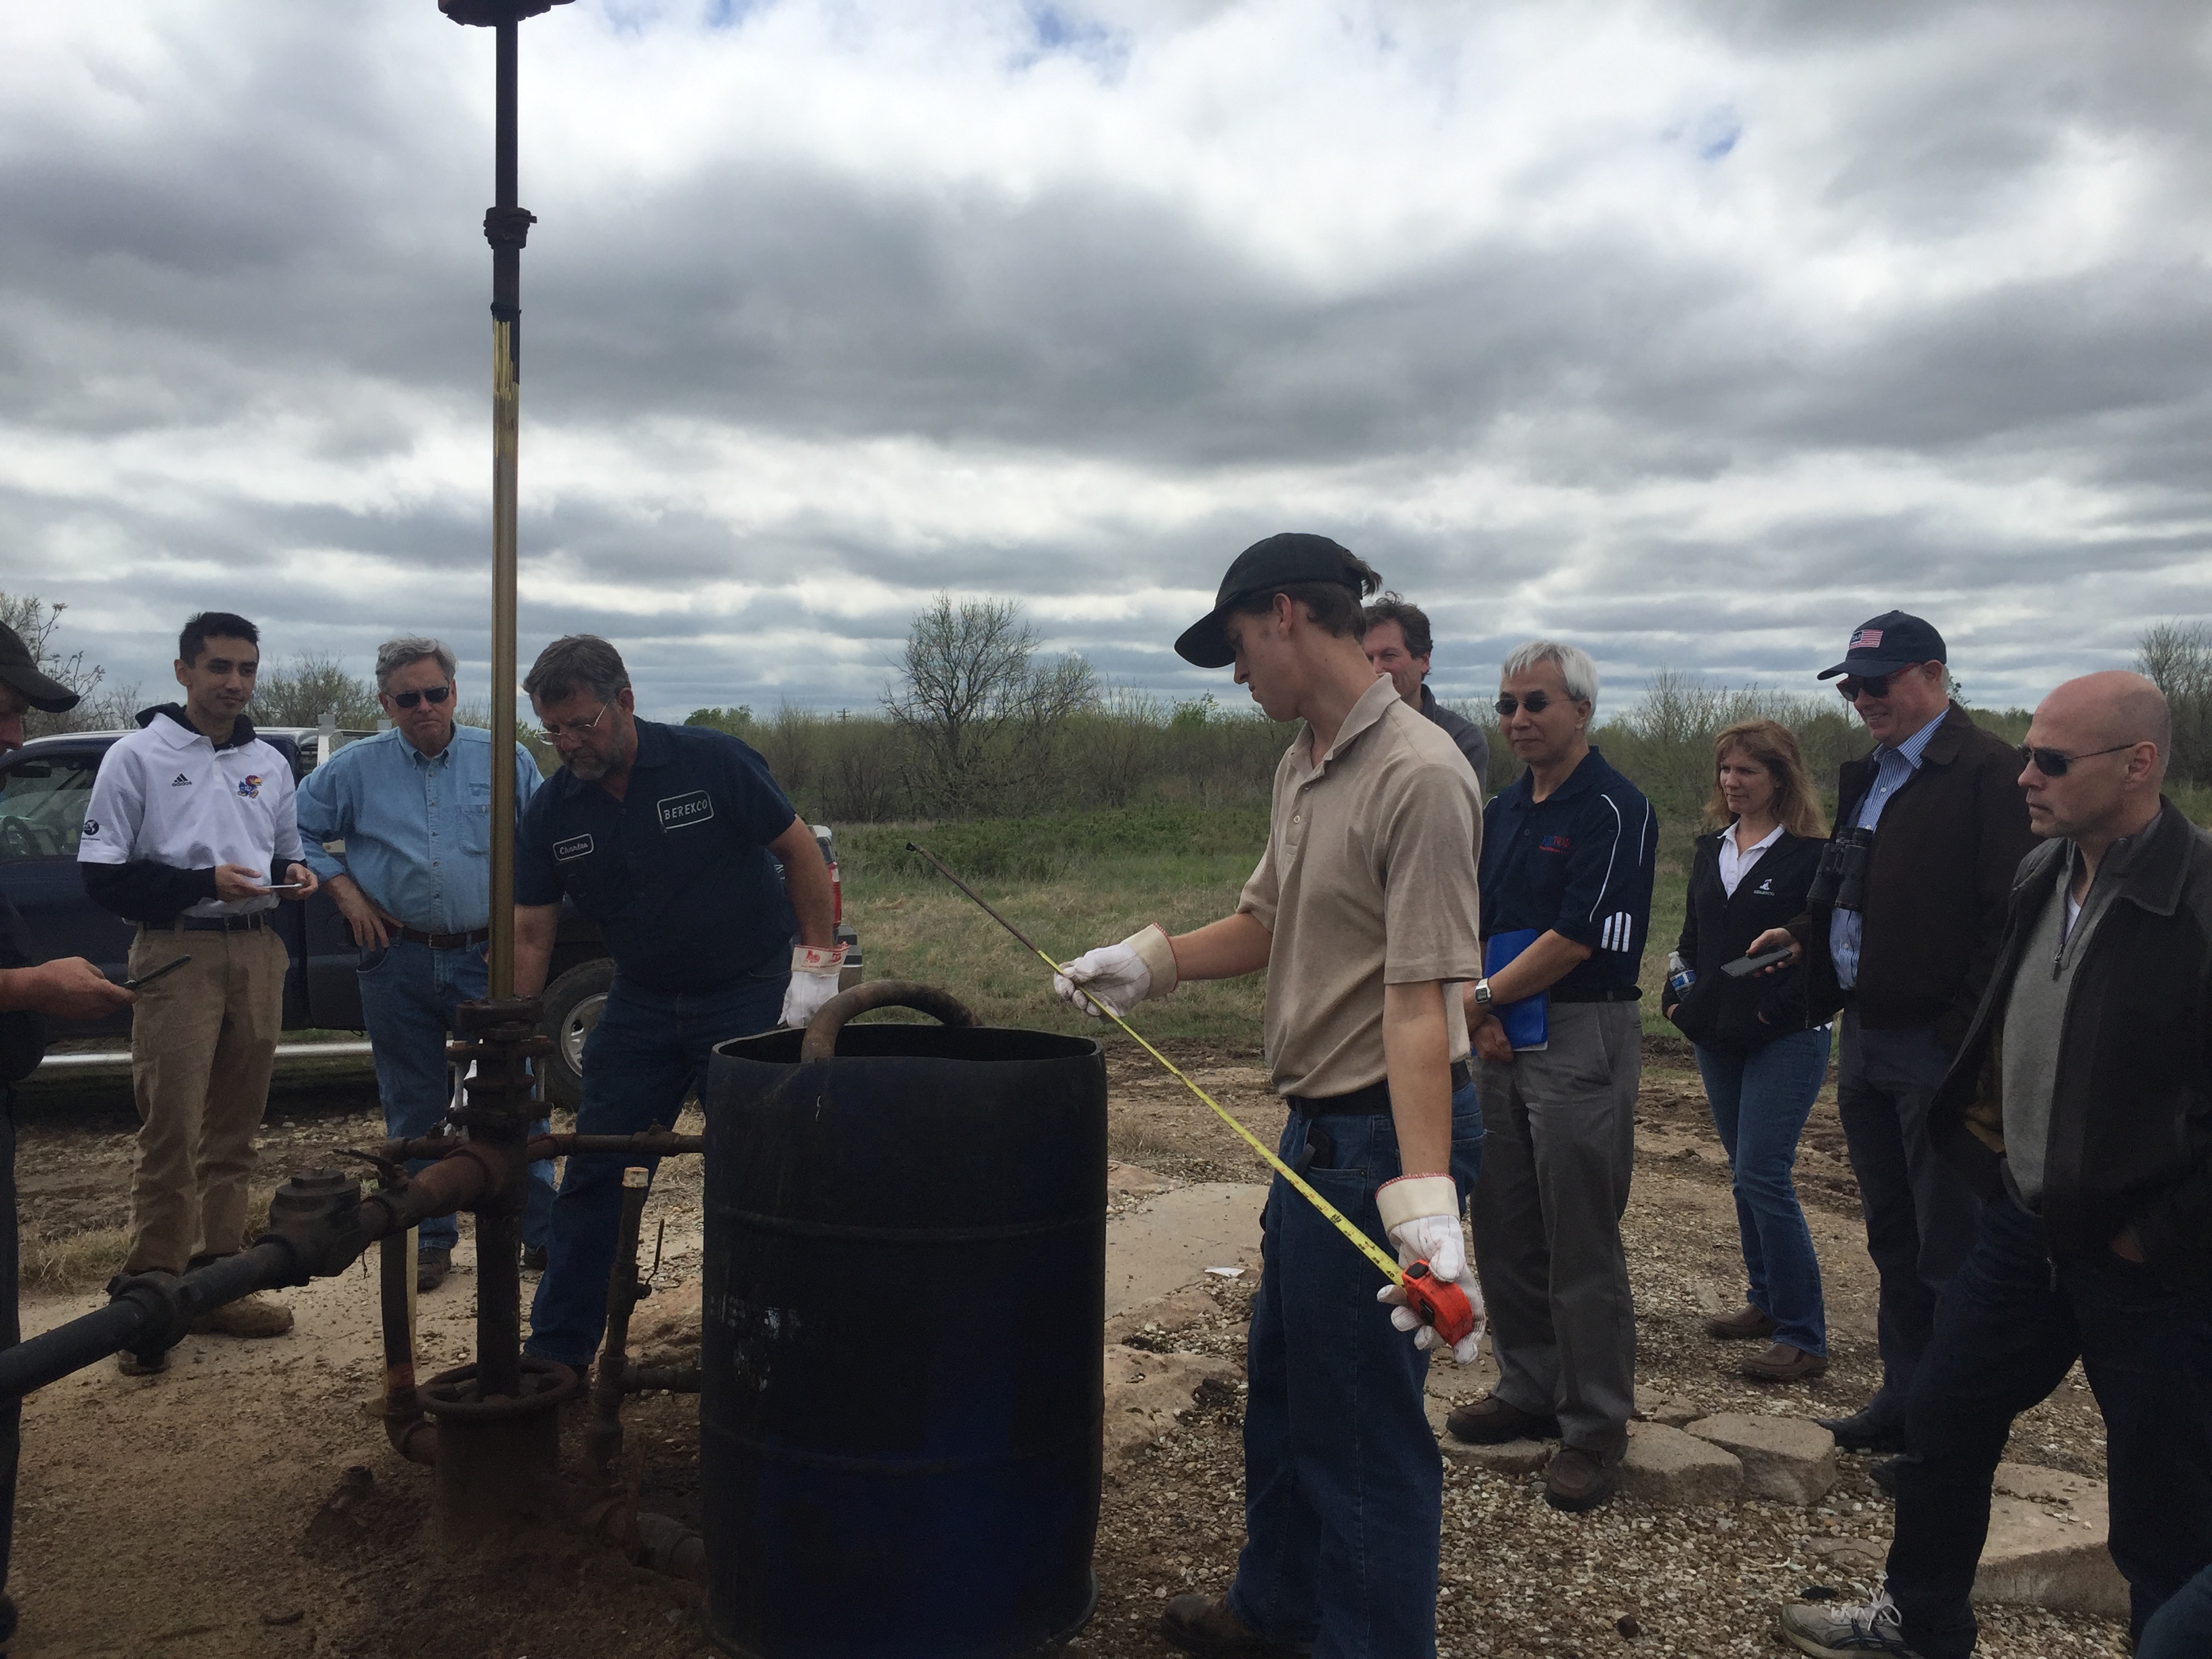
Brett Blazer, field engineer with Berexco, shows the group how oil cut and fluid level tests are conducted at each well in front of Wellington Unit #73.

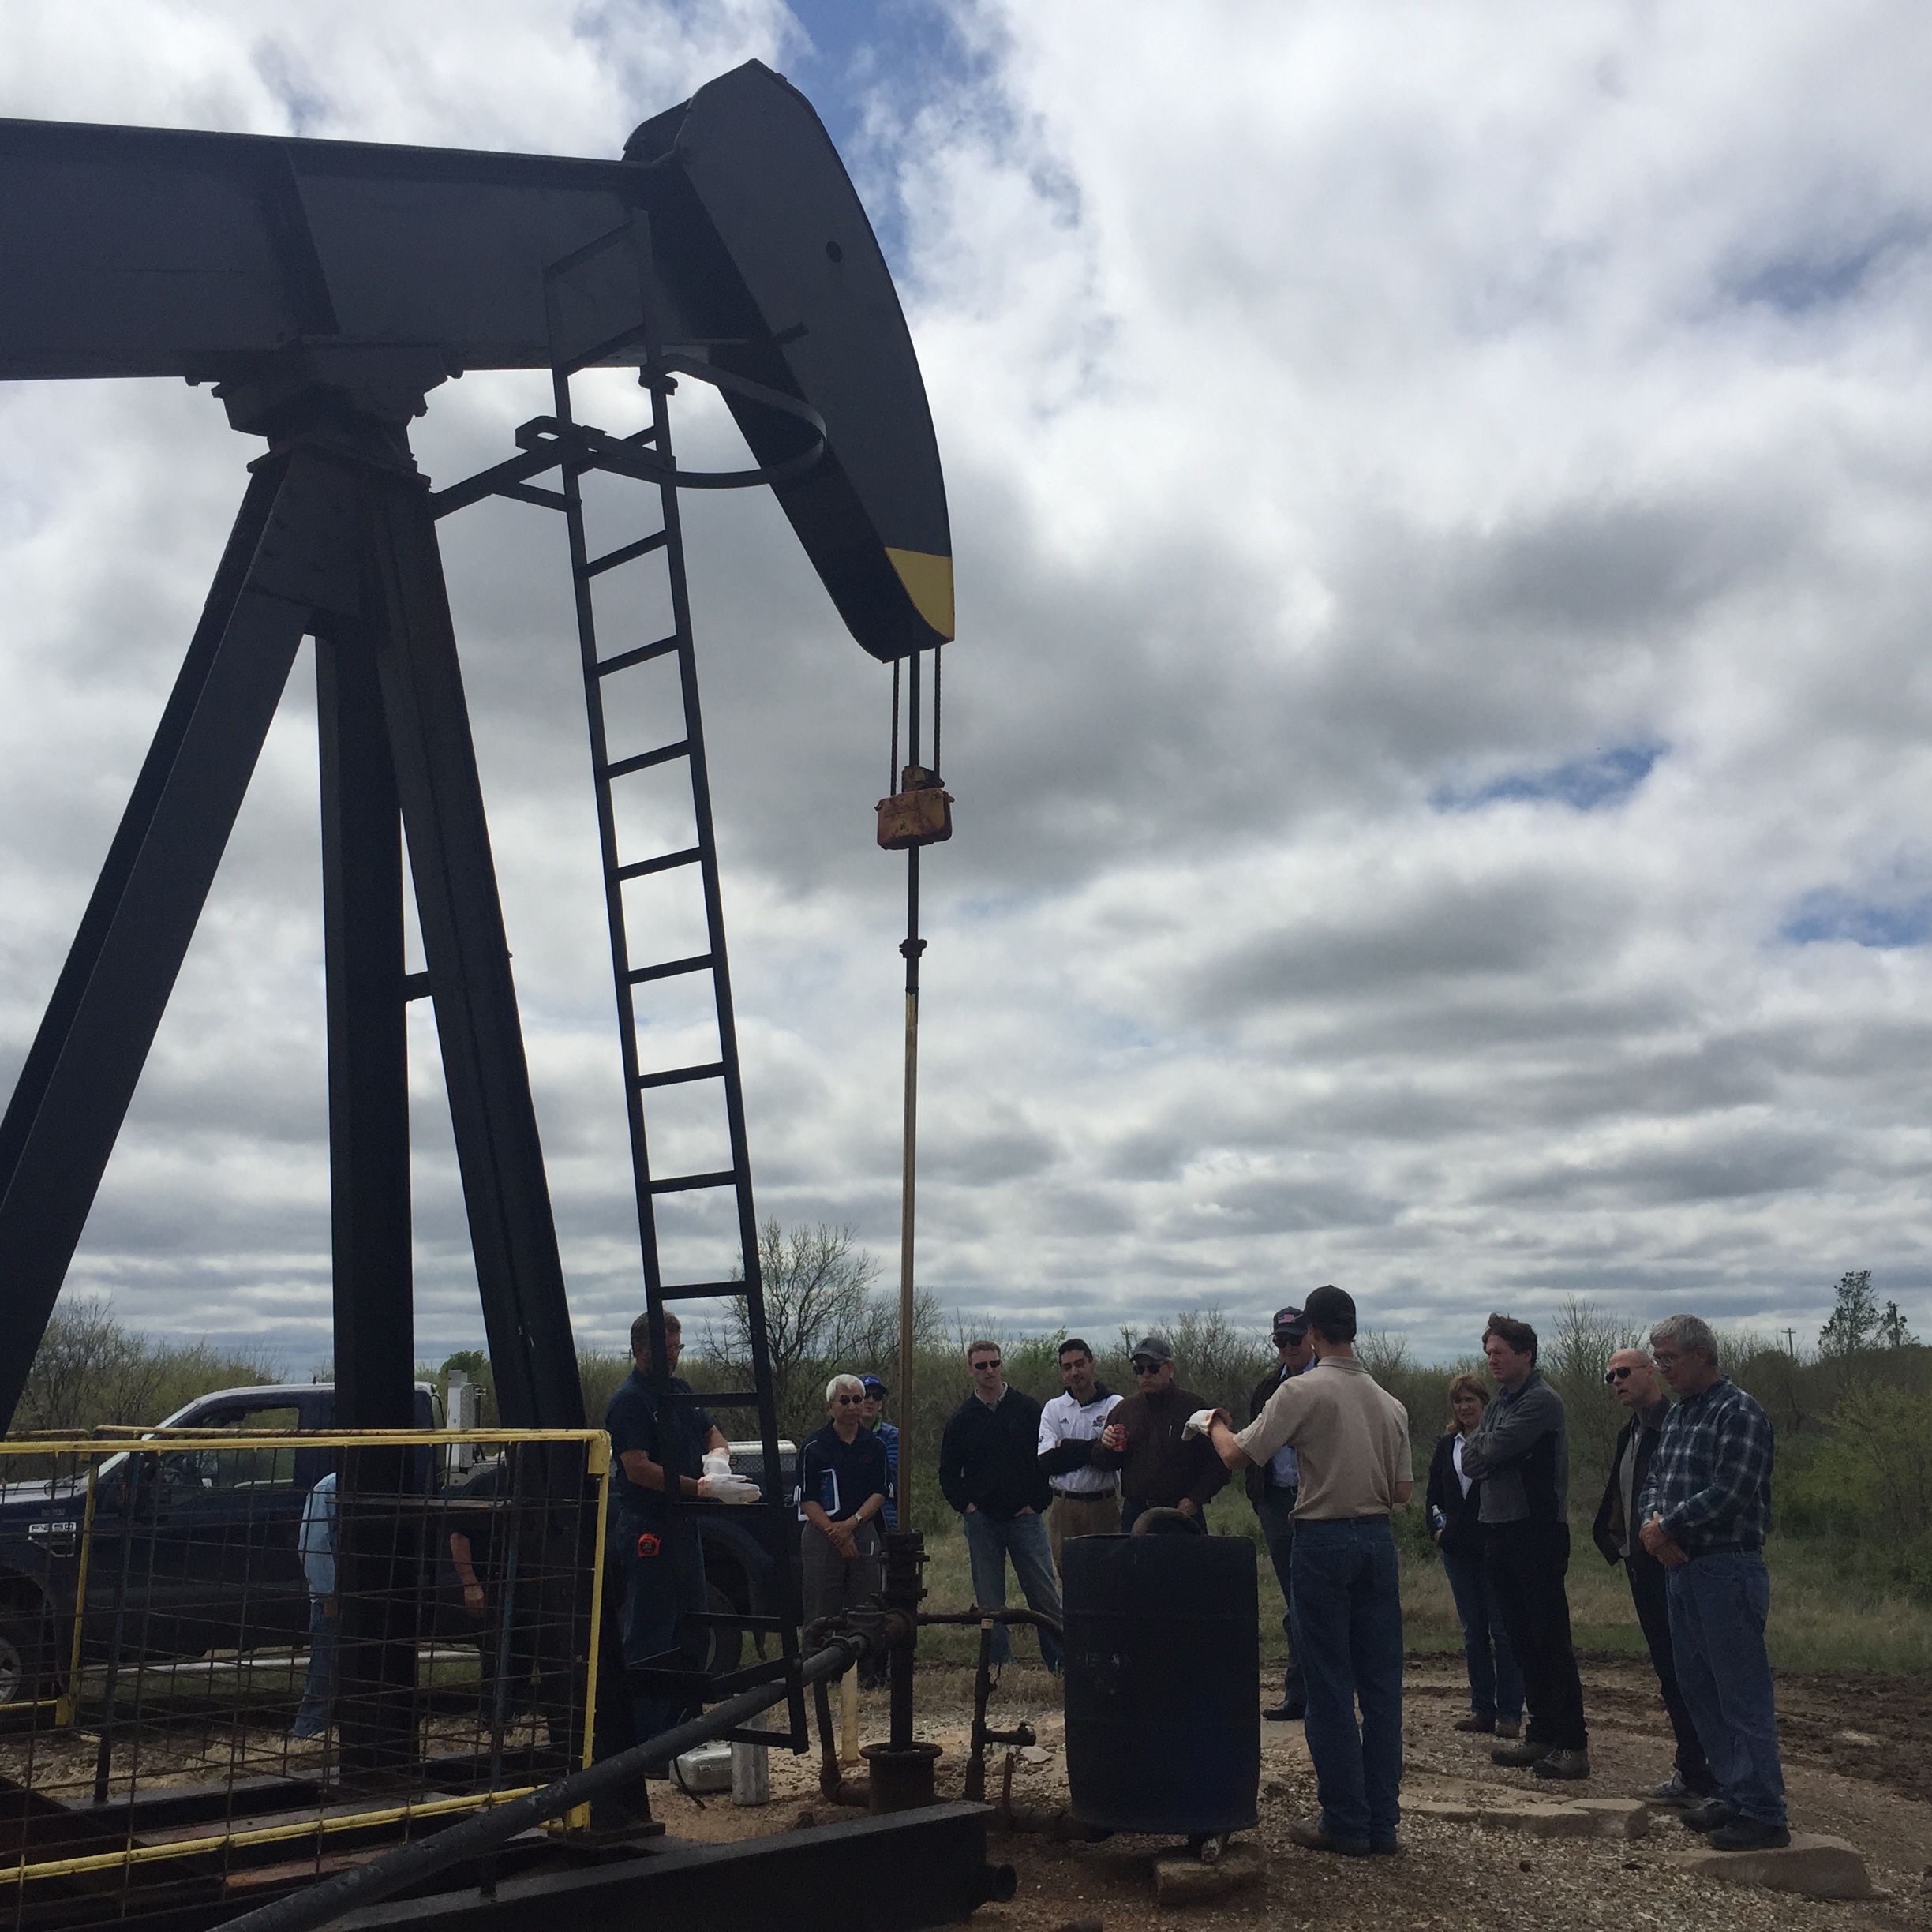
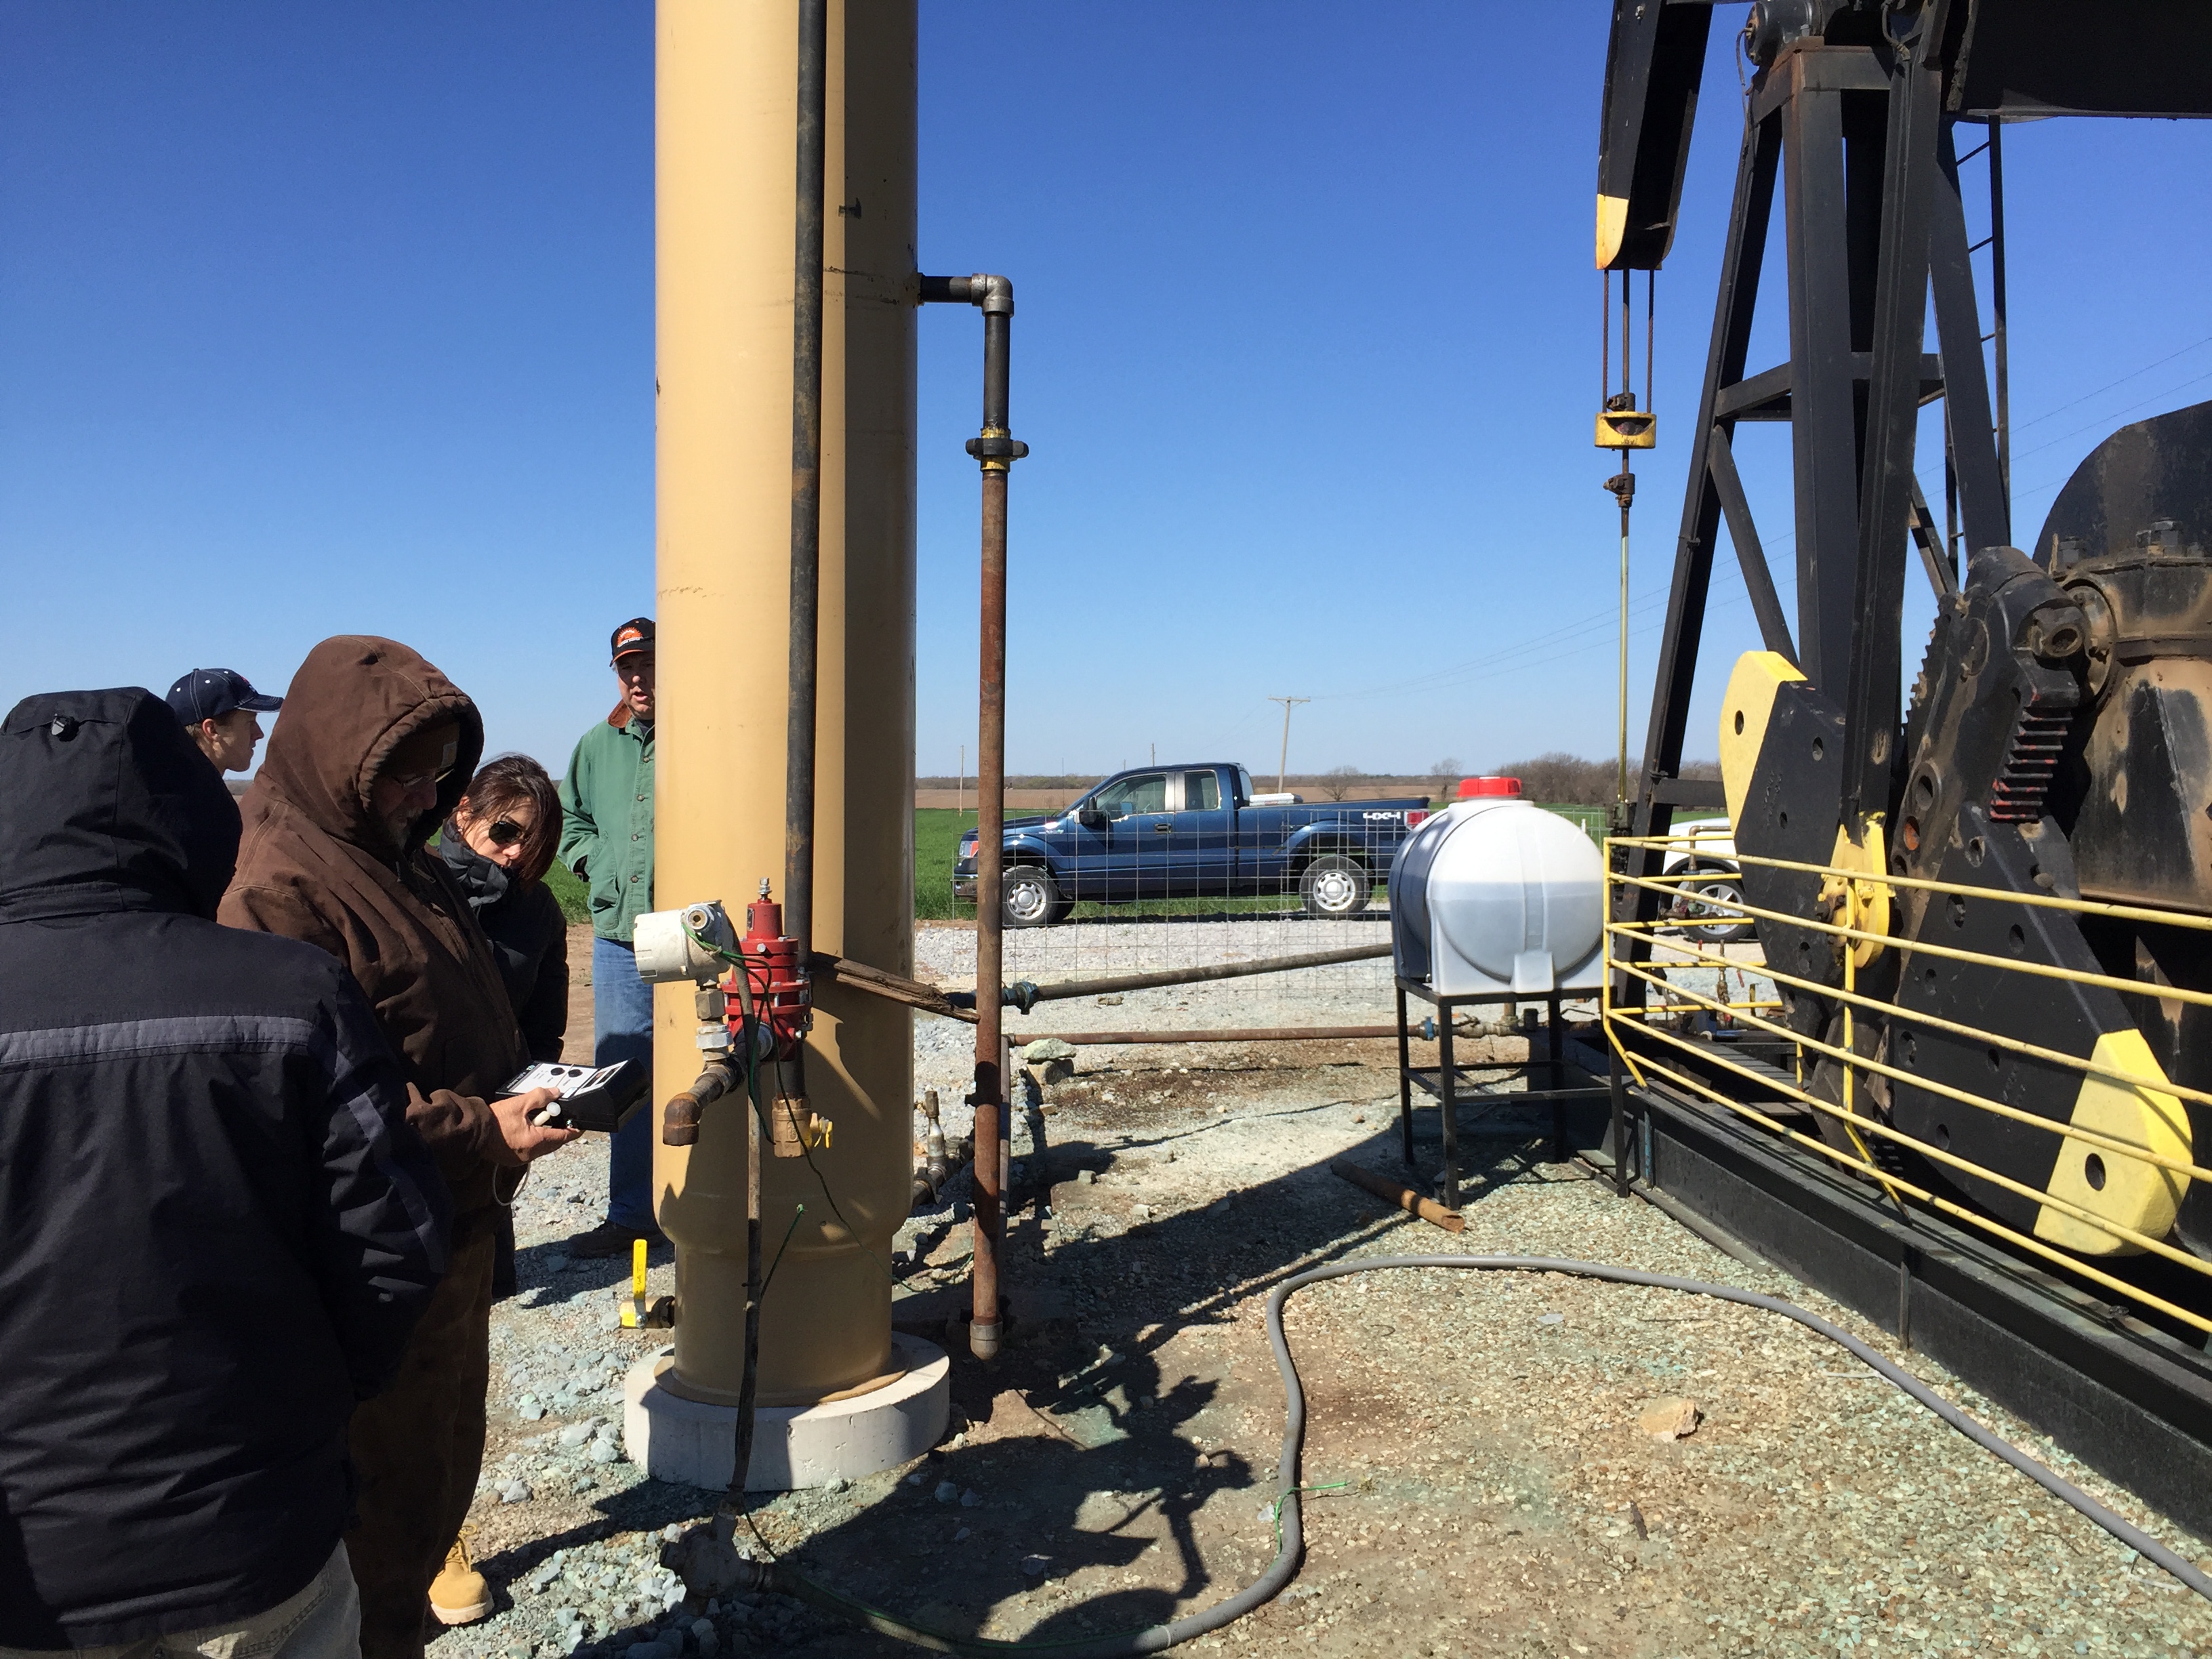
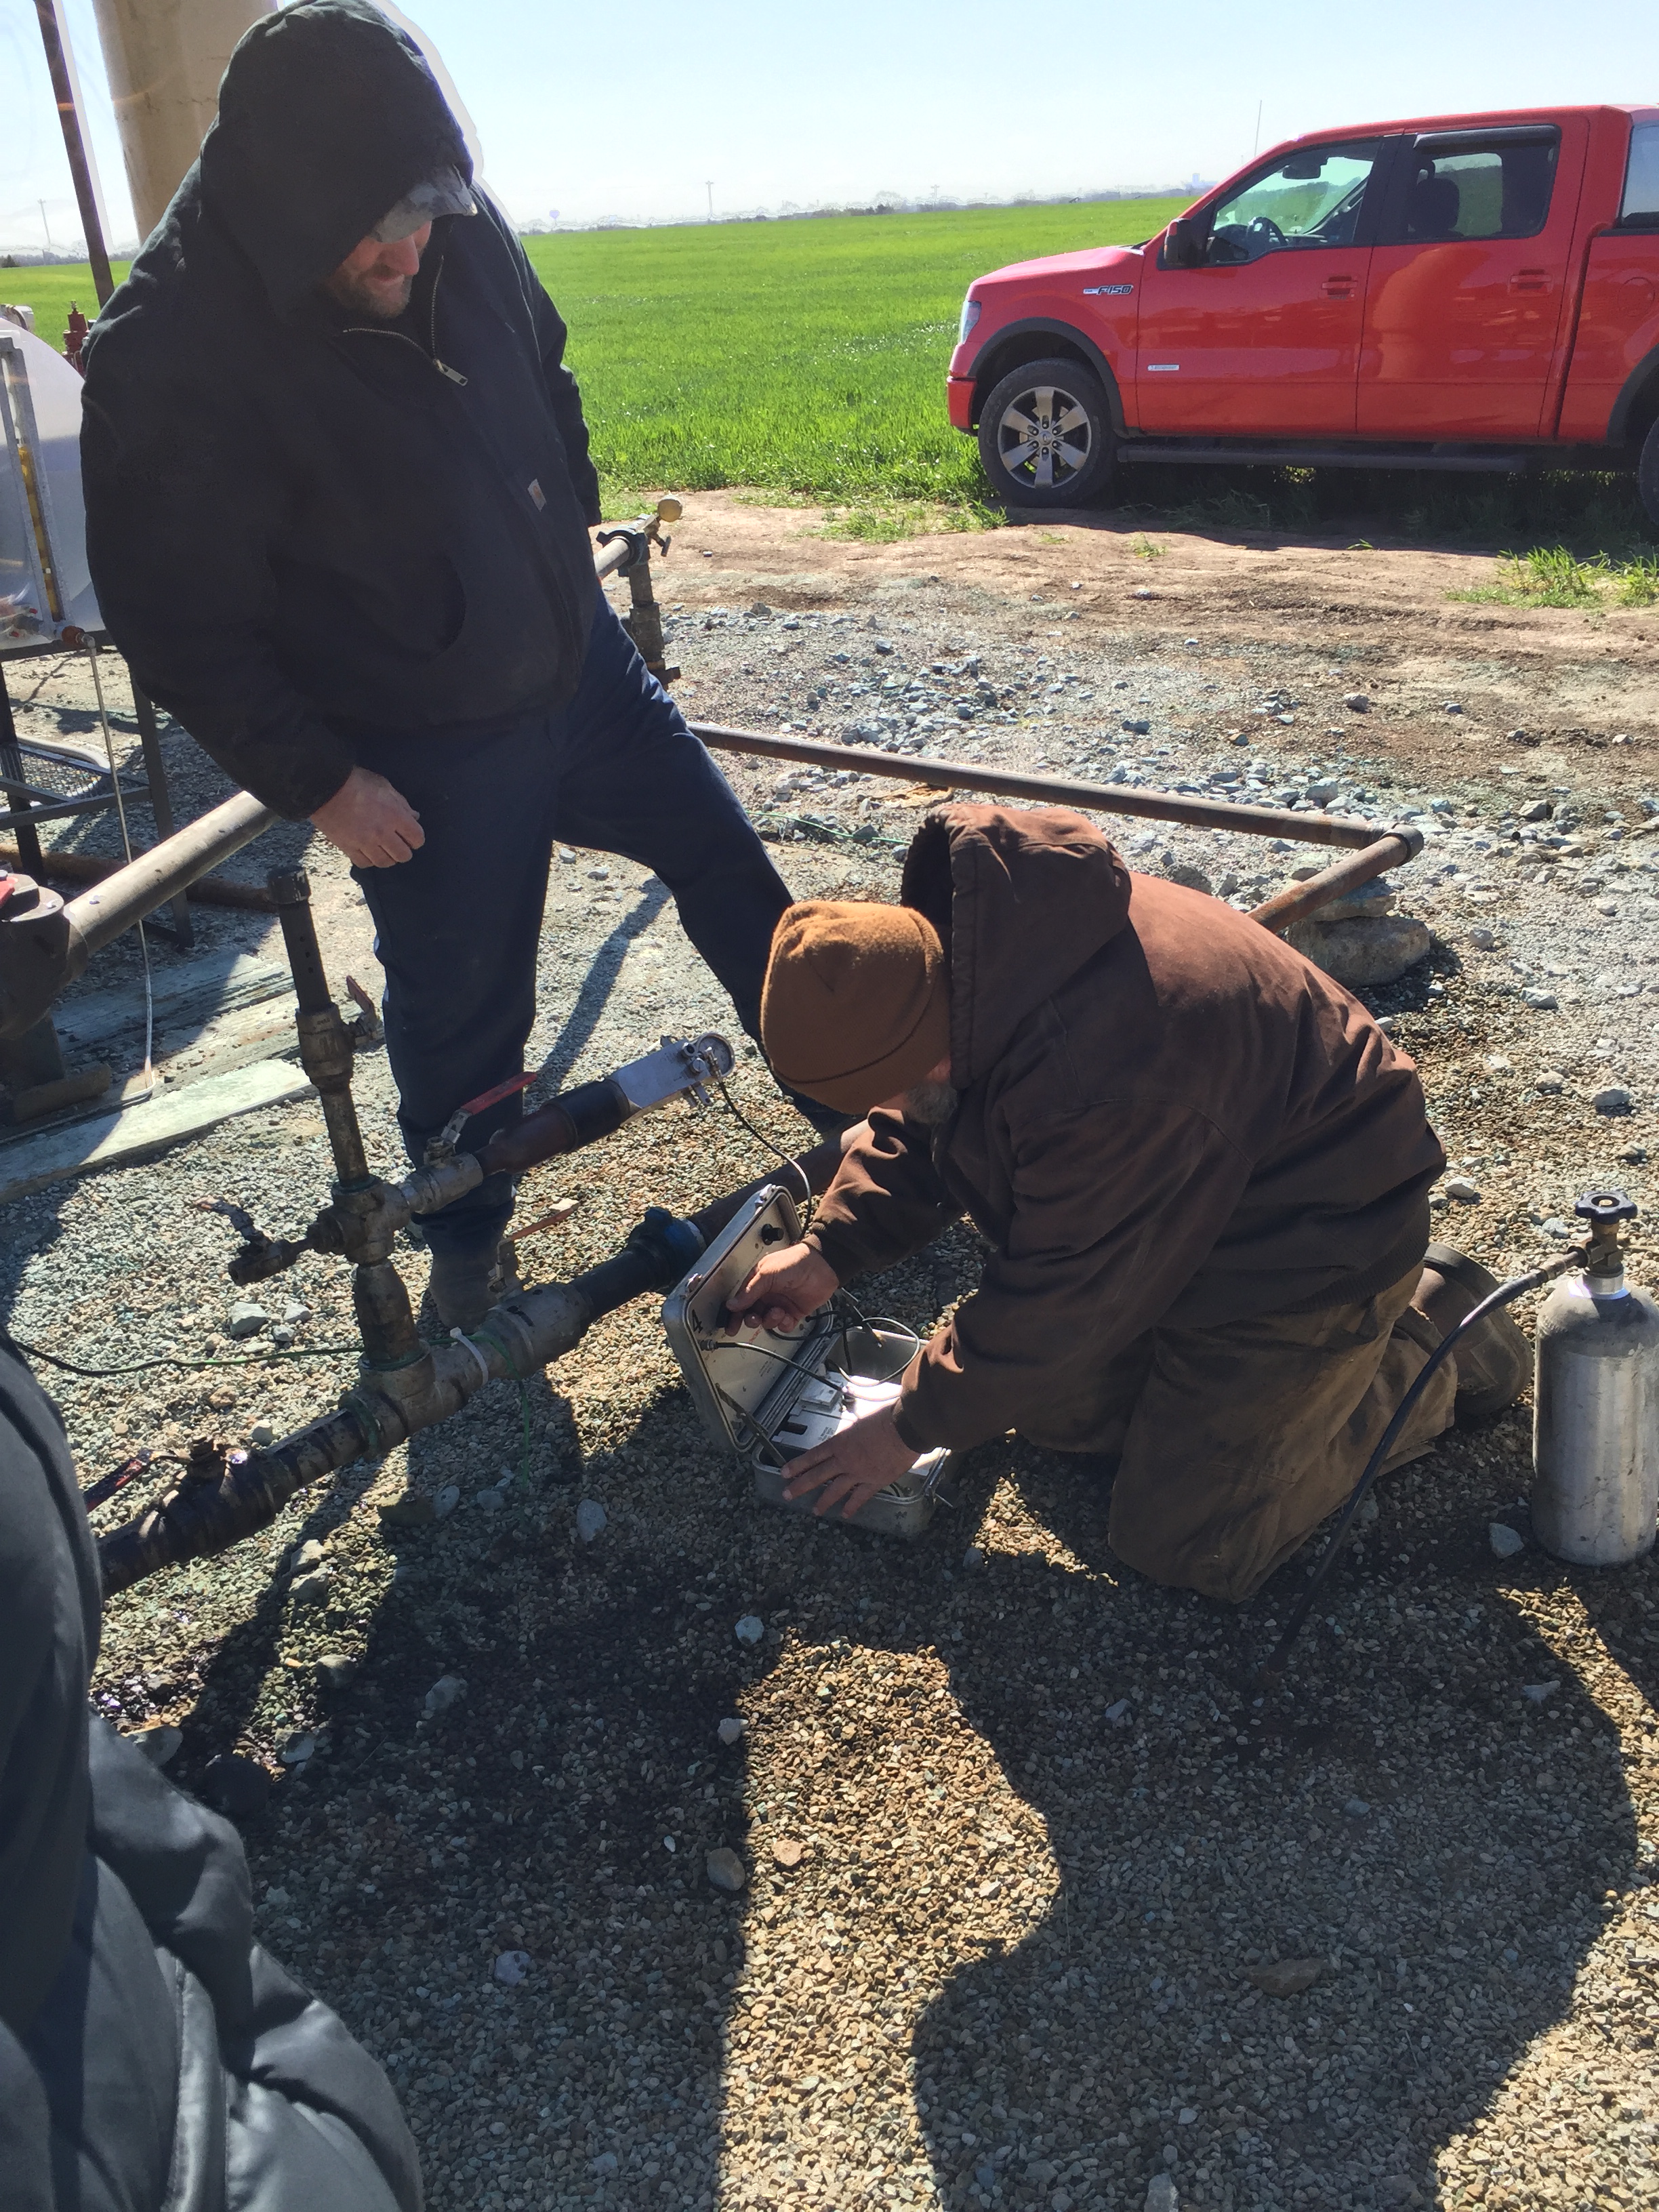
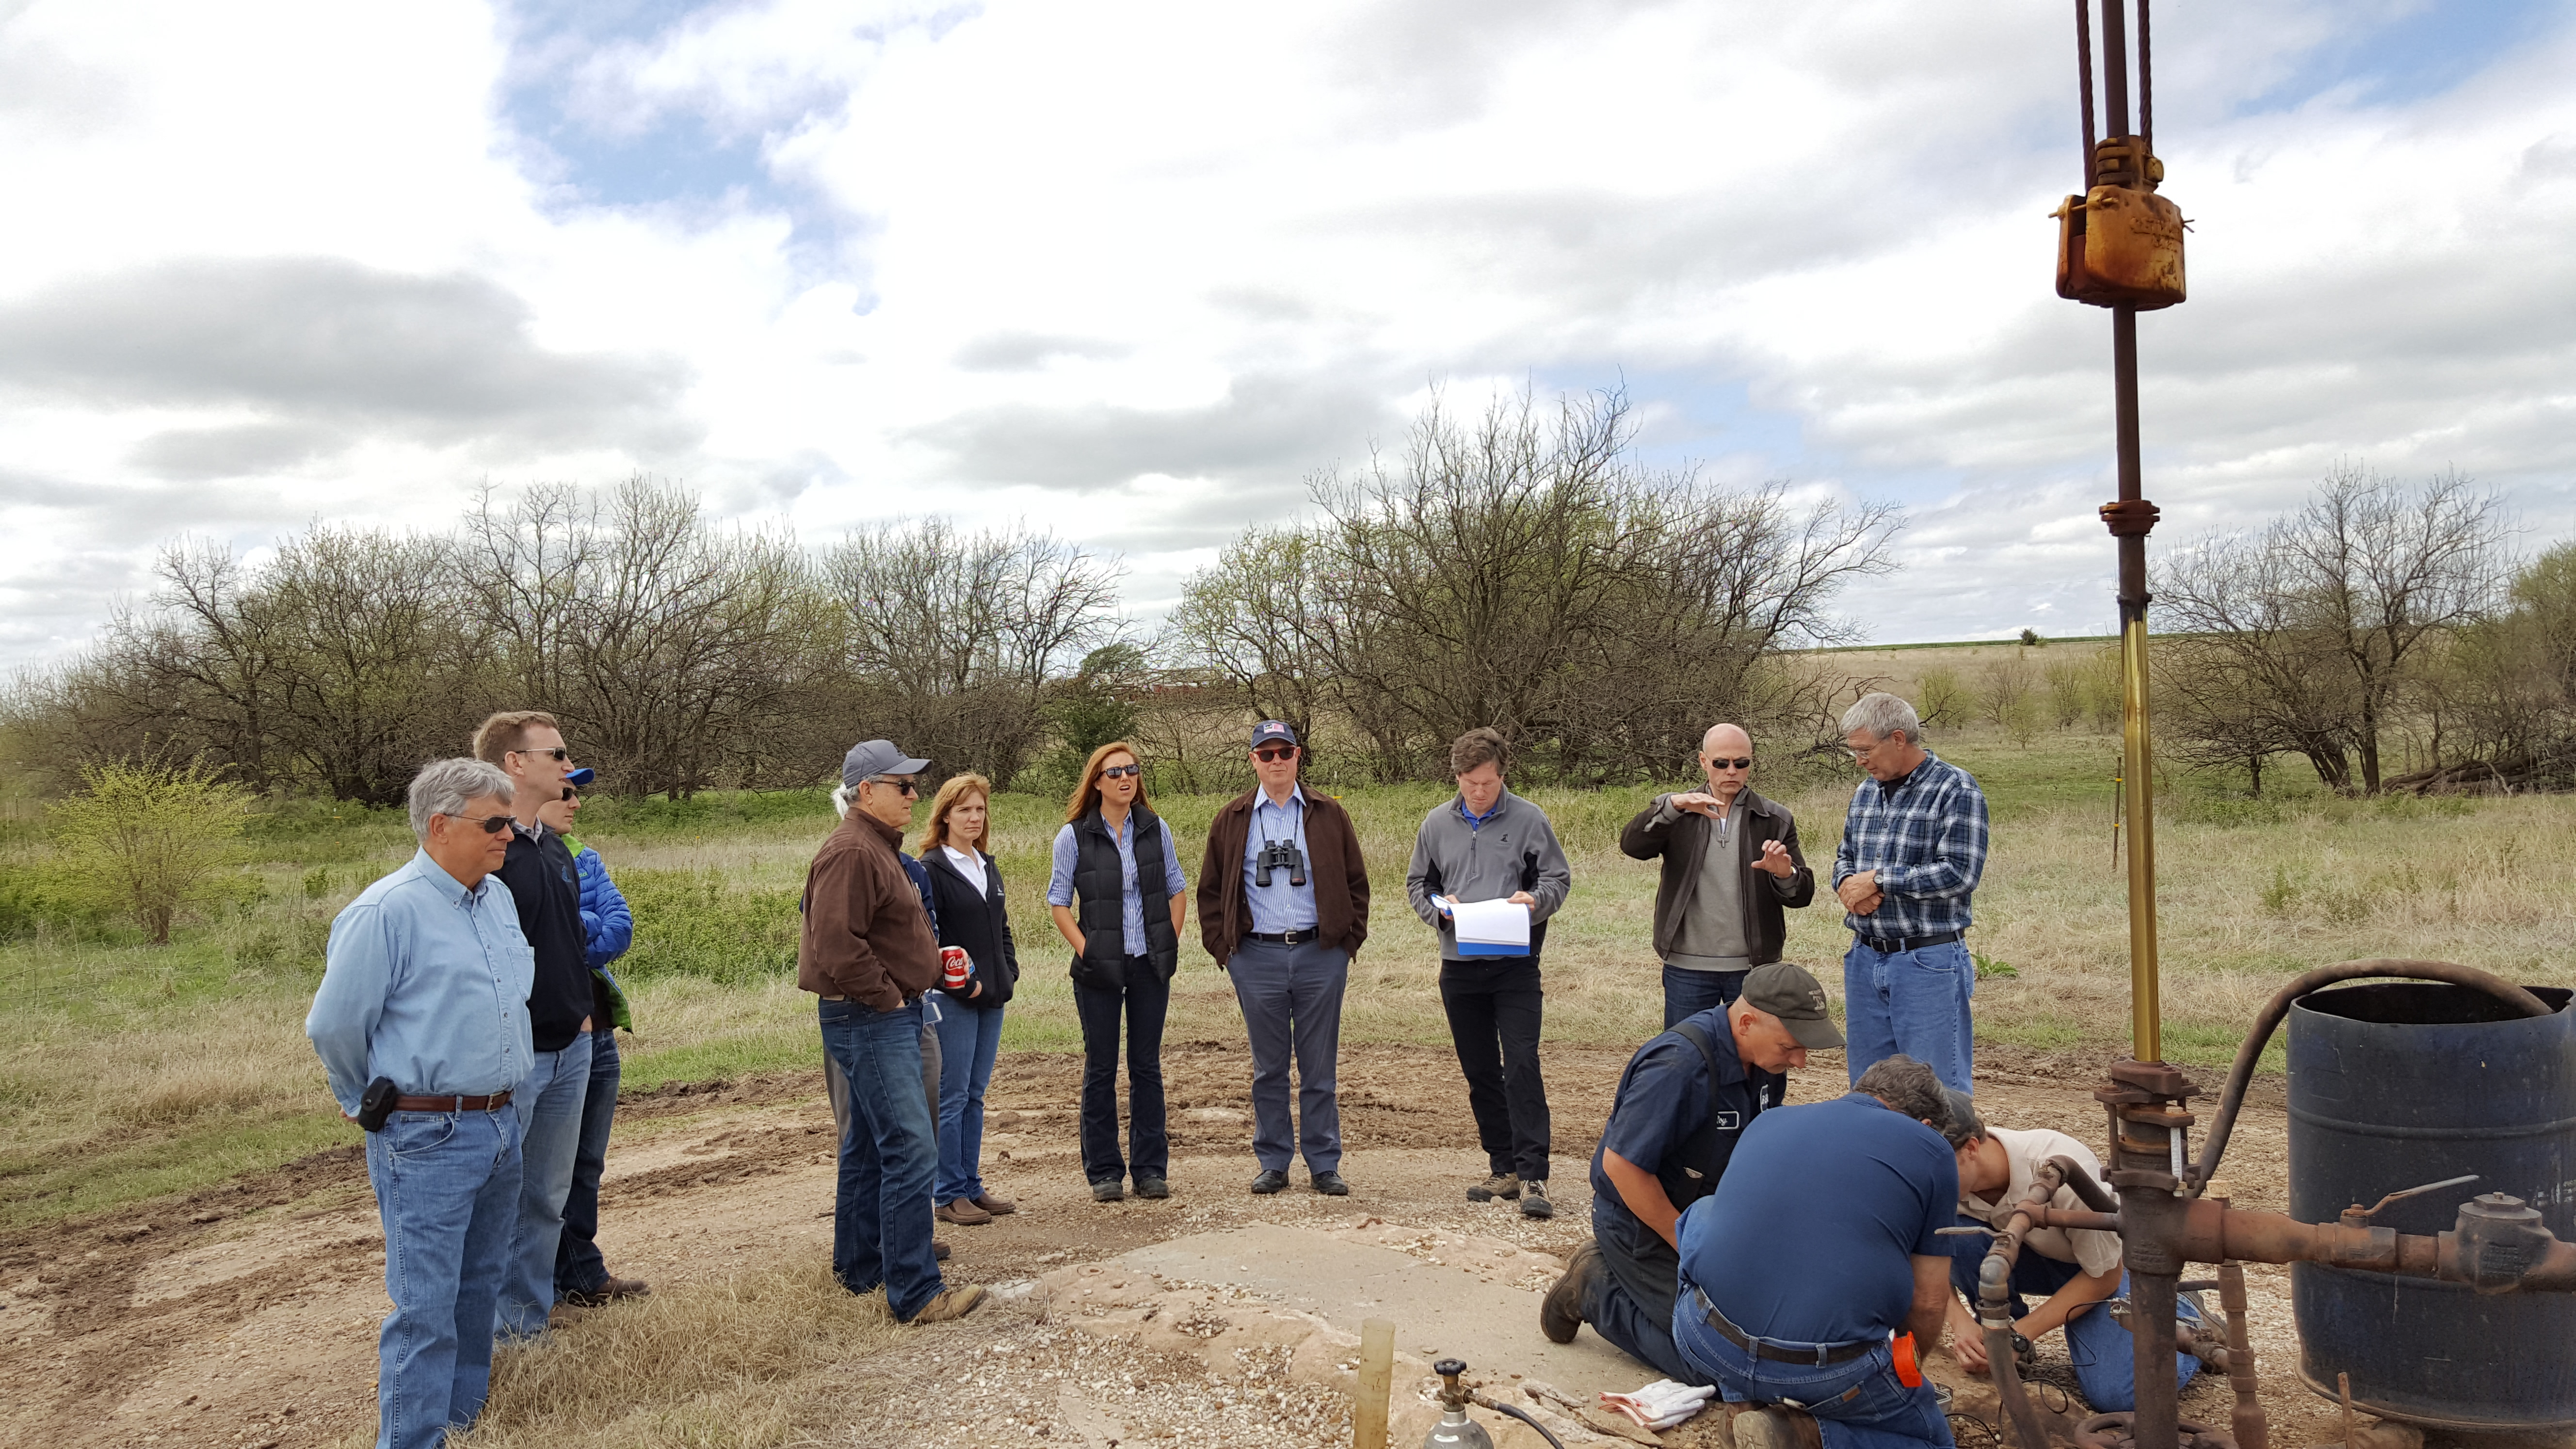
Berexco field crew conduct a fluid level measurement using an echo meter while KGS, KU, and other Berexco visitors observe.

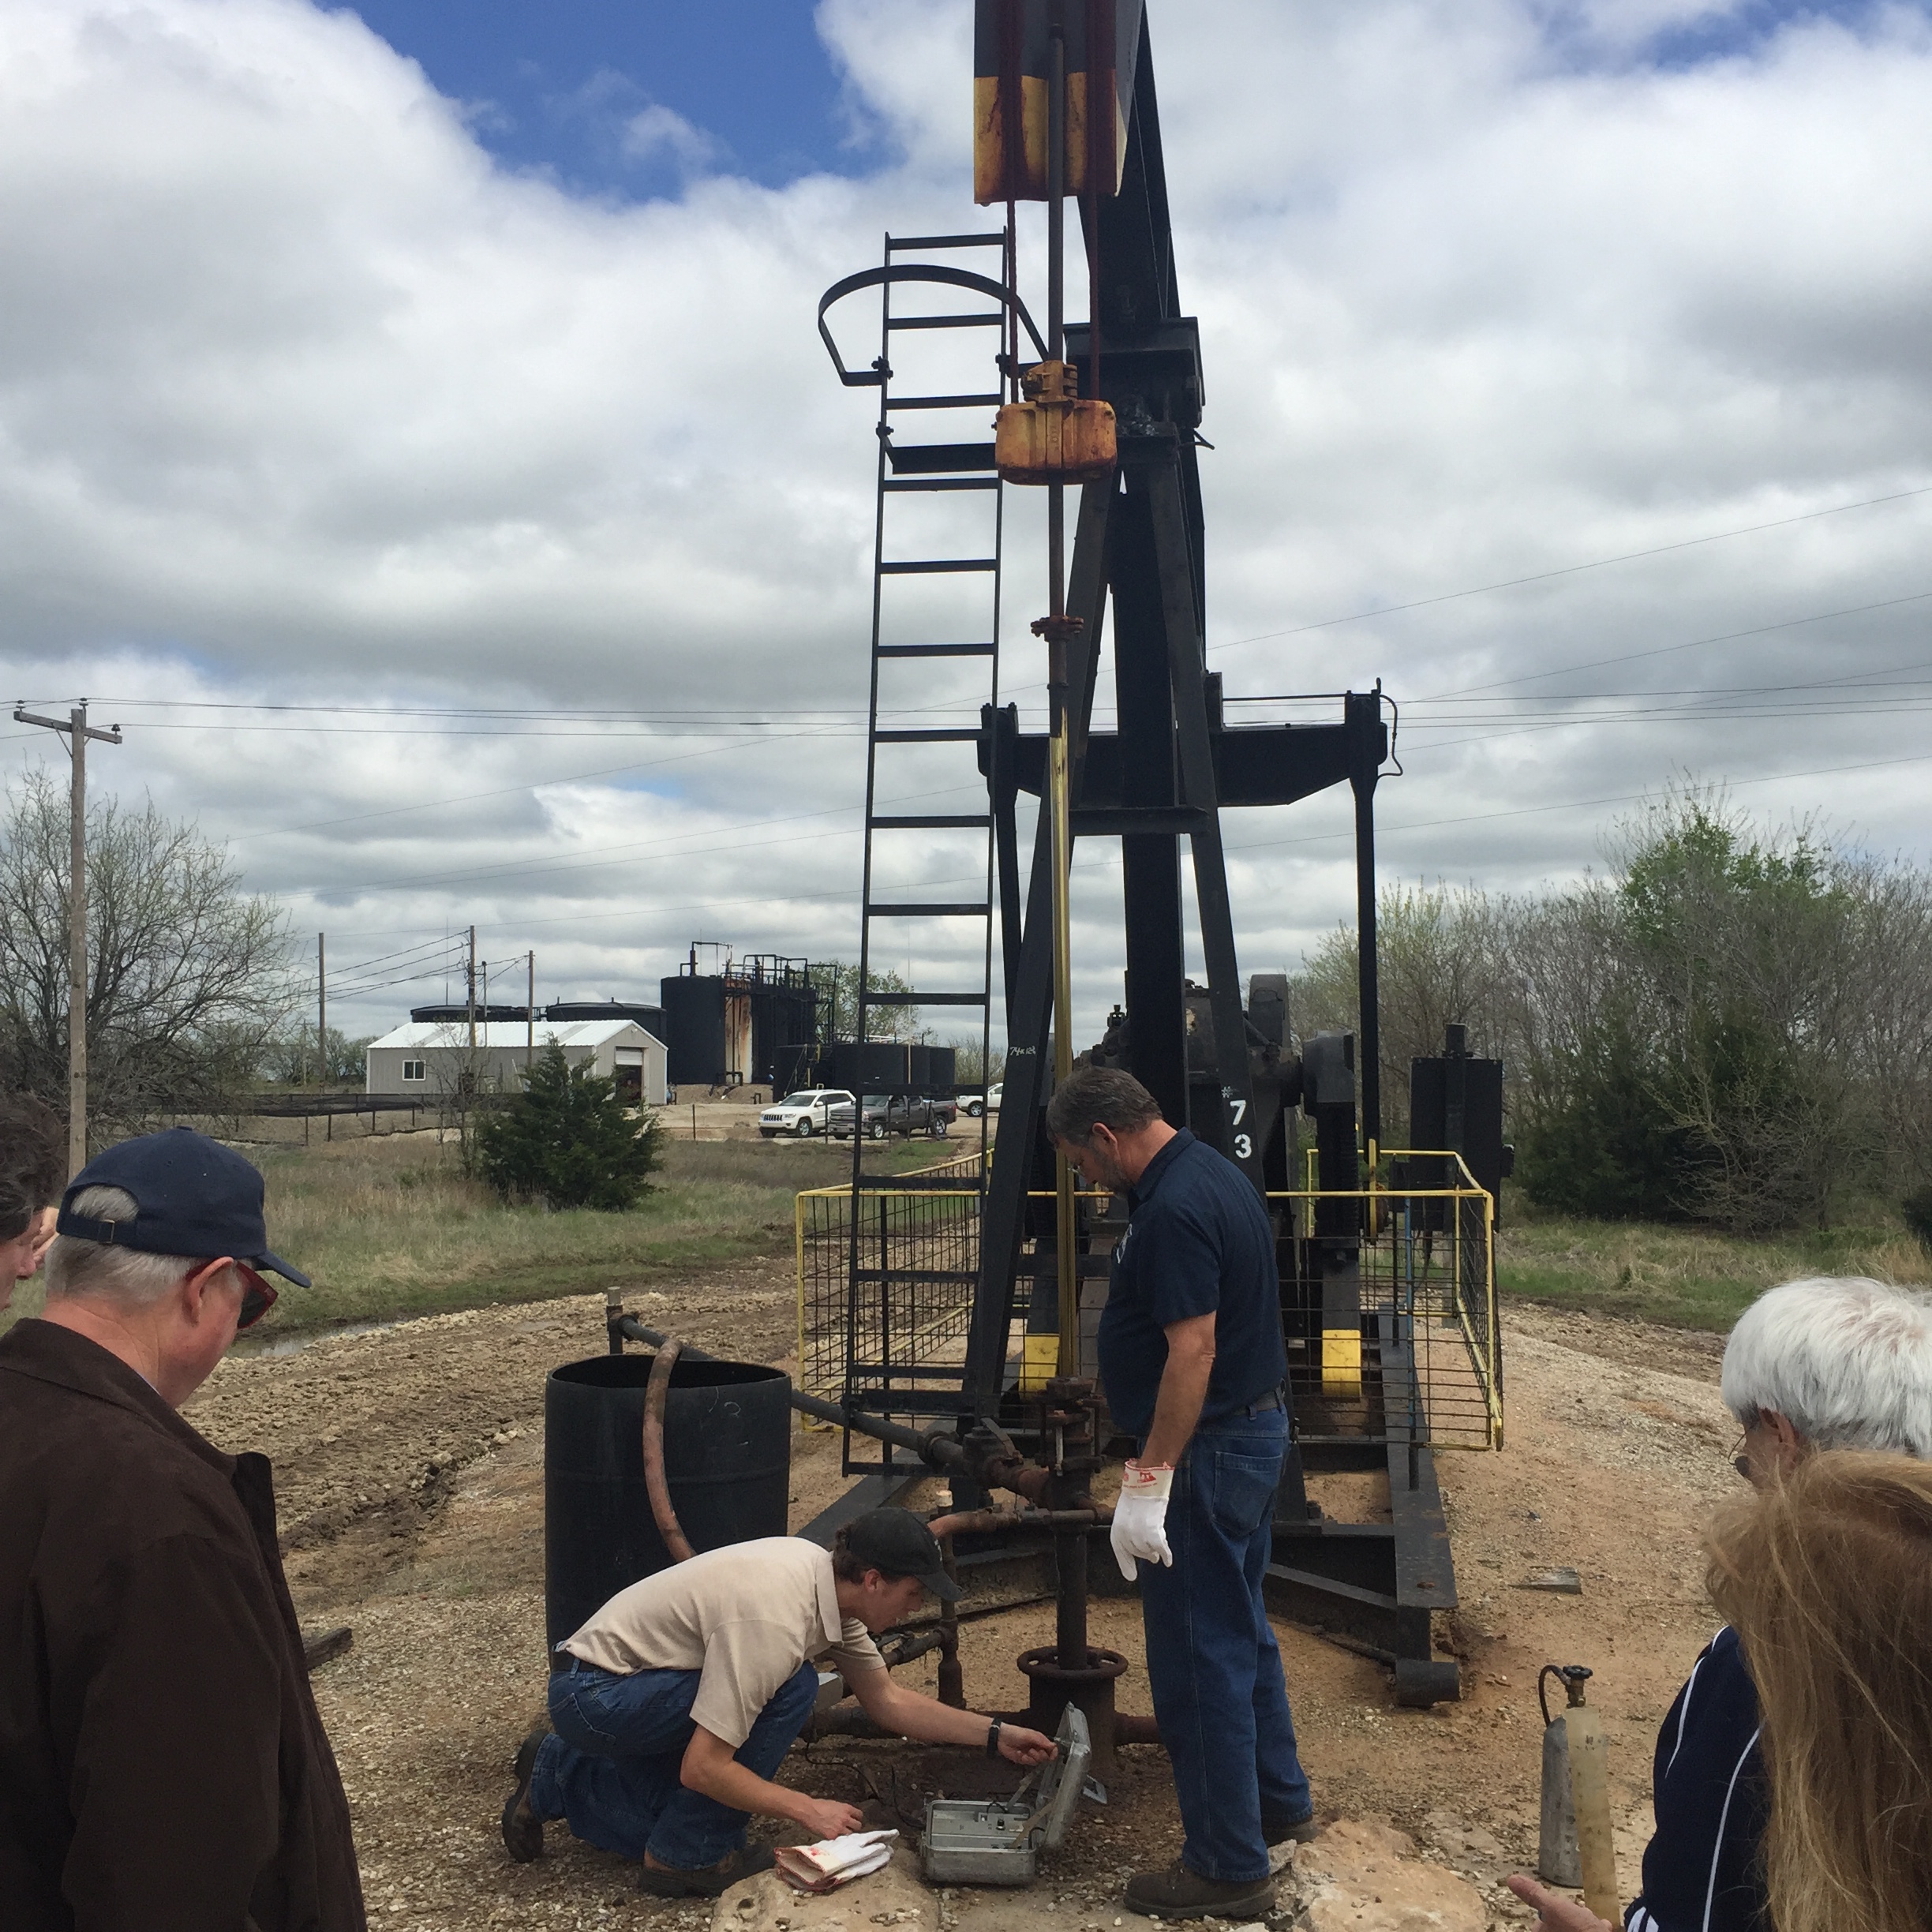
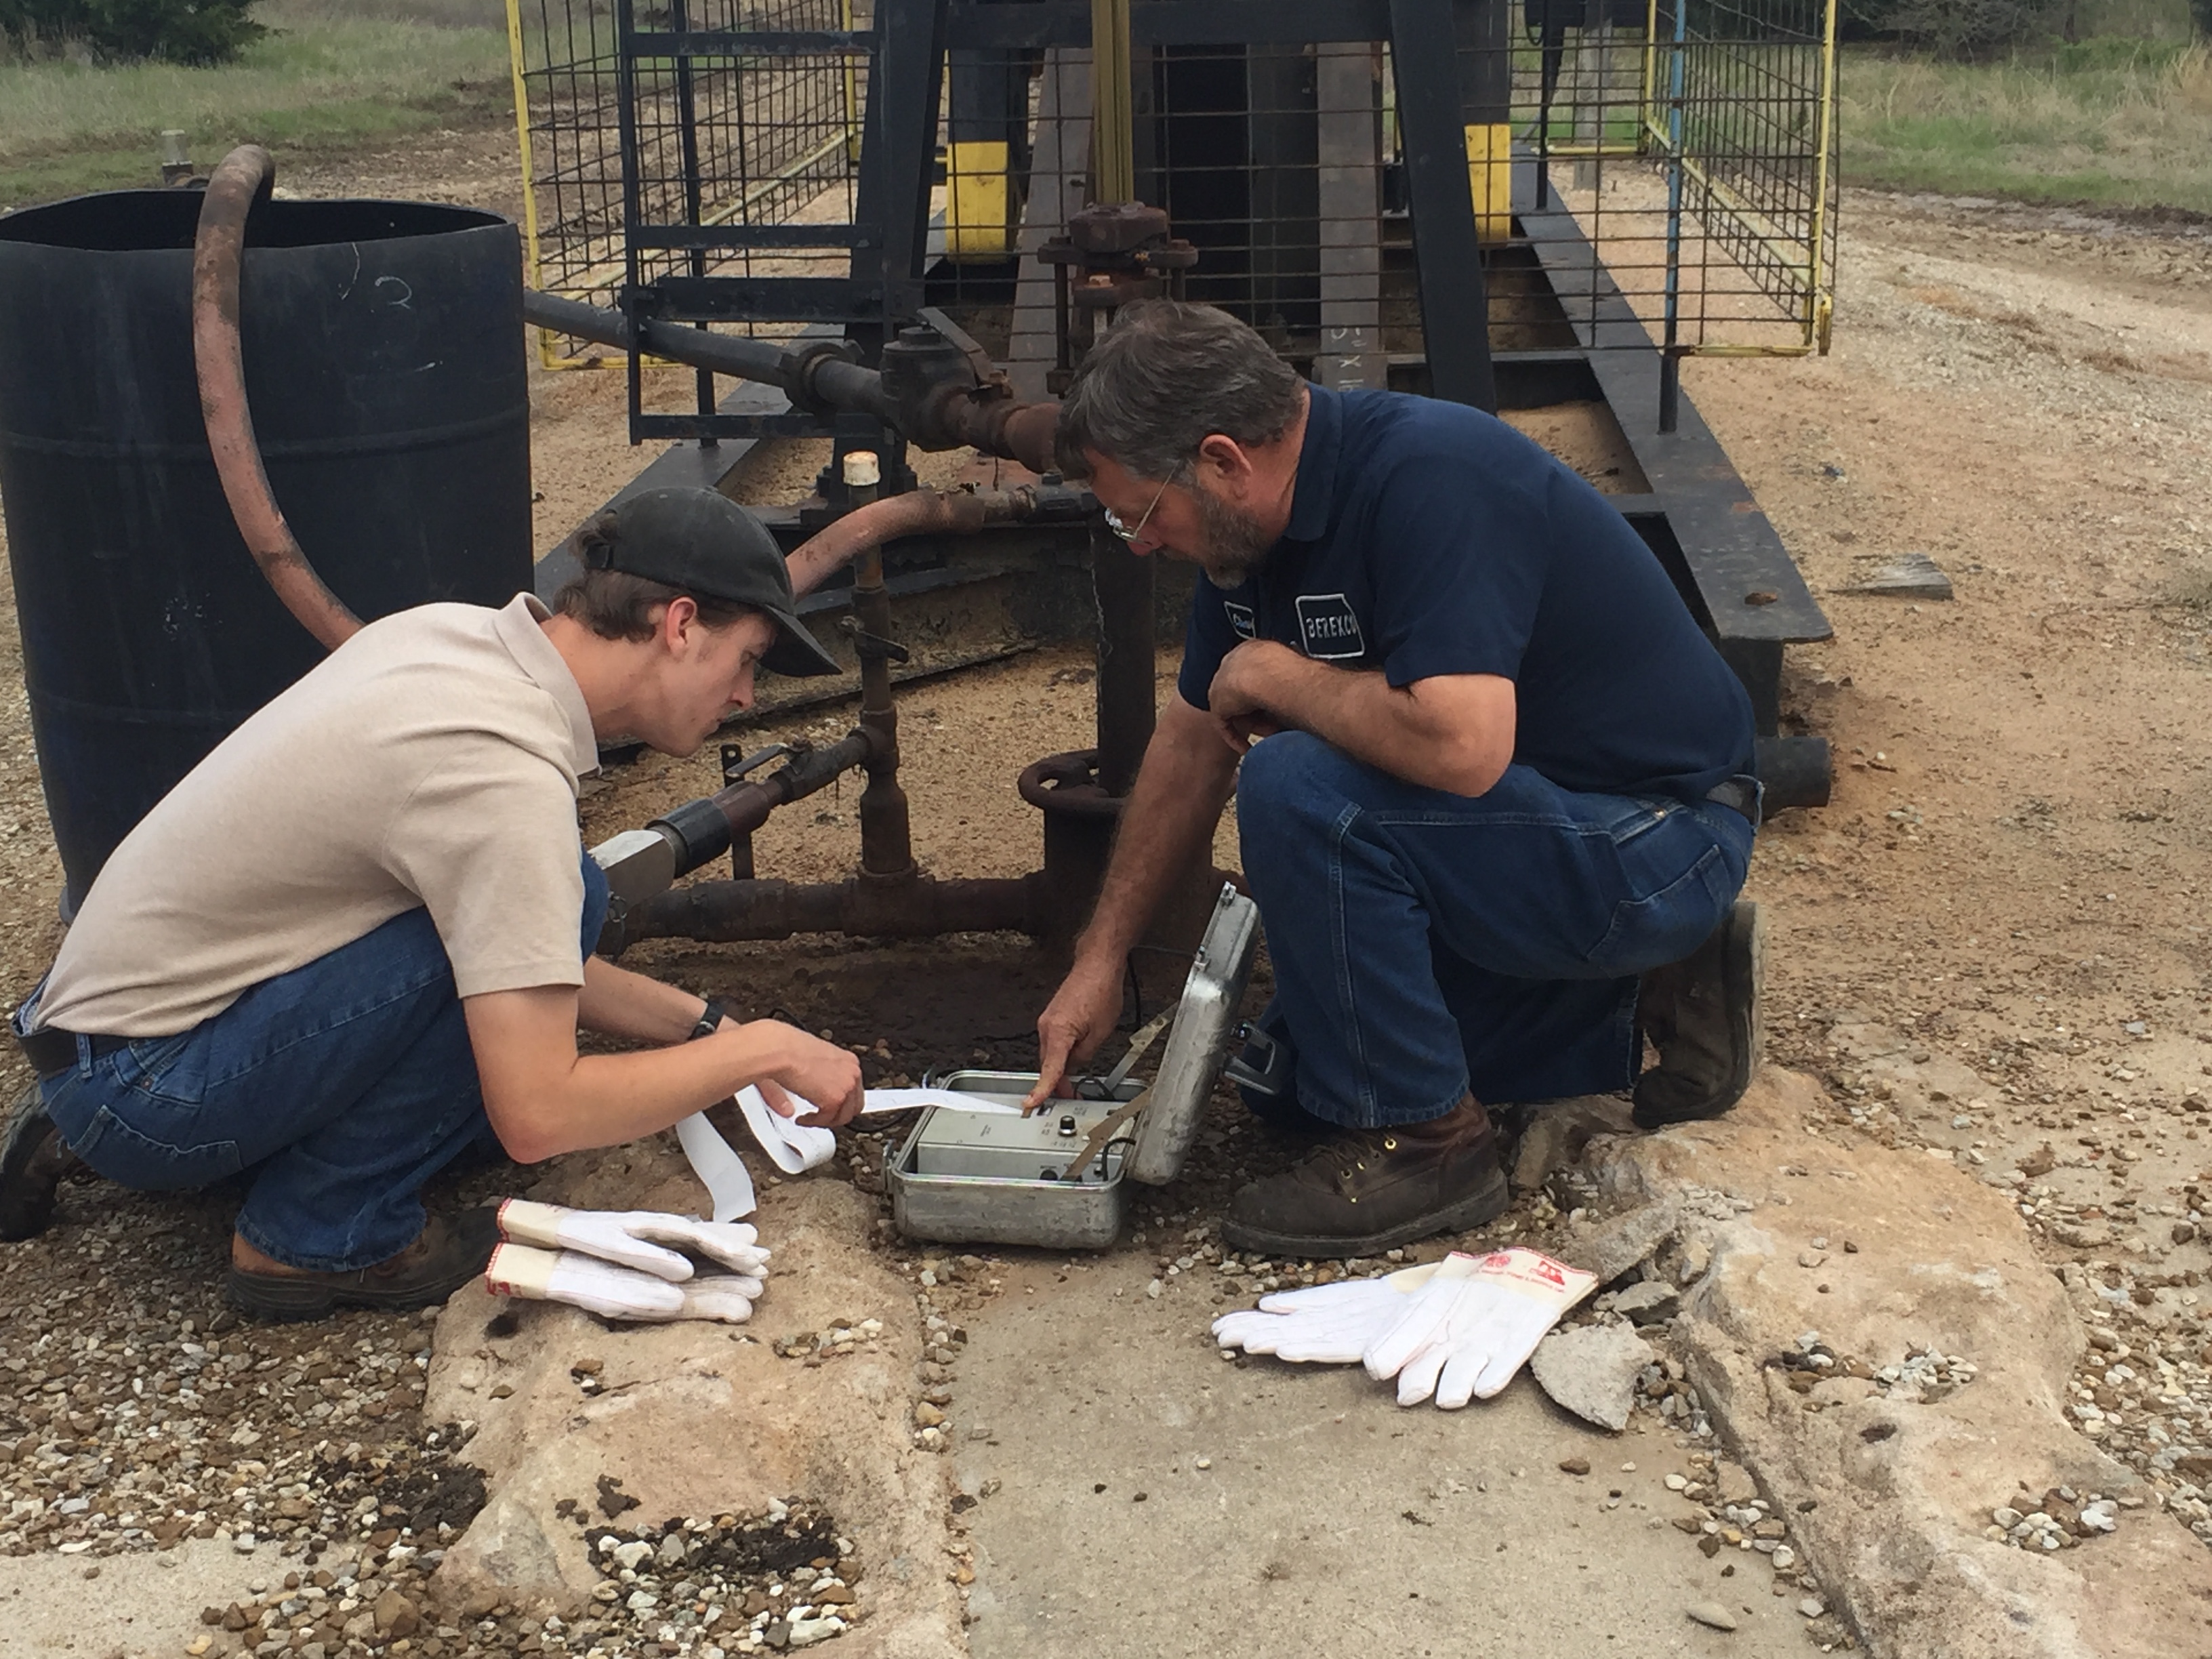
D) Brett Blazer calibrates the echo meter for the fluid measurement readings.

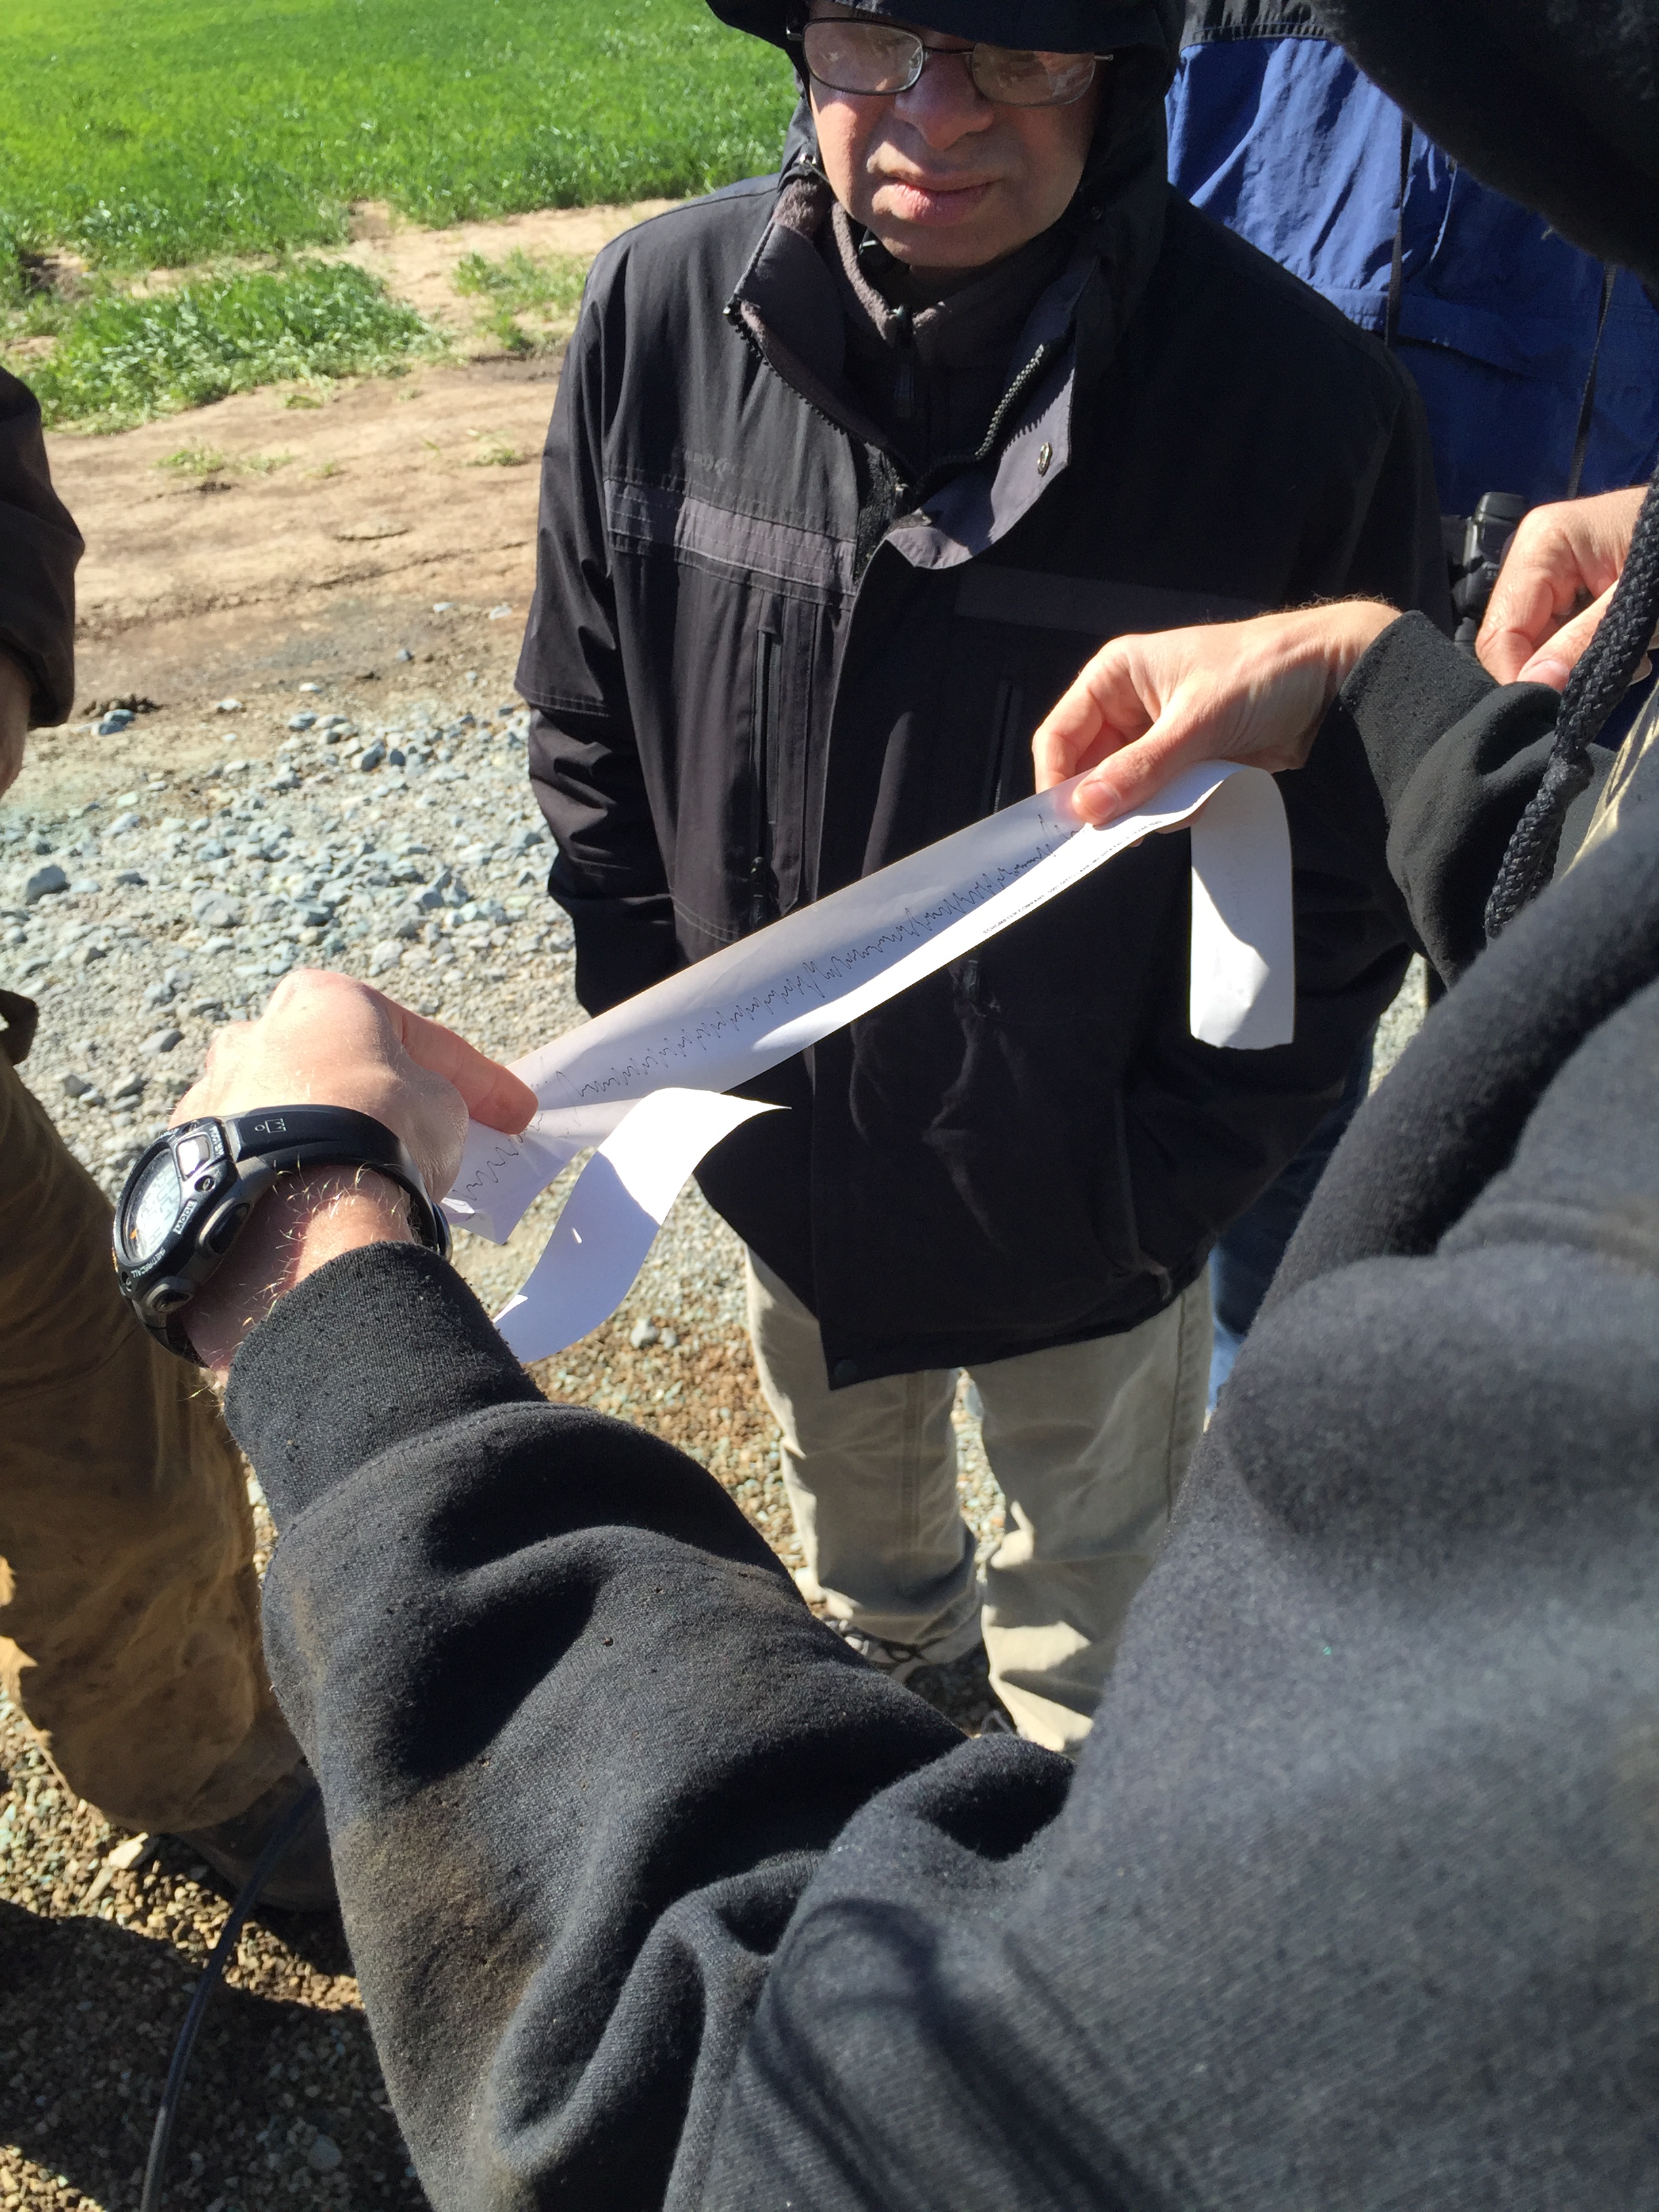
Measurements from the fluid level test are printed from the echo meter. Brett Blazer reviews the output for completeness.

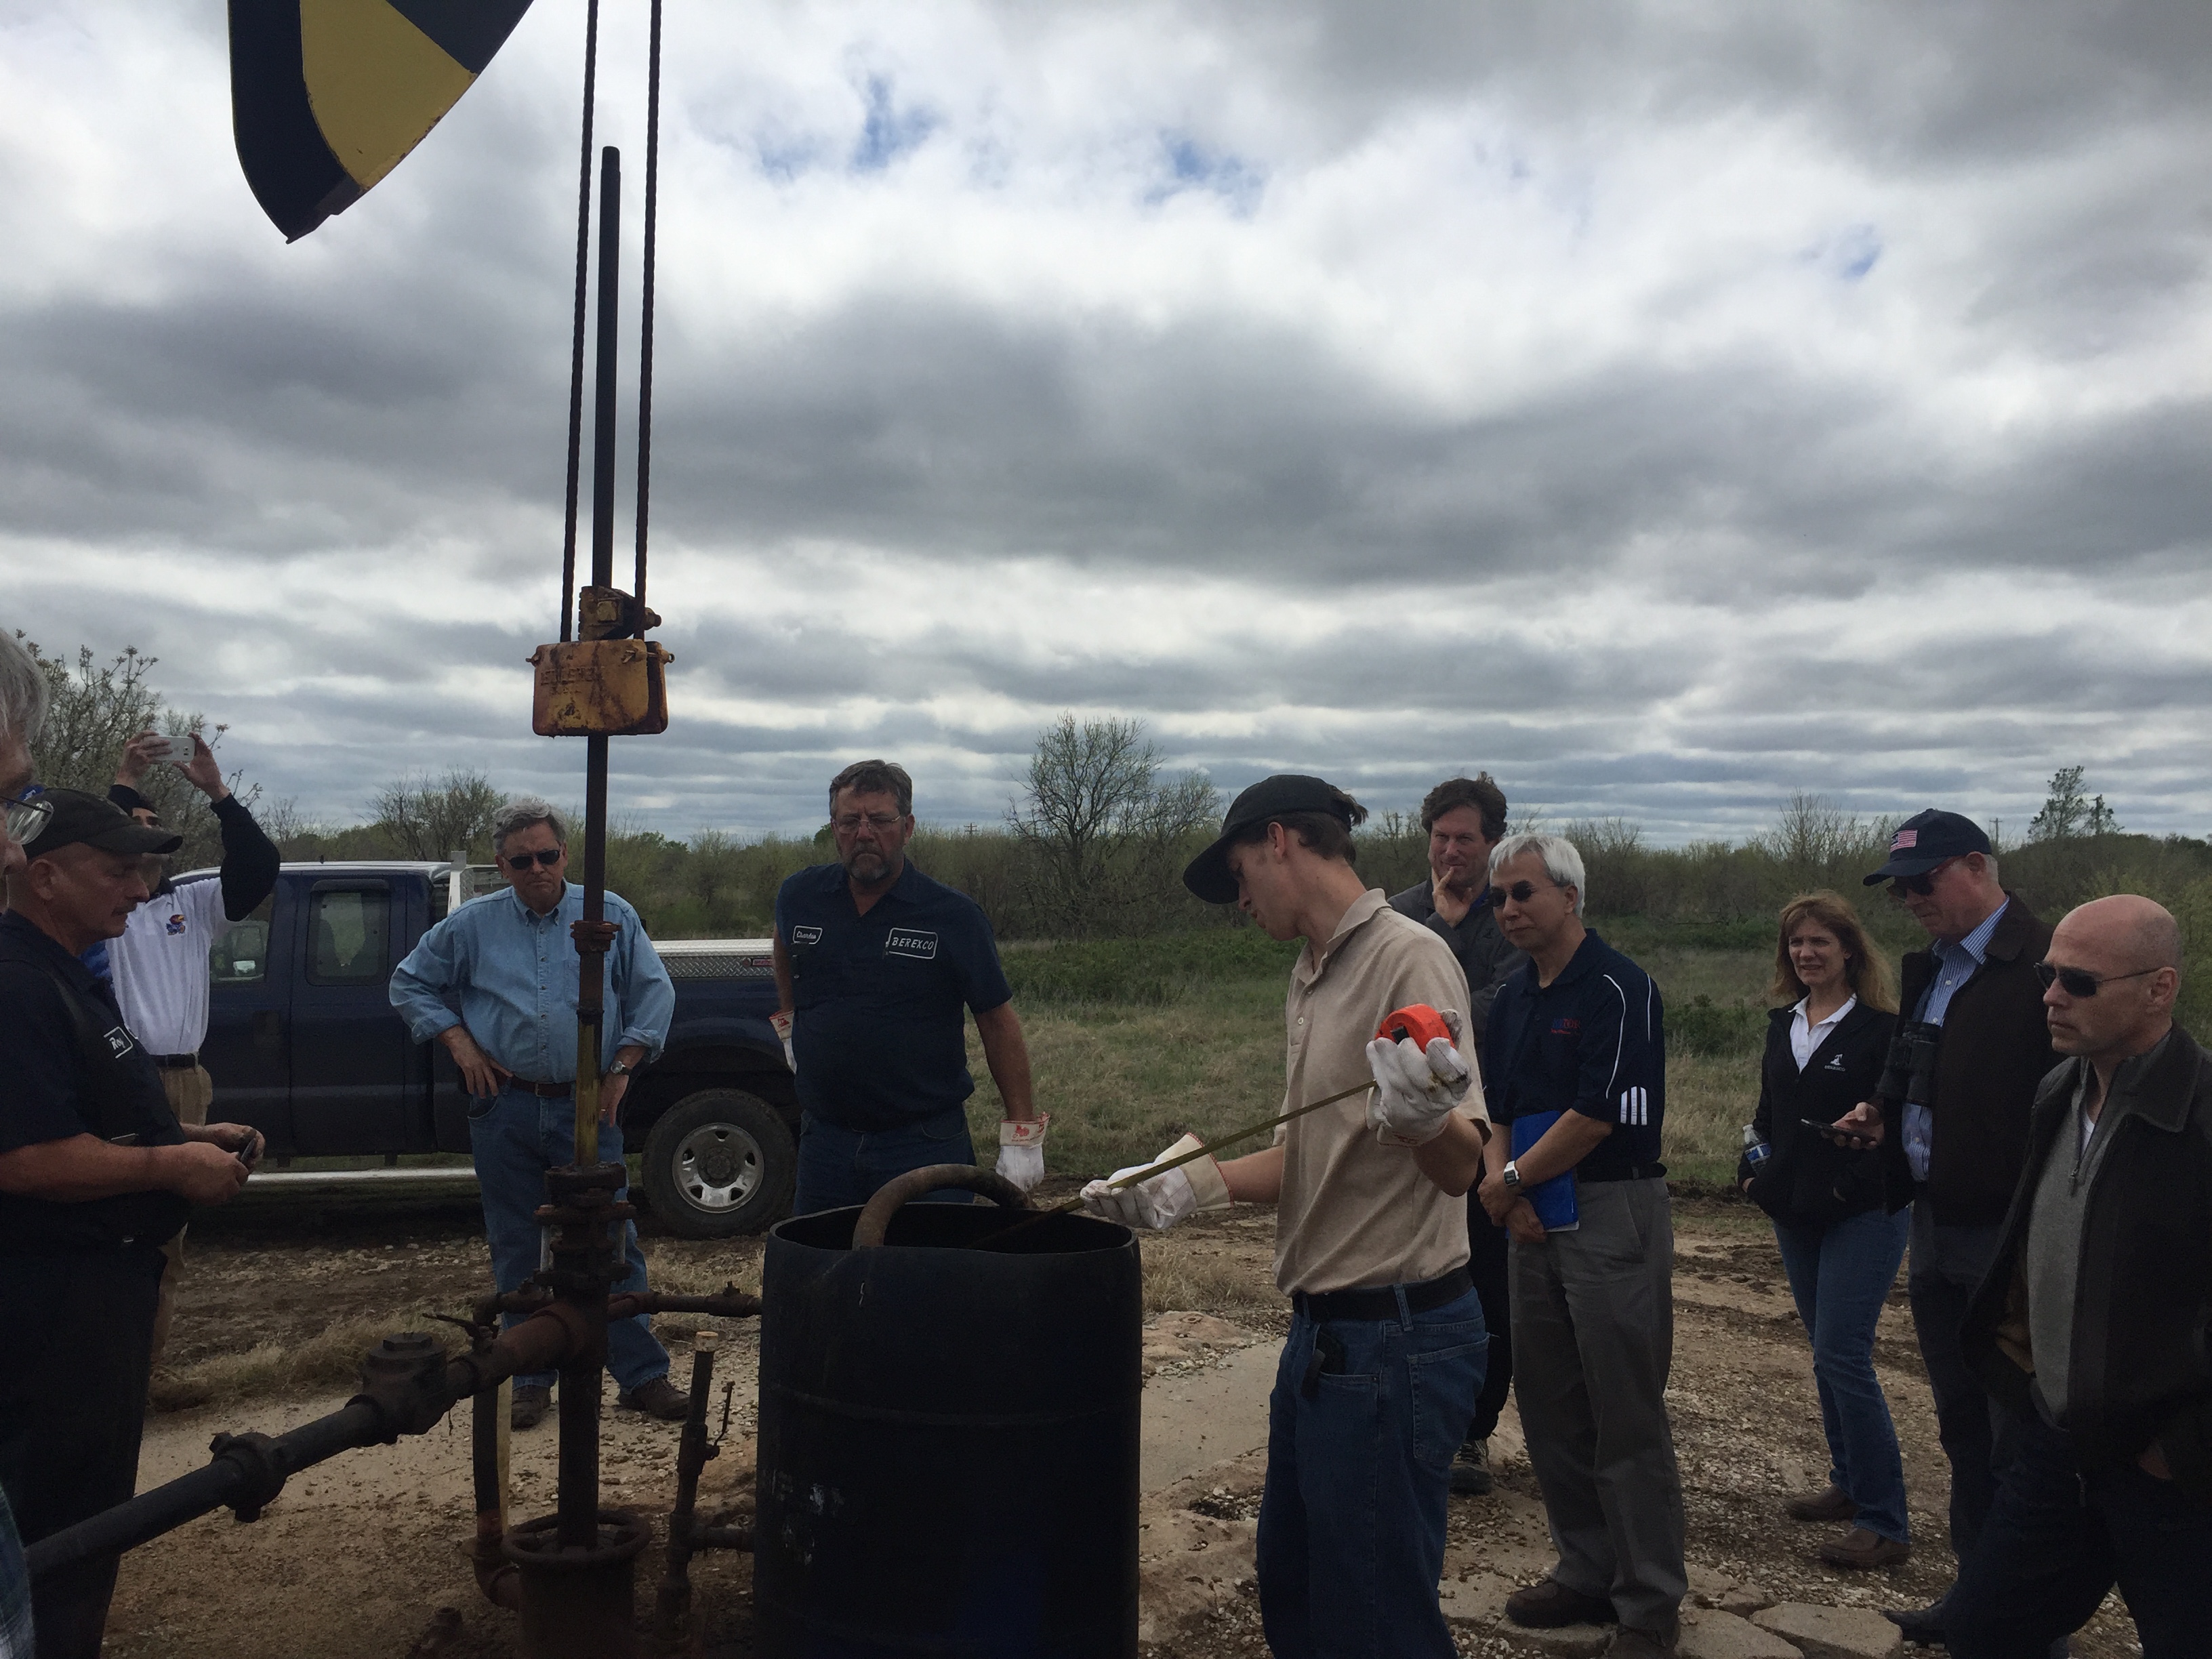
Brett Blazer demonstrates how produced fluid is measured and estimated from Wellington Unit #73.

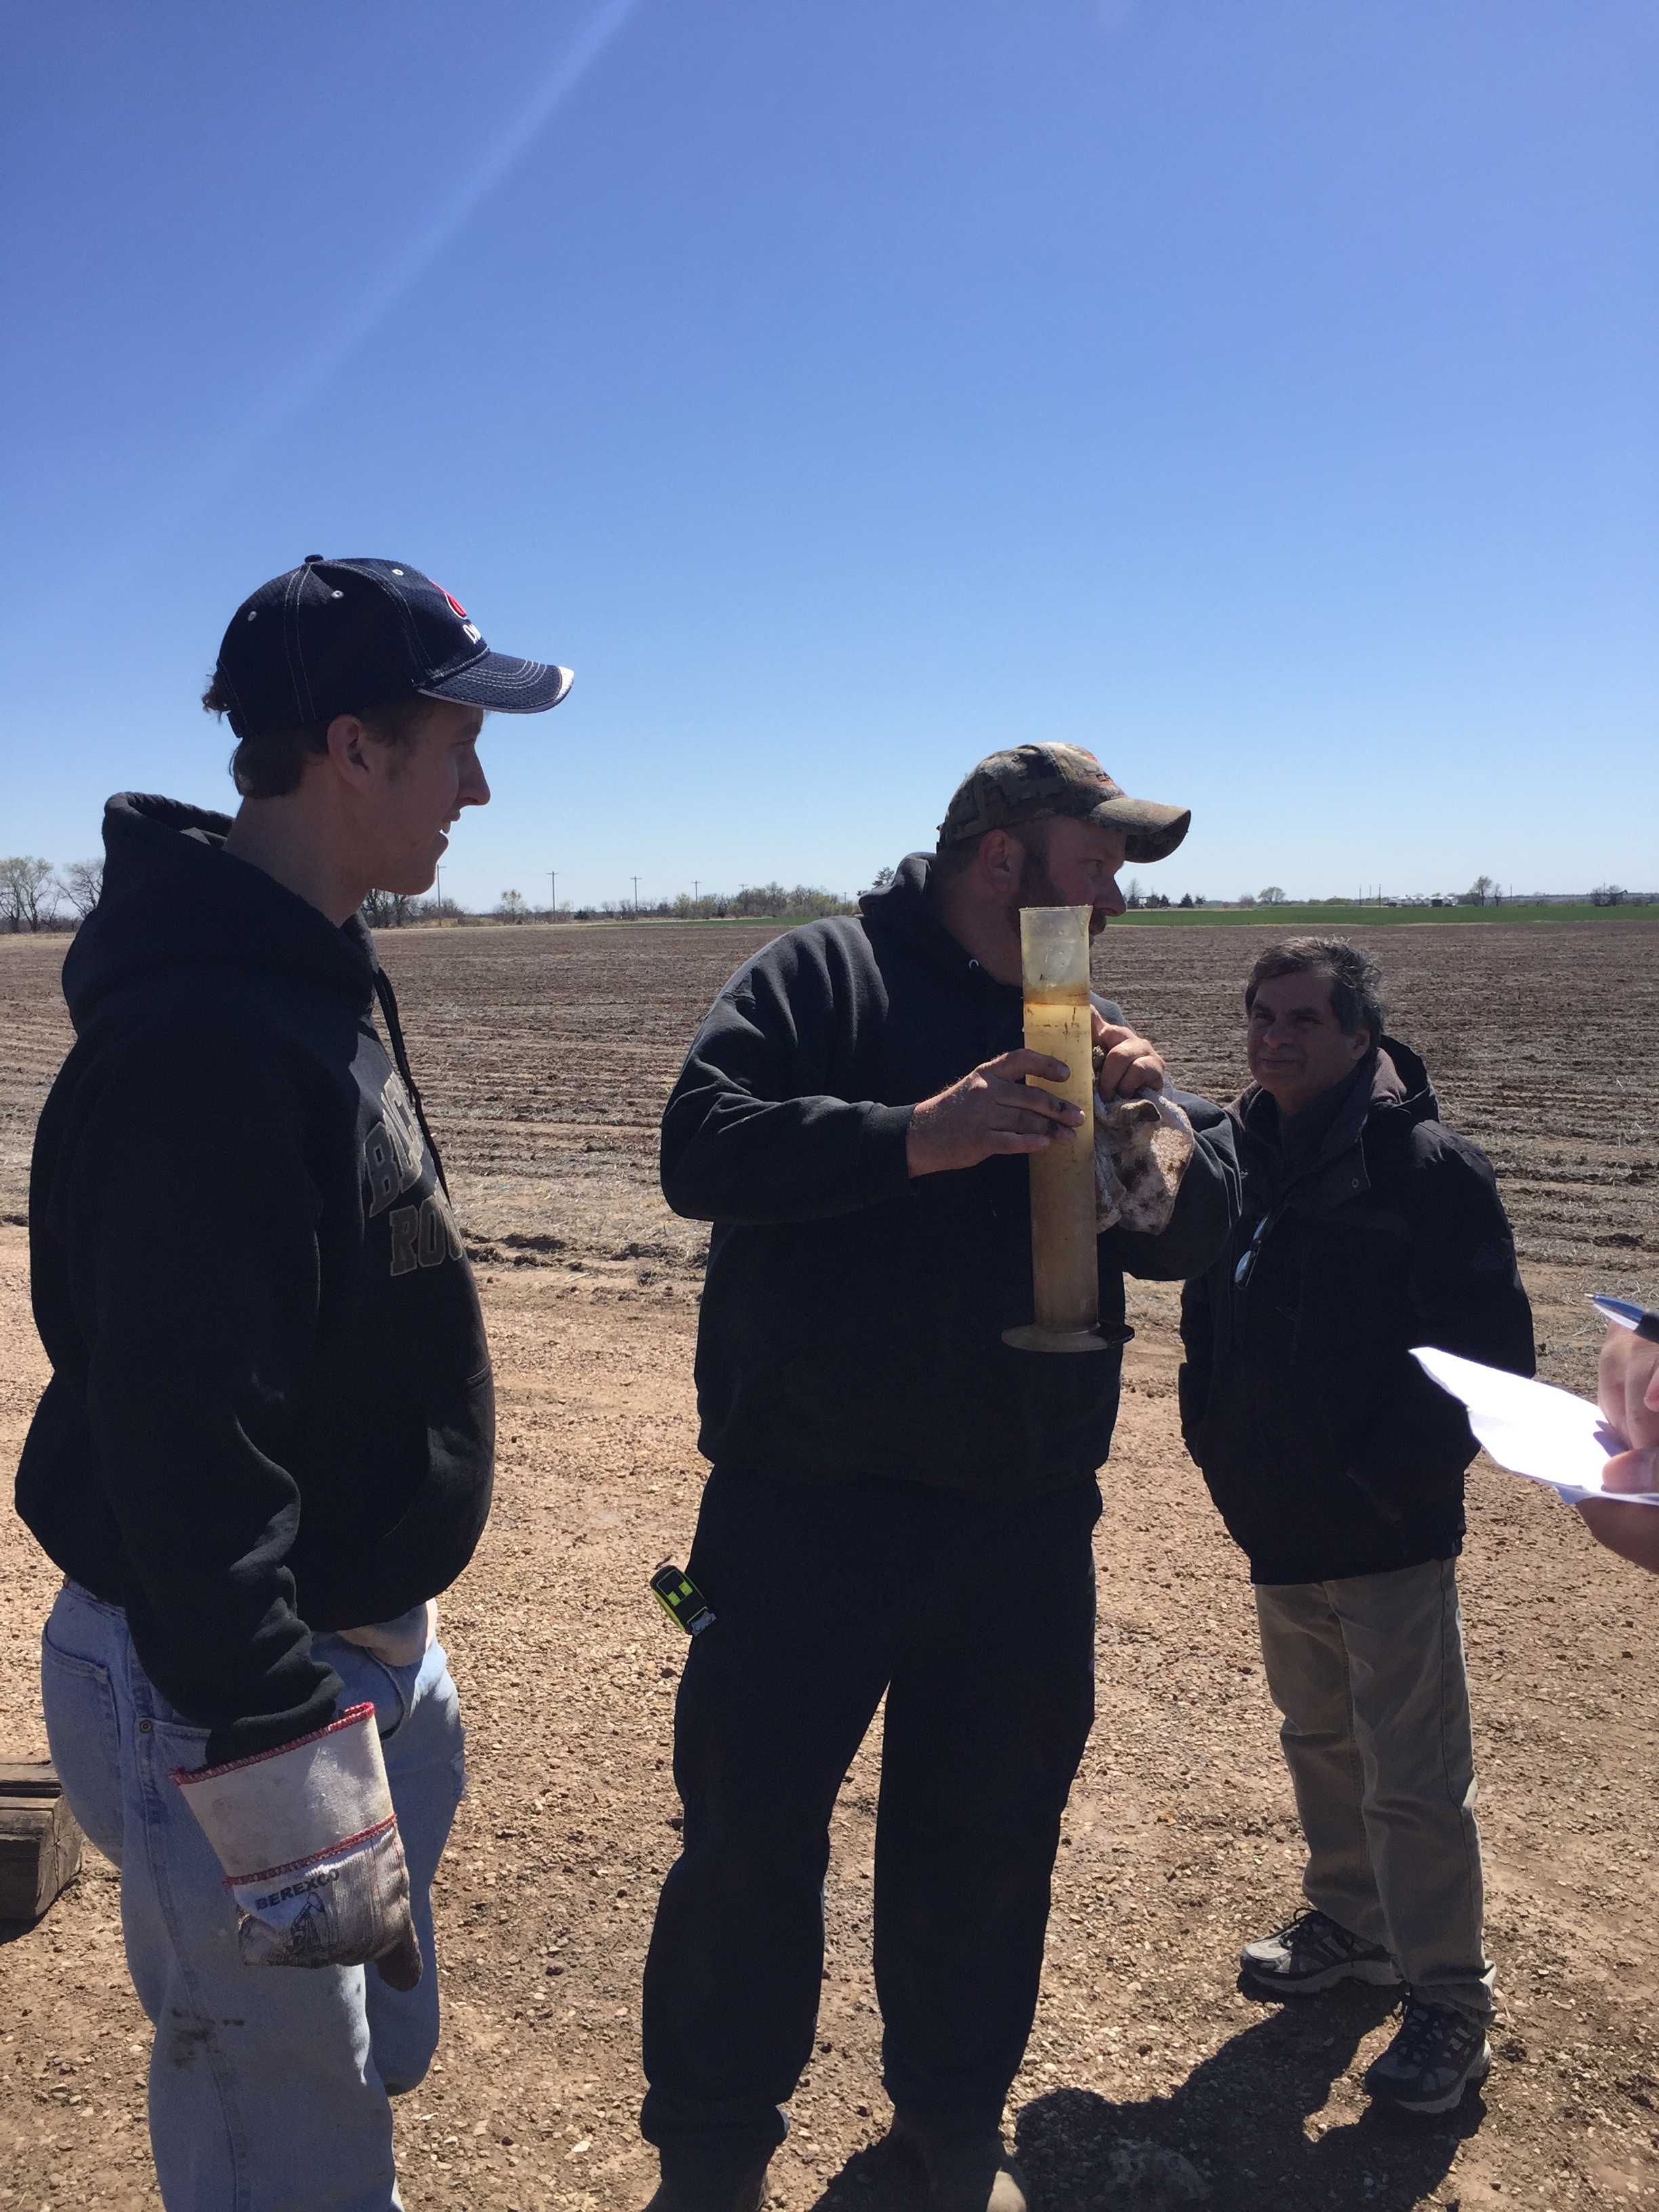
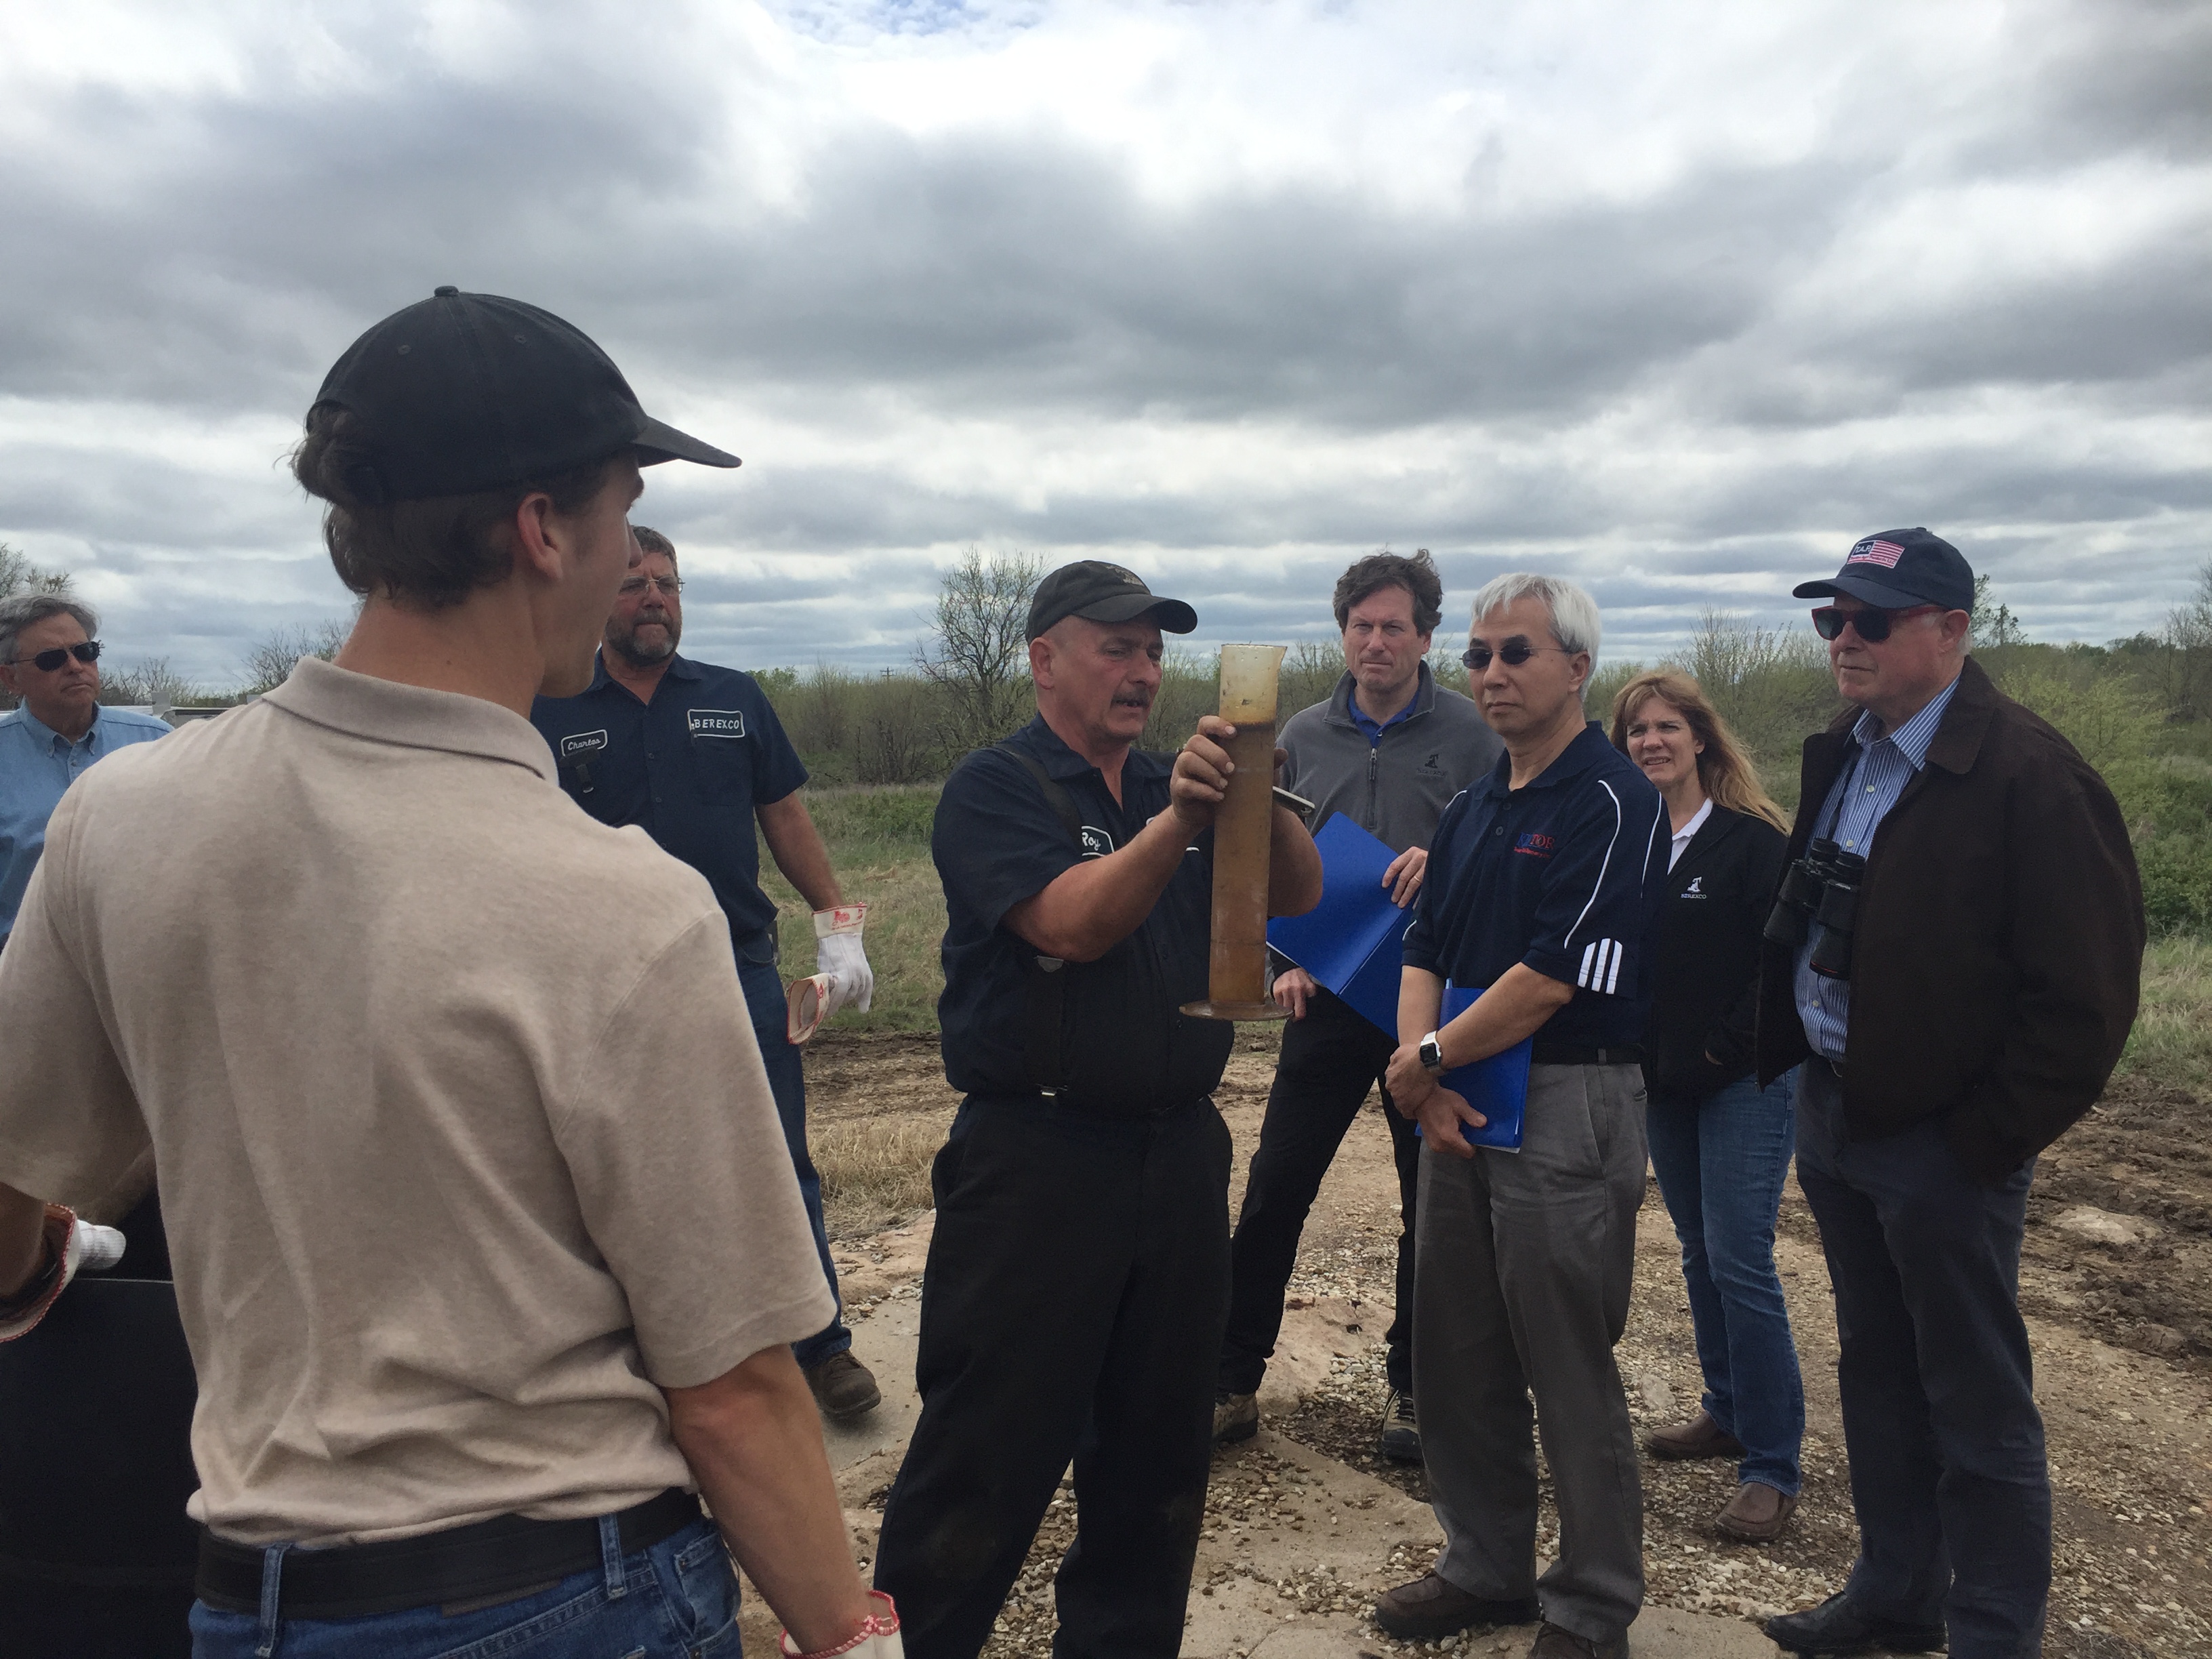
Roy Shepherd takes an oil cut reading from Wellington Unit #73. He explains that the foamy appearance of the oil is unusual, and is indicative of the presence of CO2 from the reservoir. These observations are continually noted from sampling performed around the field, and details are recorded into a KGS data page for the Wellington CO2 flood.

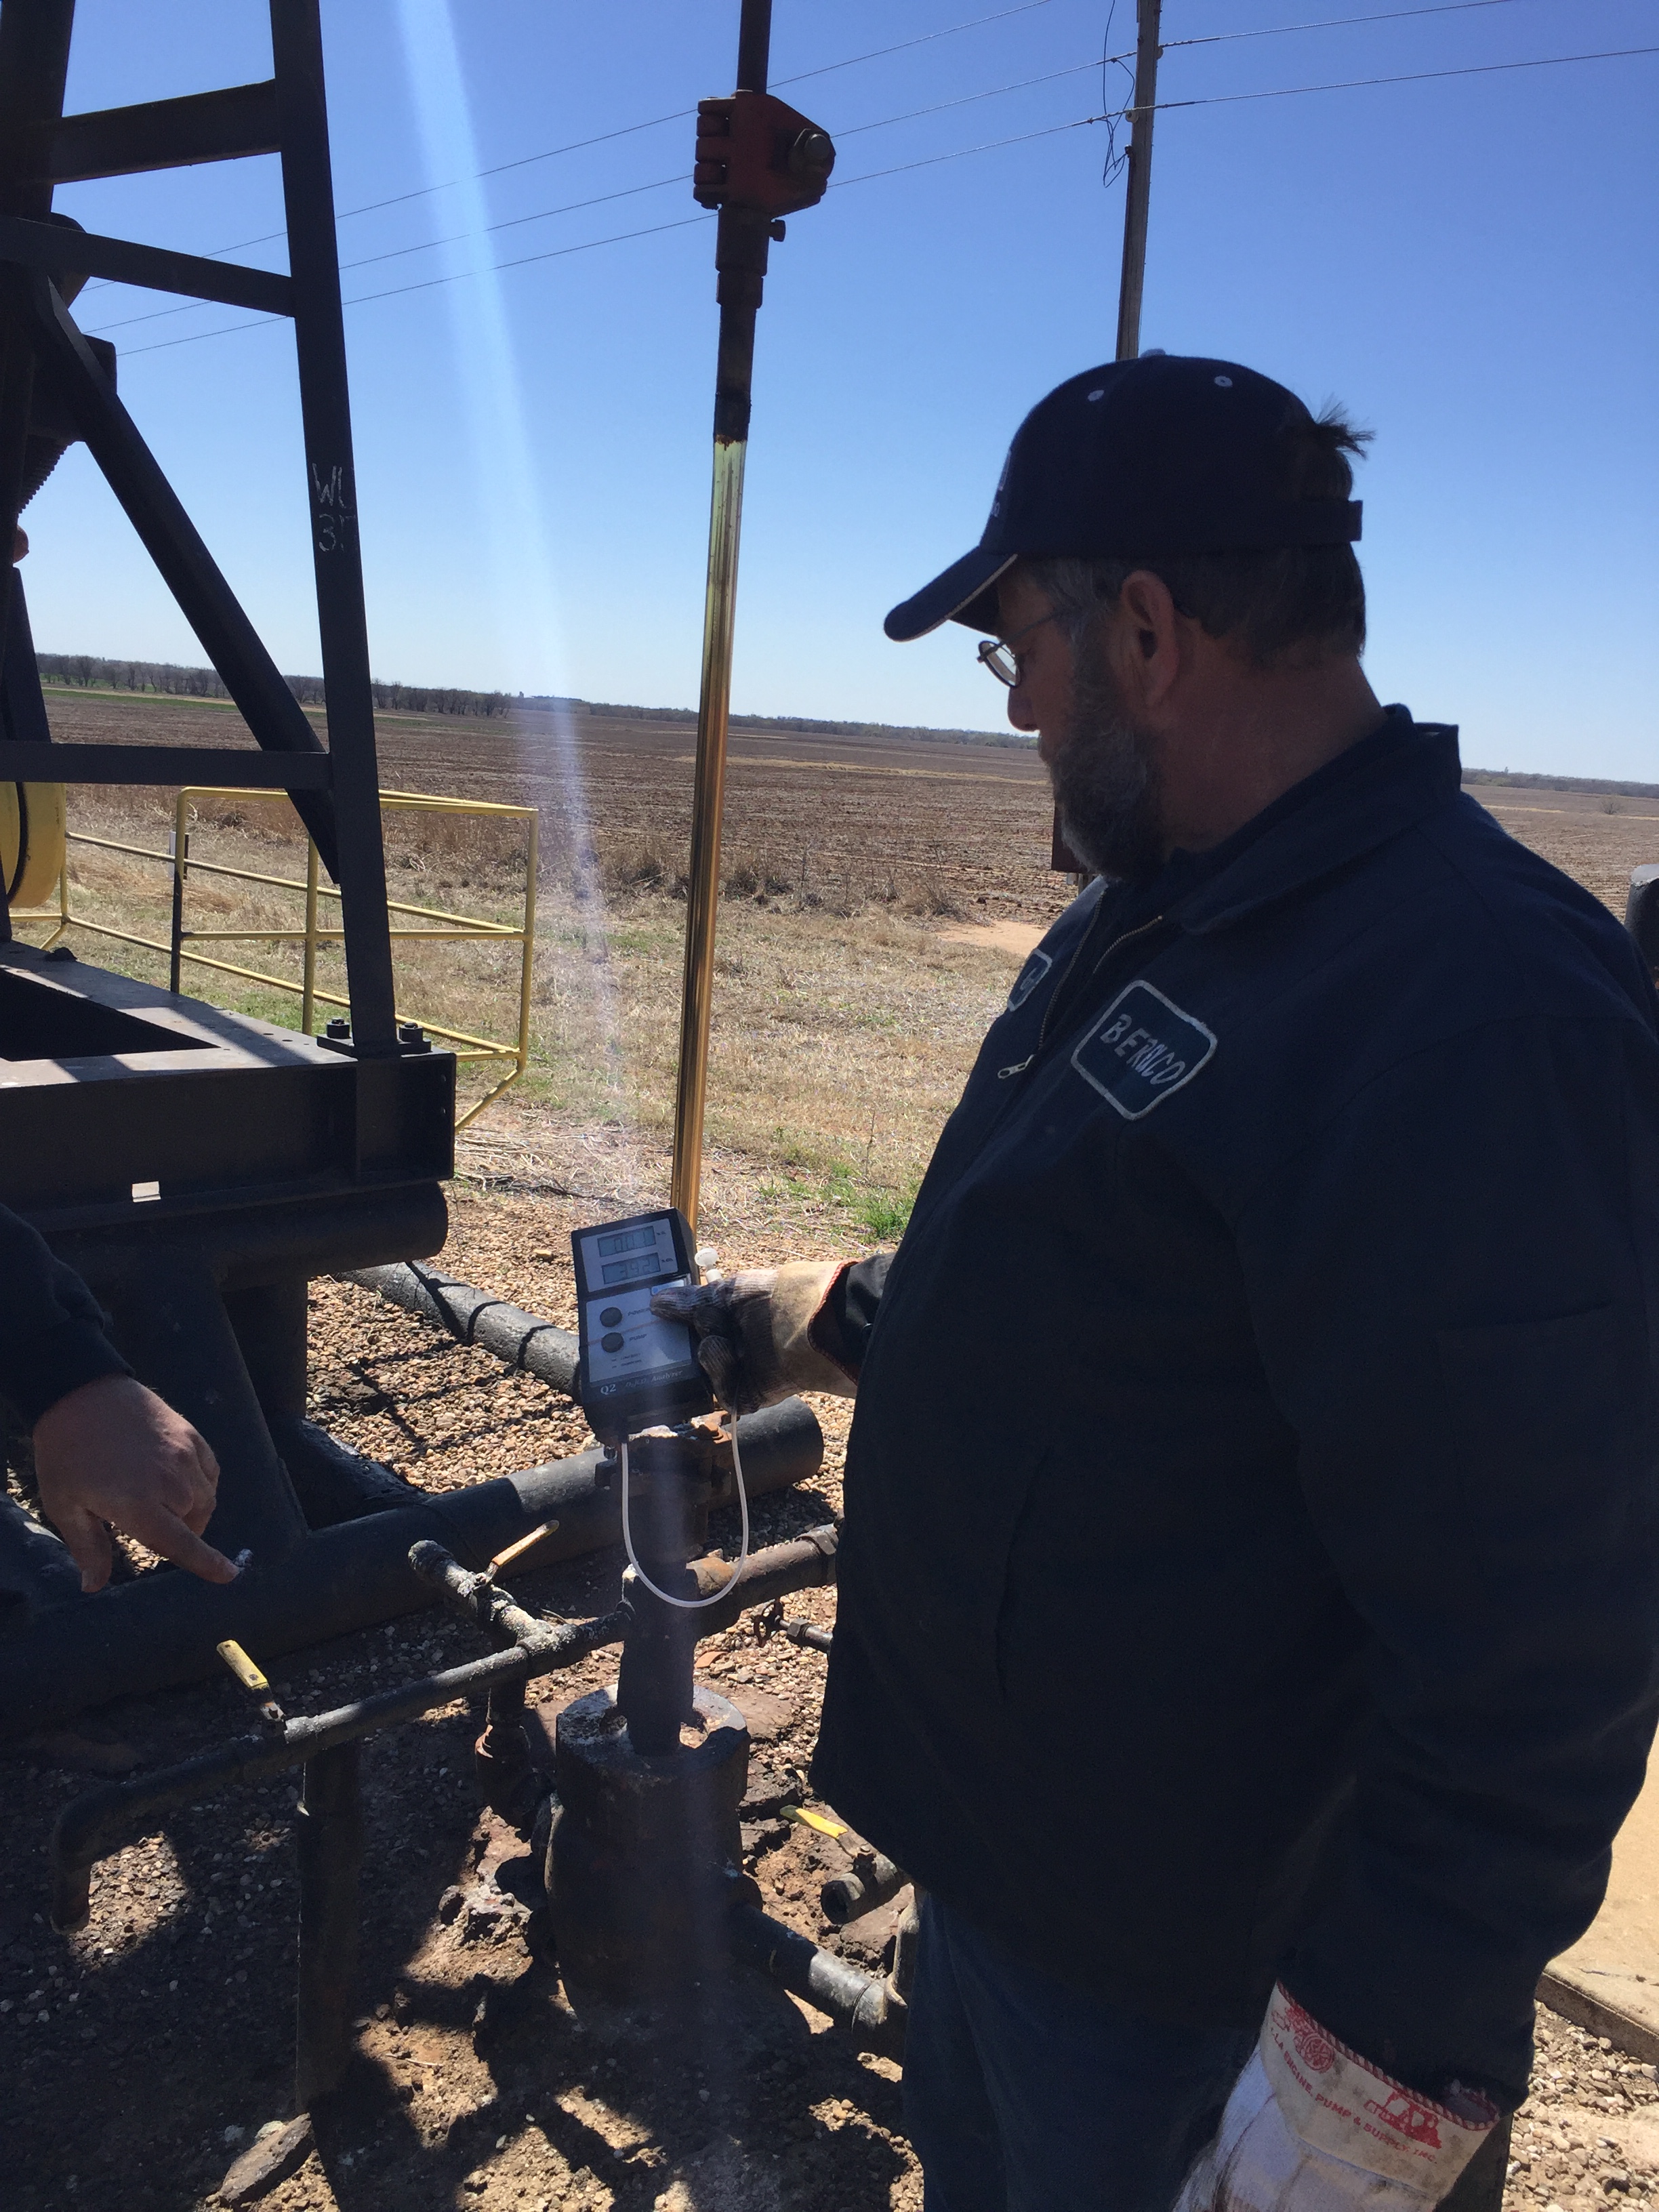
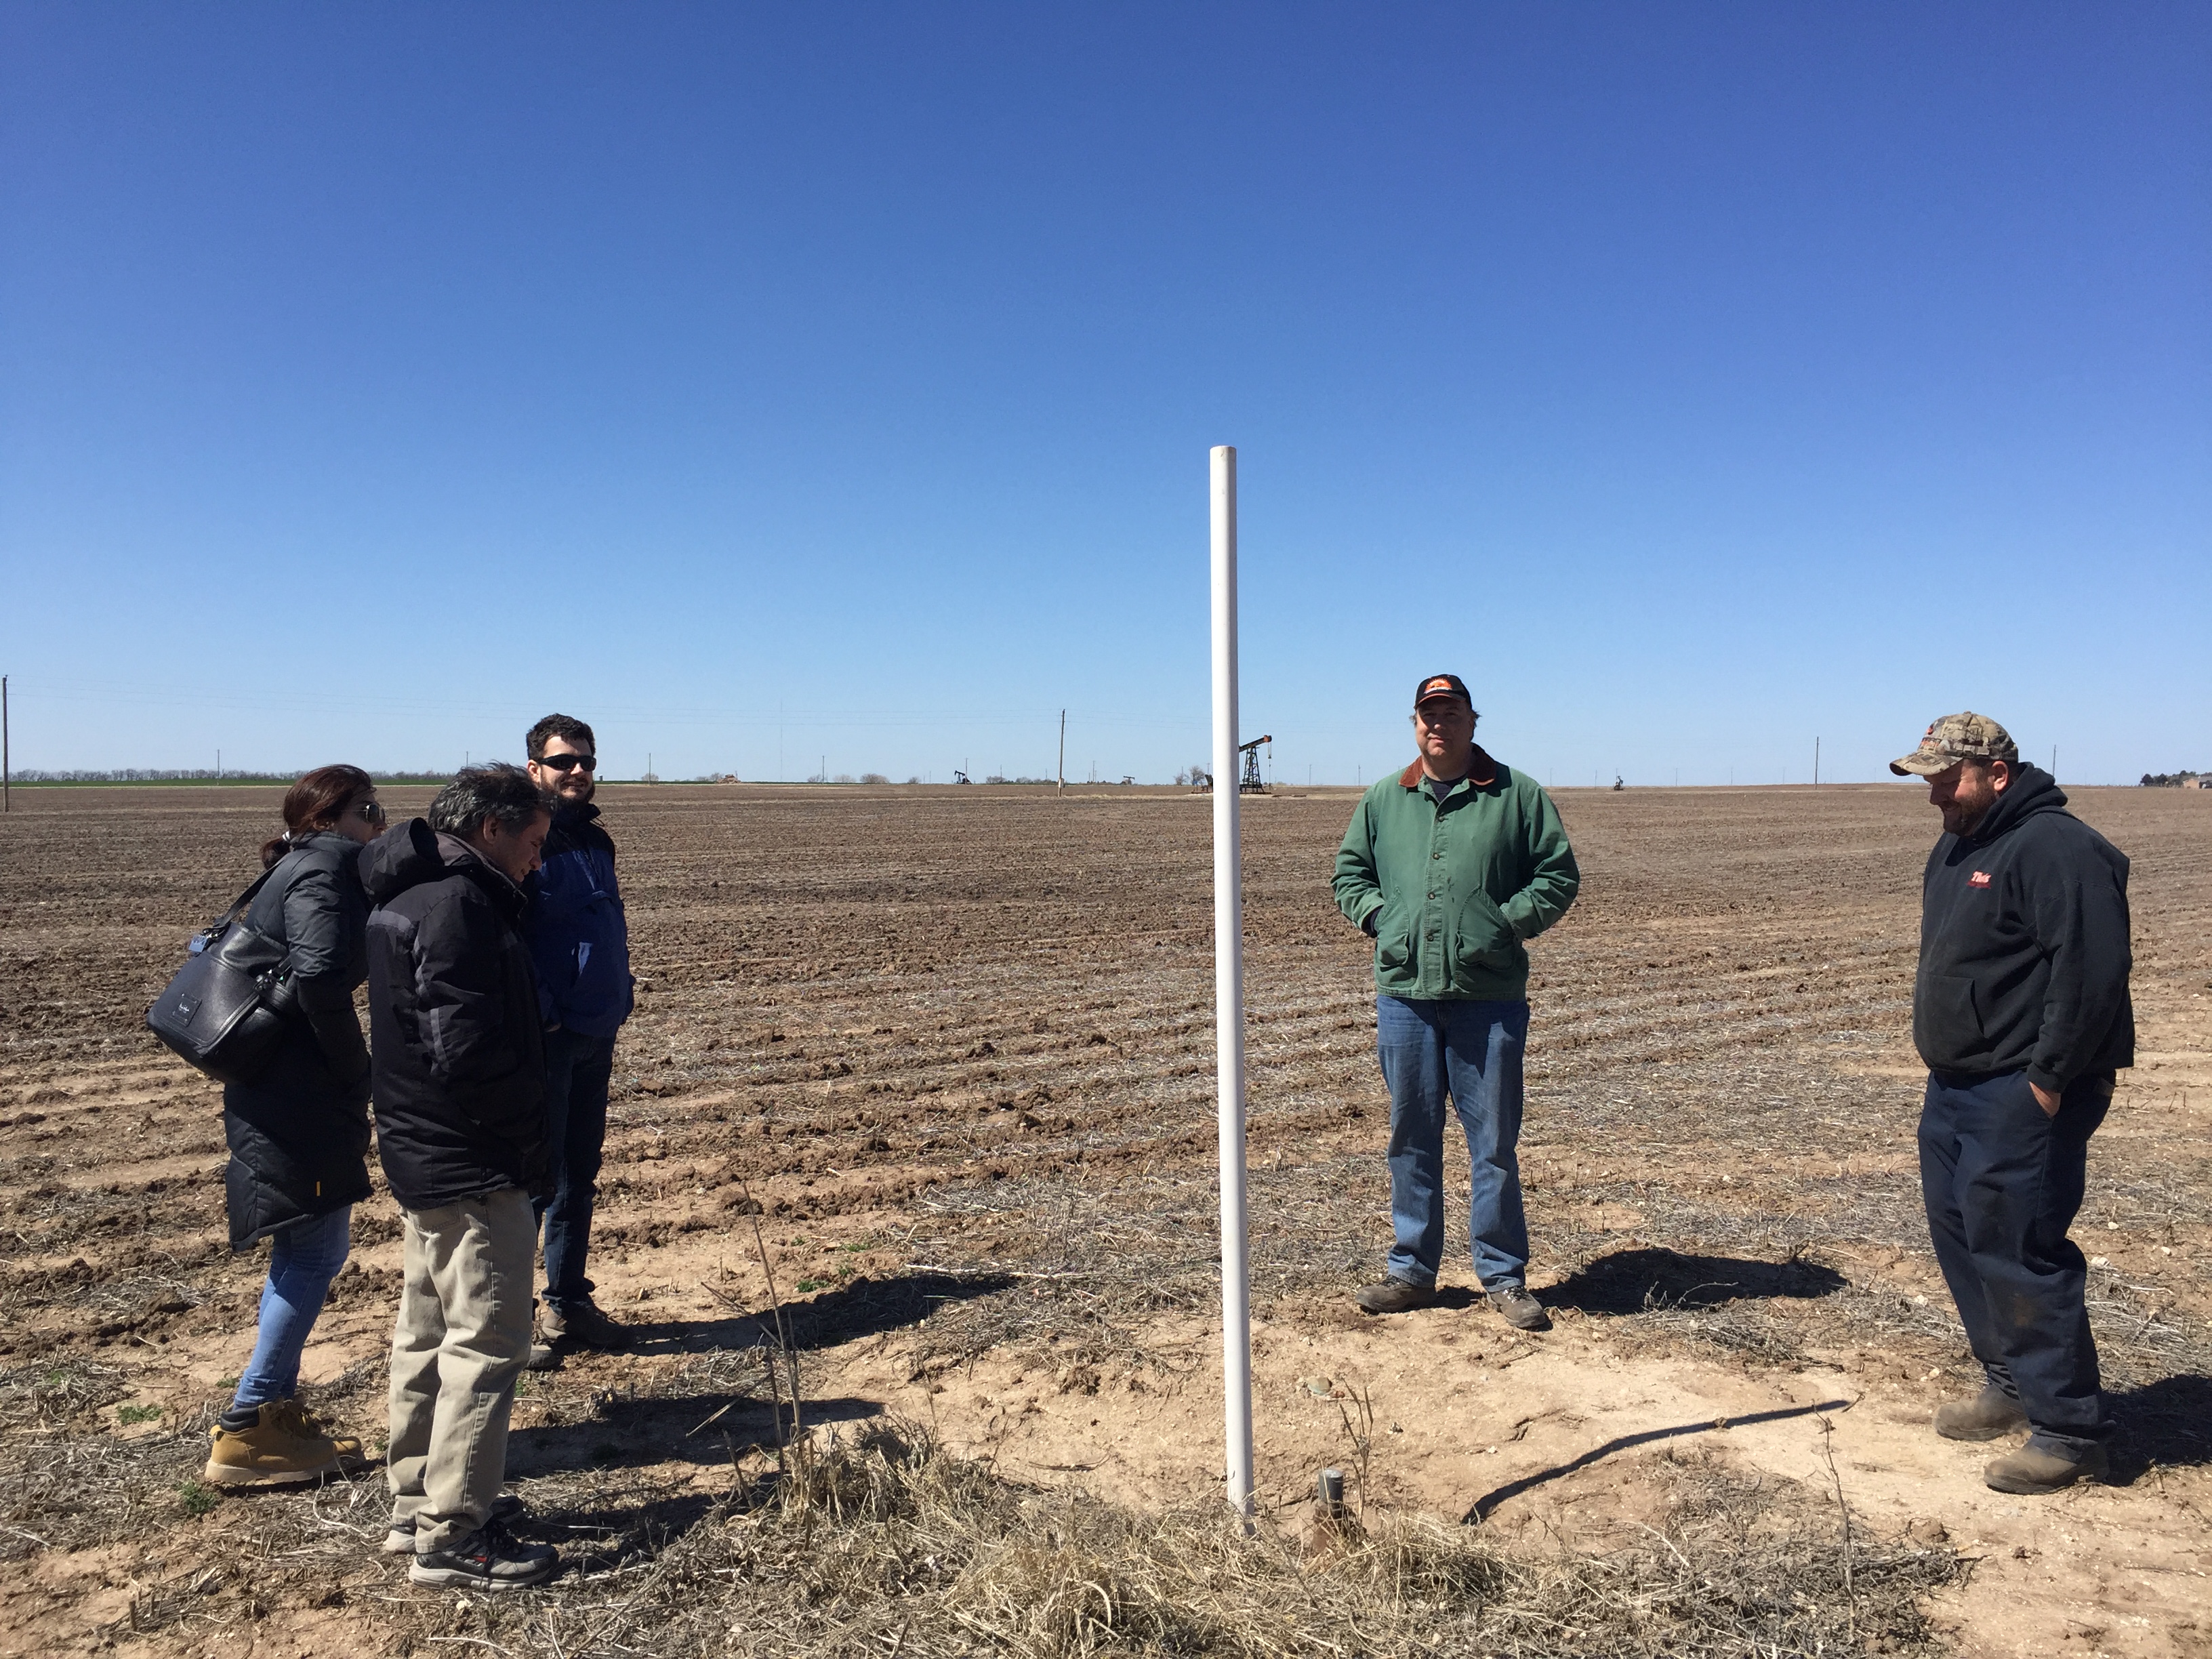
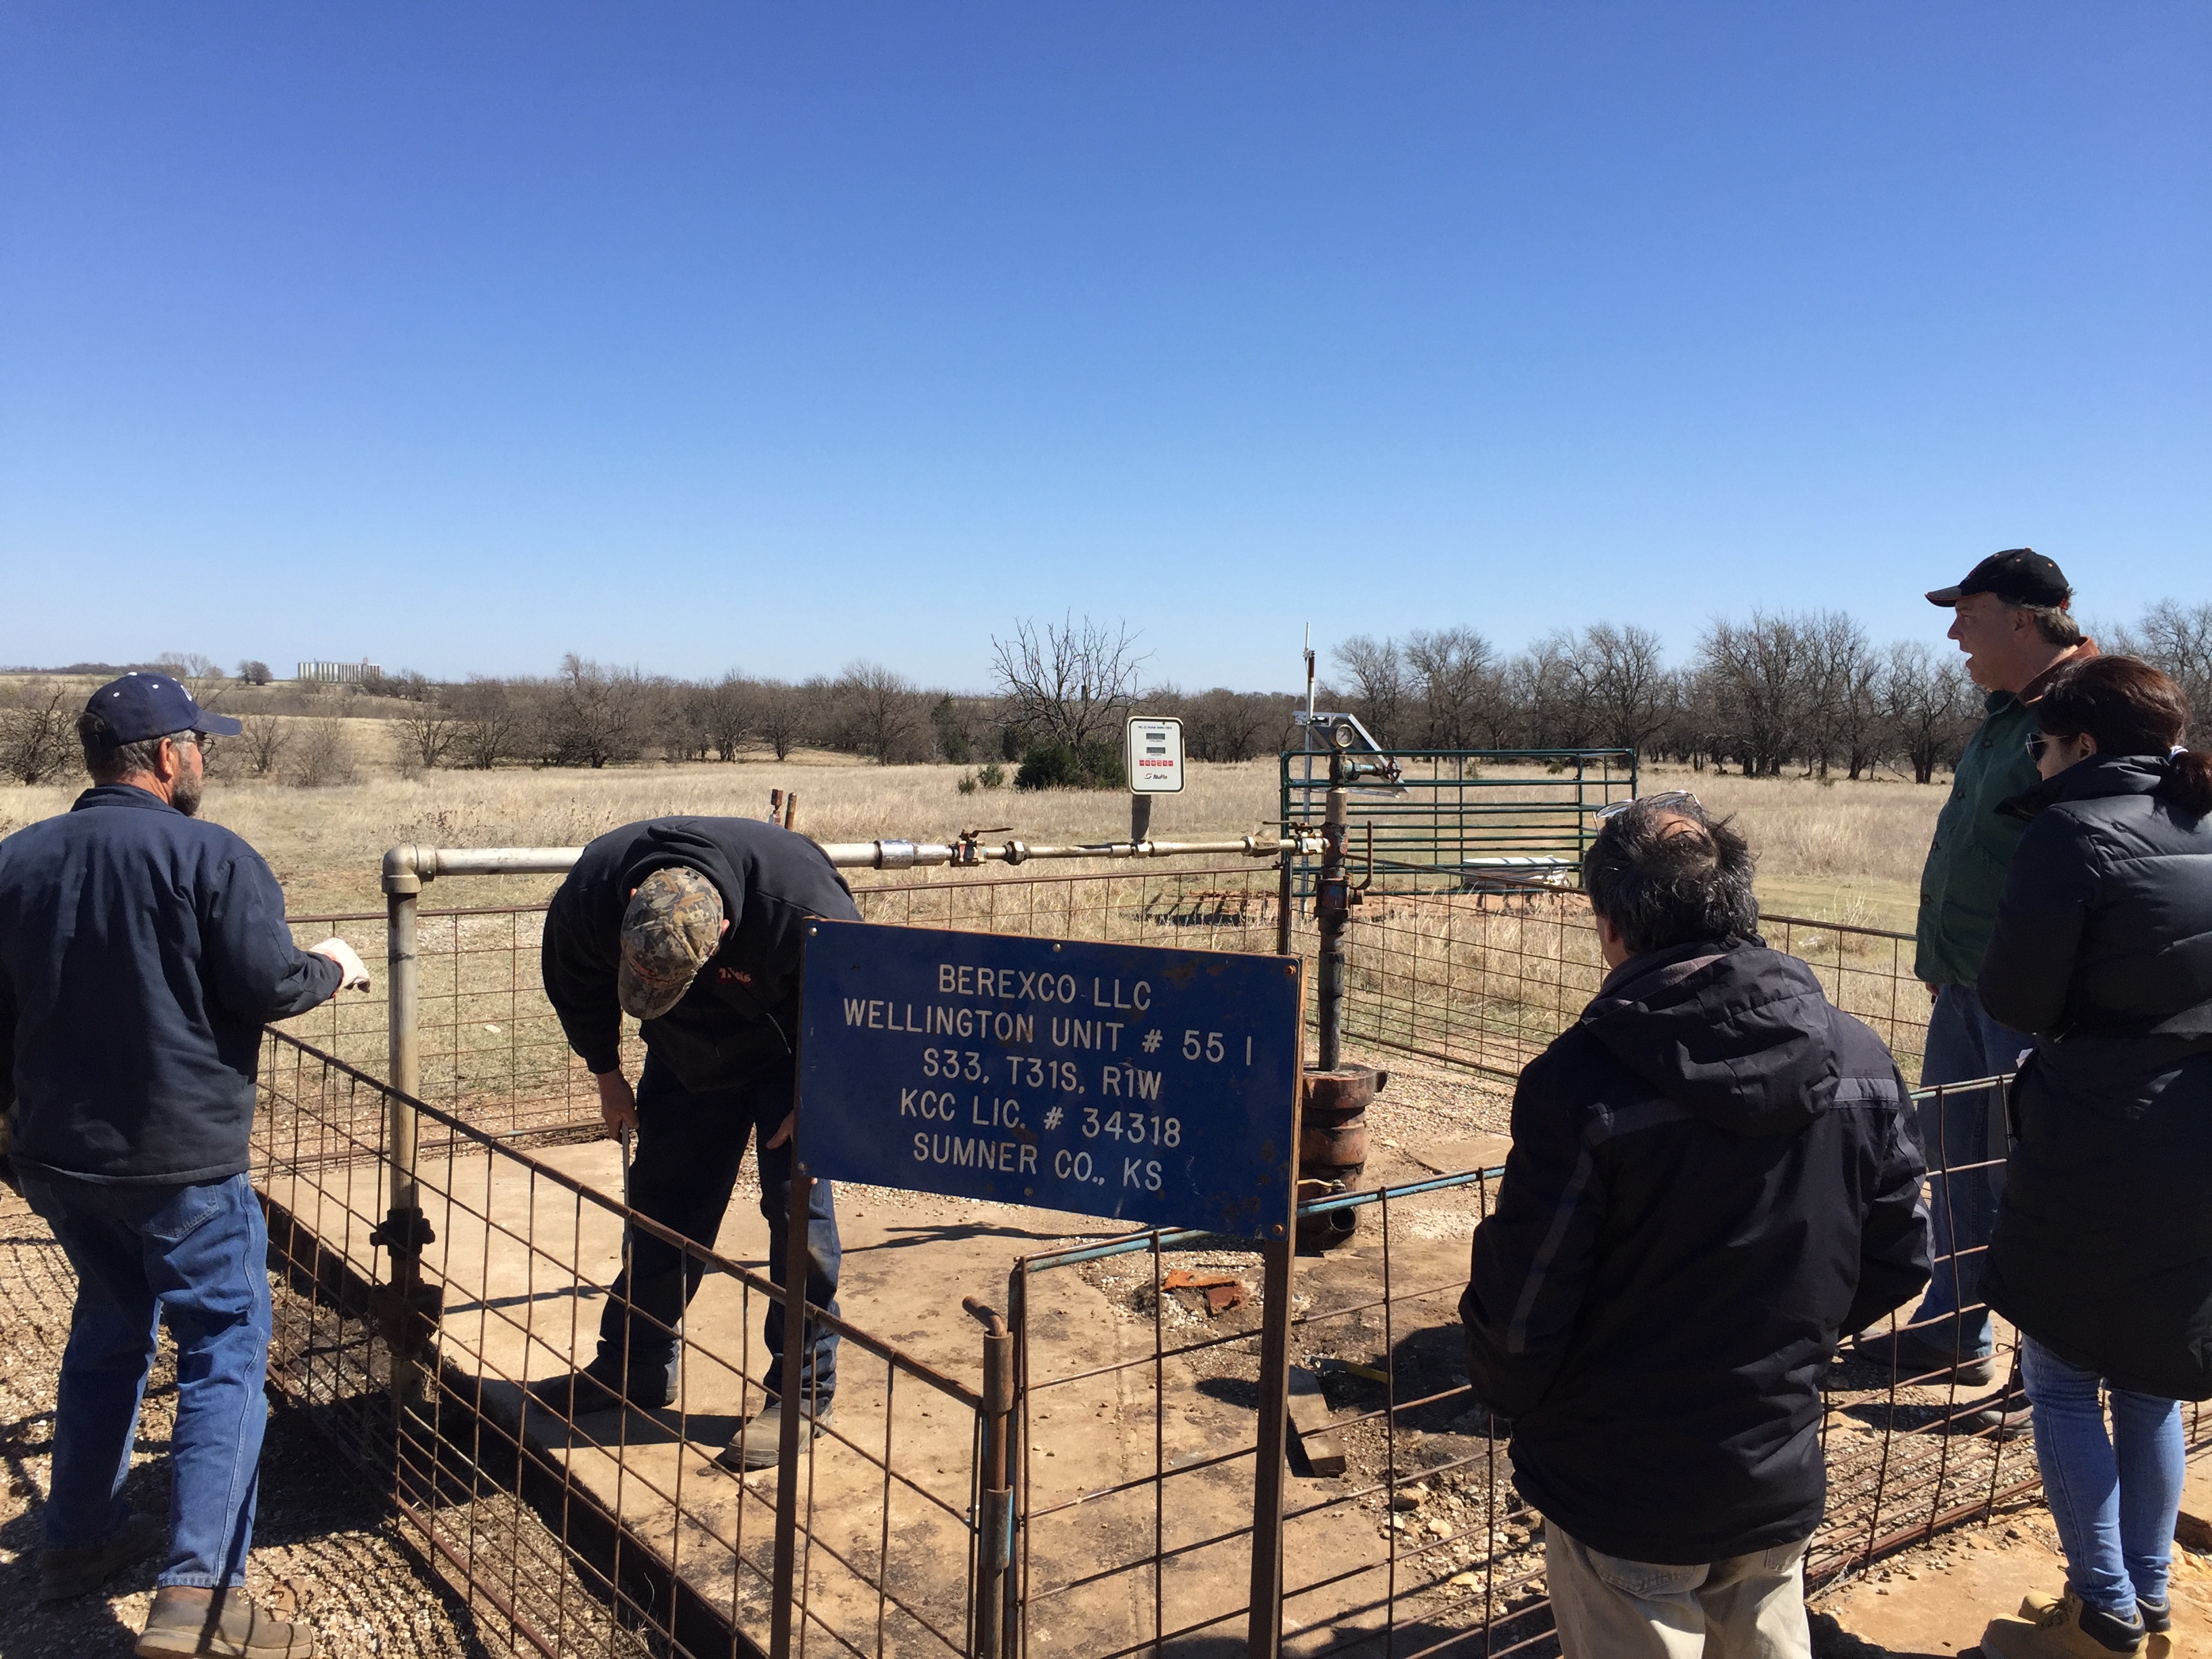
The crew views the CO2 monitoring gauge installed at Wellington Unit #61, along side the gas-phase separator that was installed to capture any produced CO2.

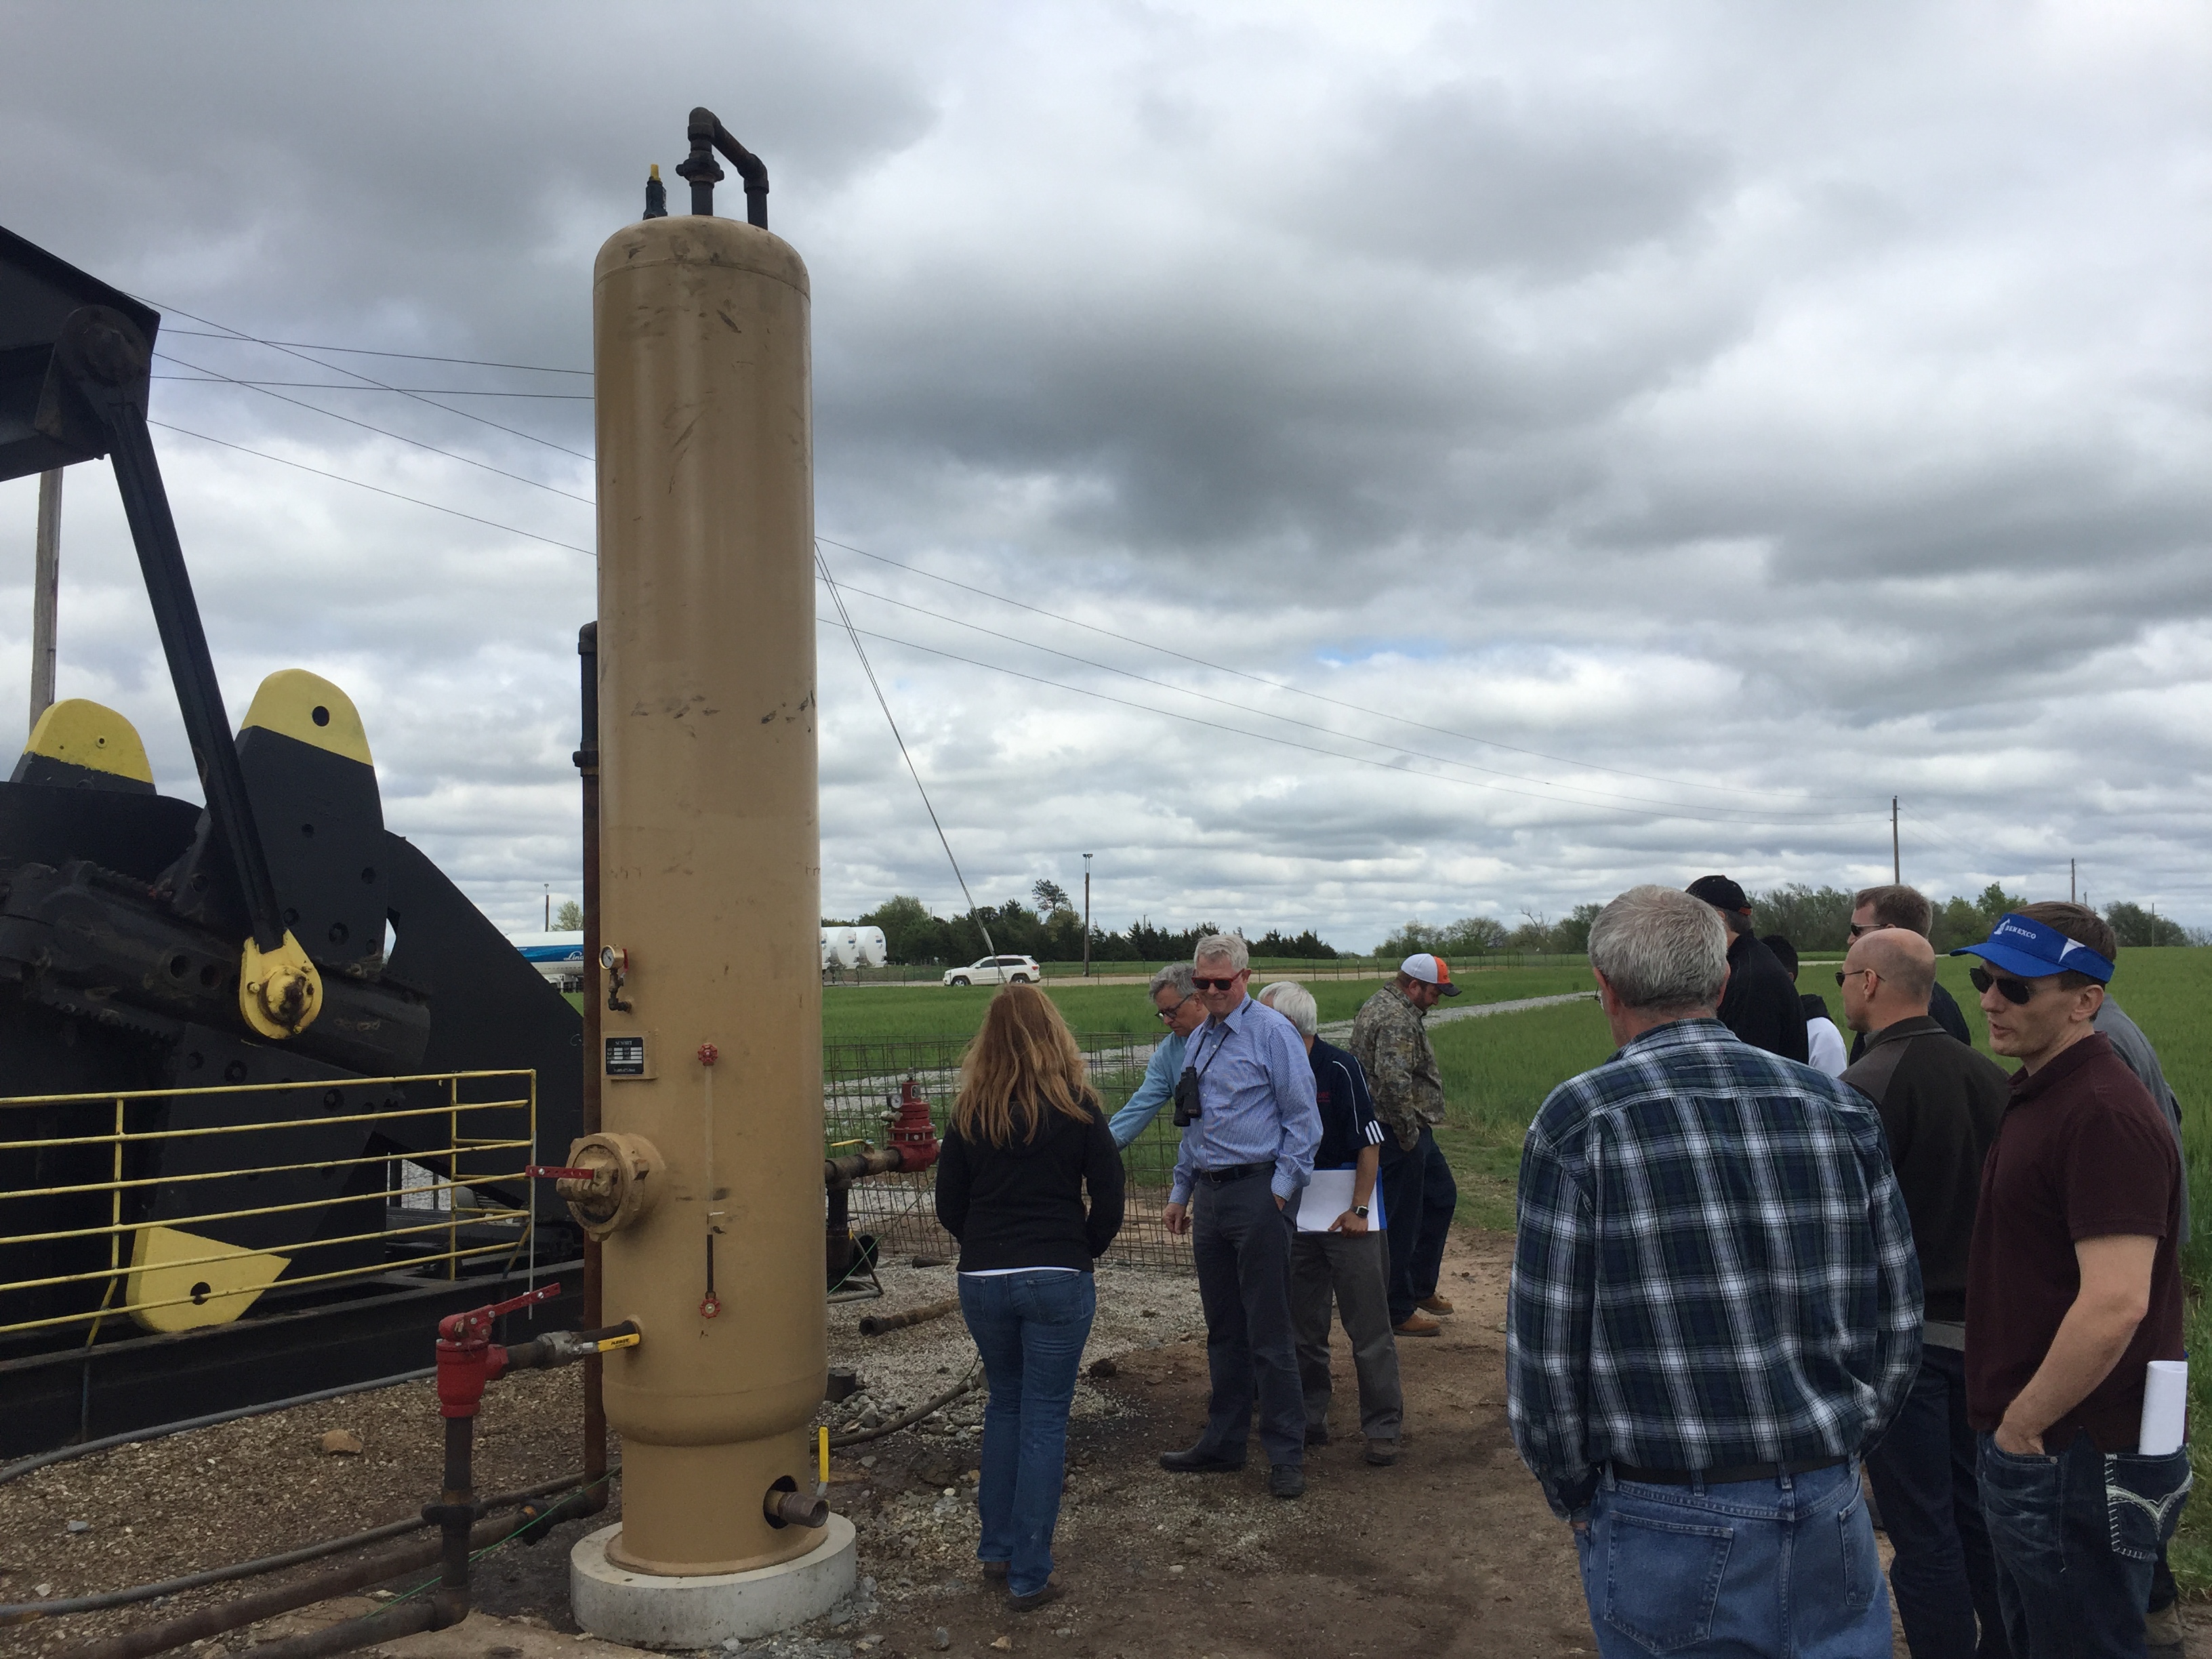
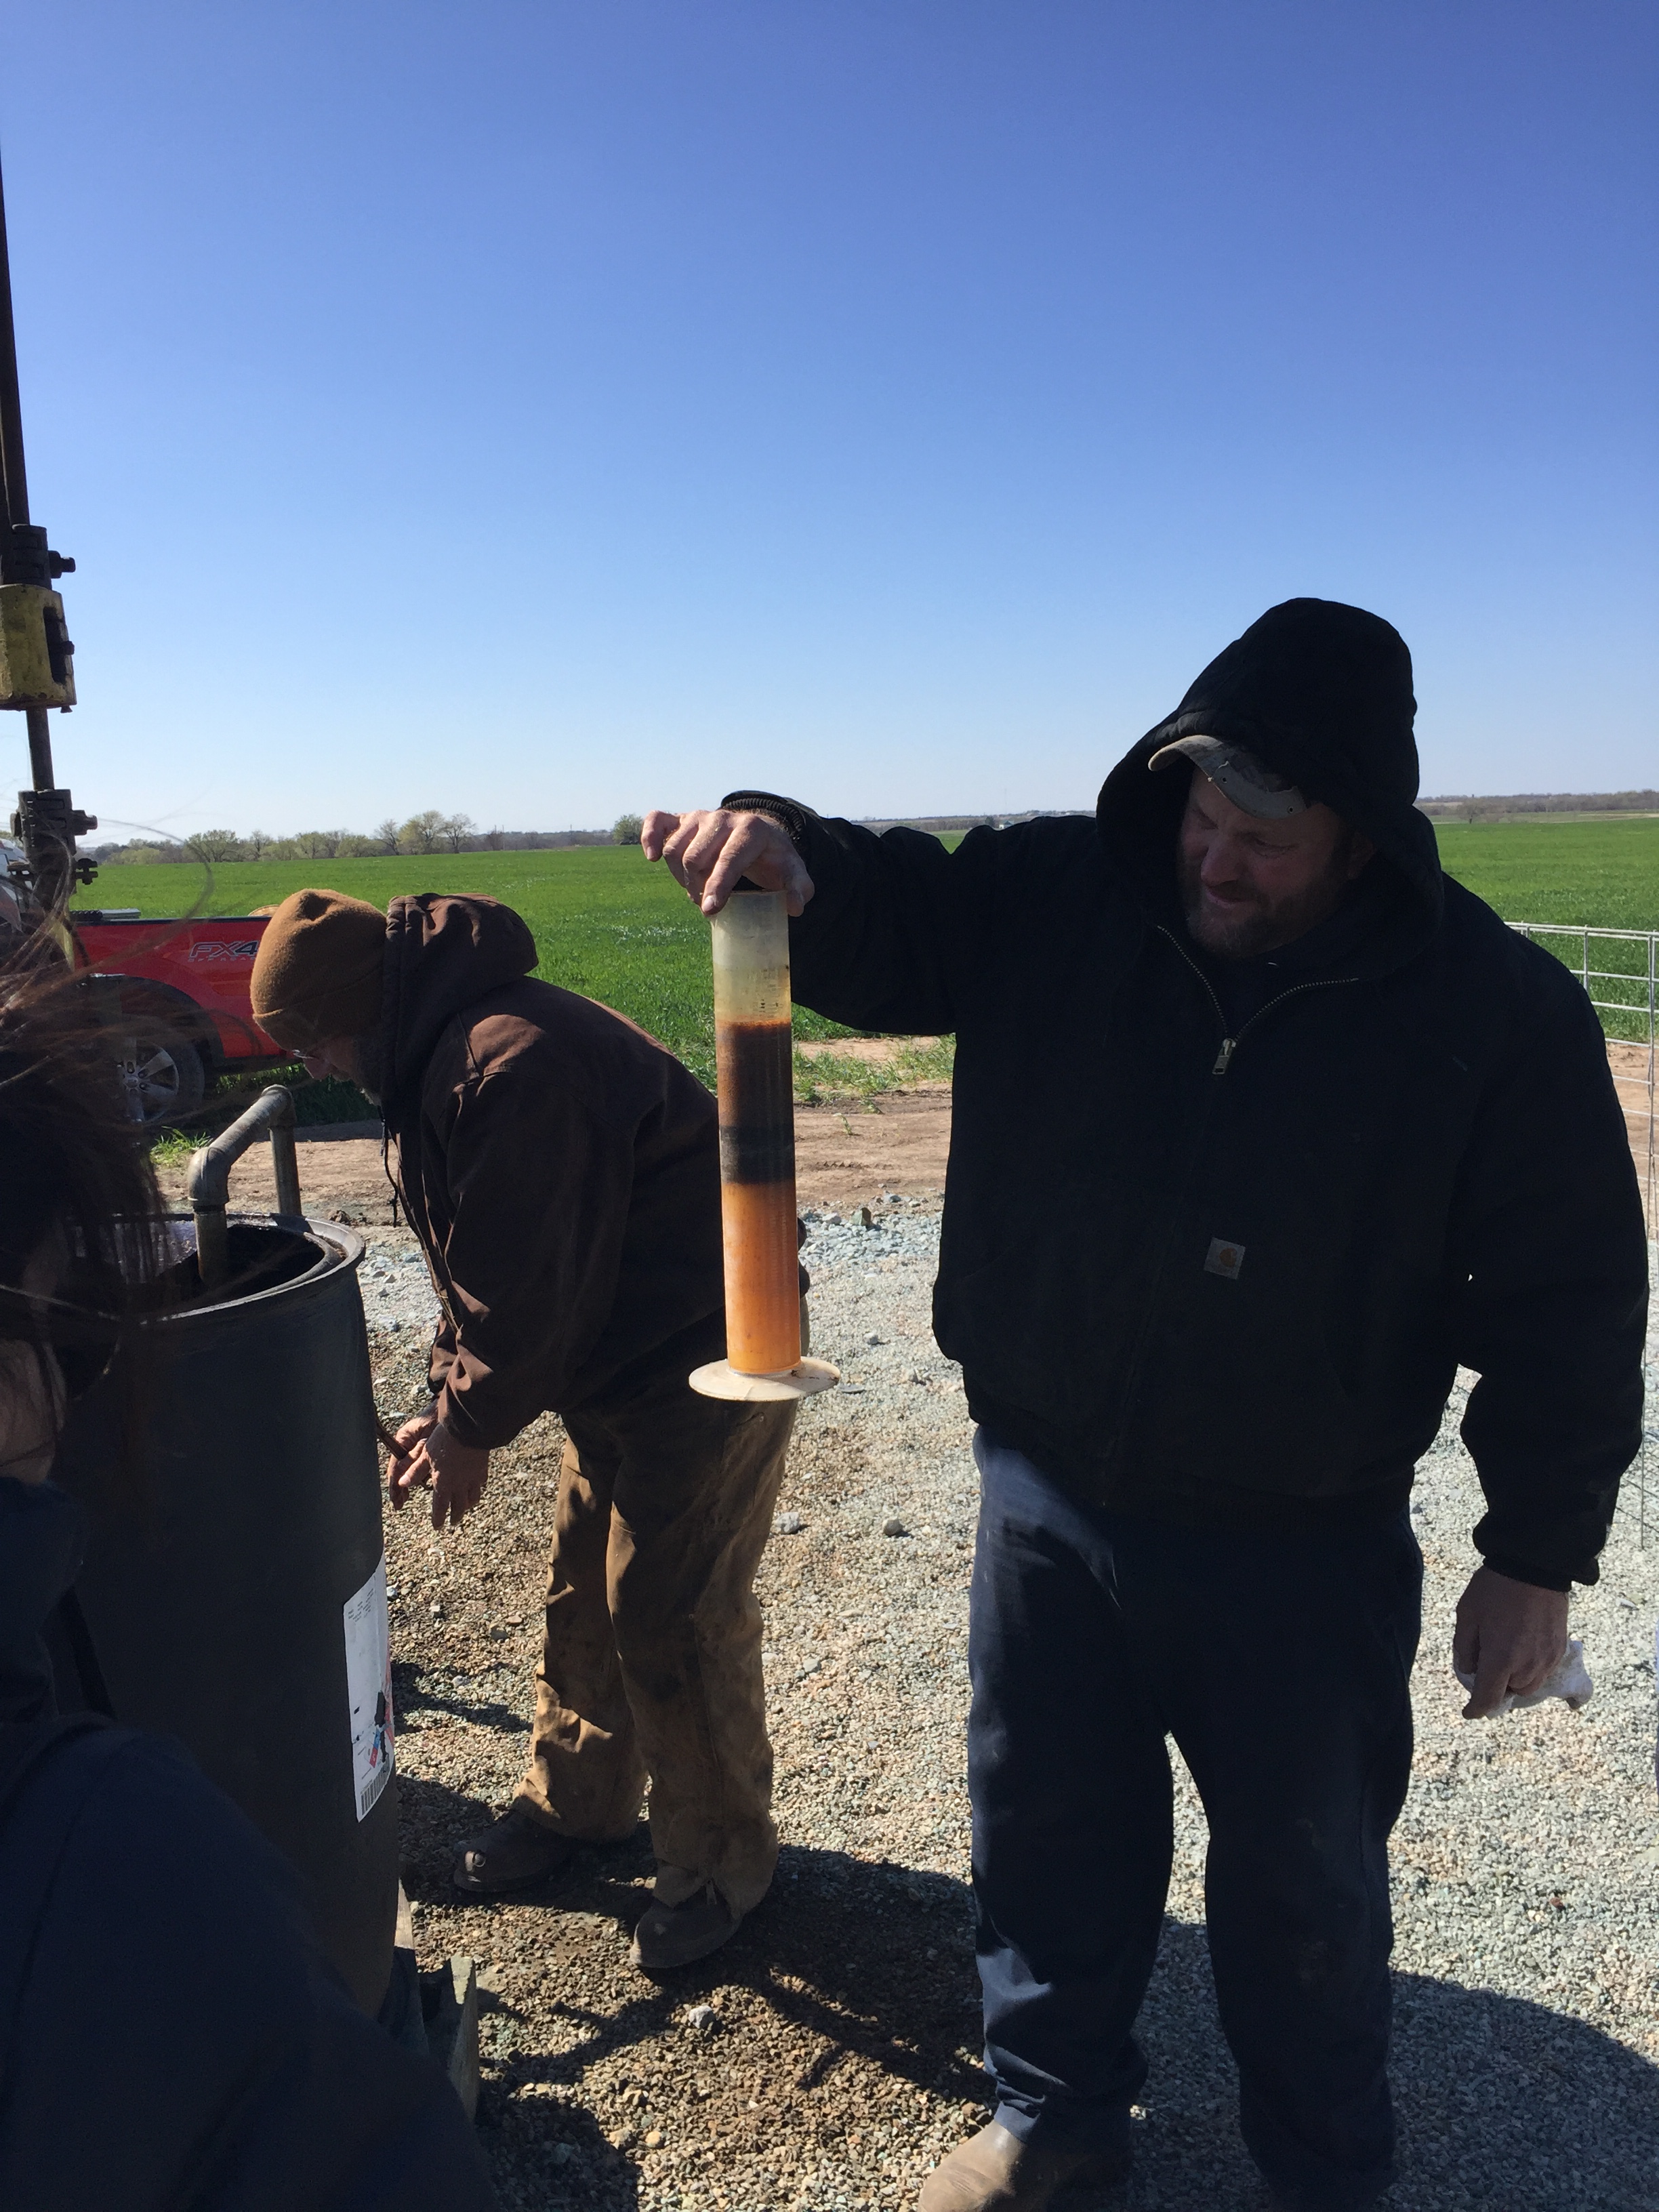
Dana Wreath and Jason Bruns explain how total produced fluid is estimated from Wellington Unit #61. Note the appearance of the produced fluids entering the barrel that is used to conduct the on-site tests.

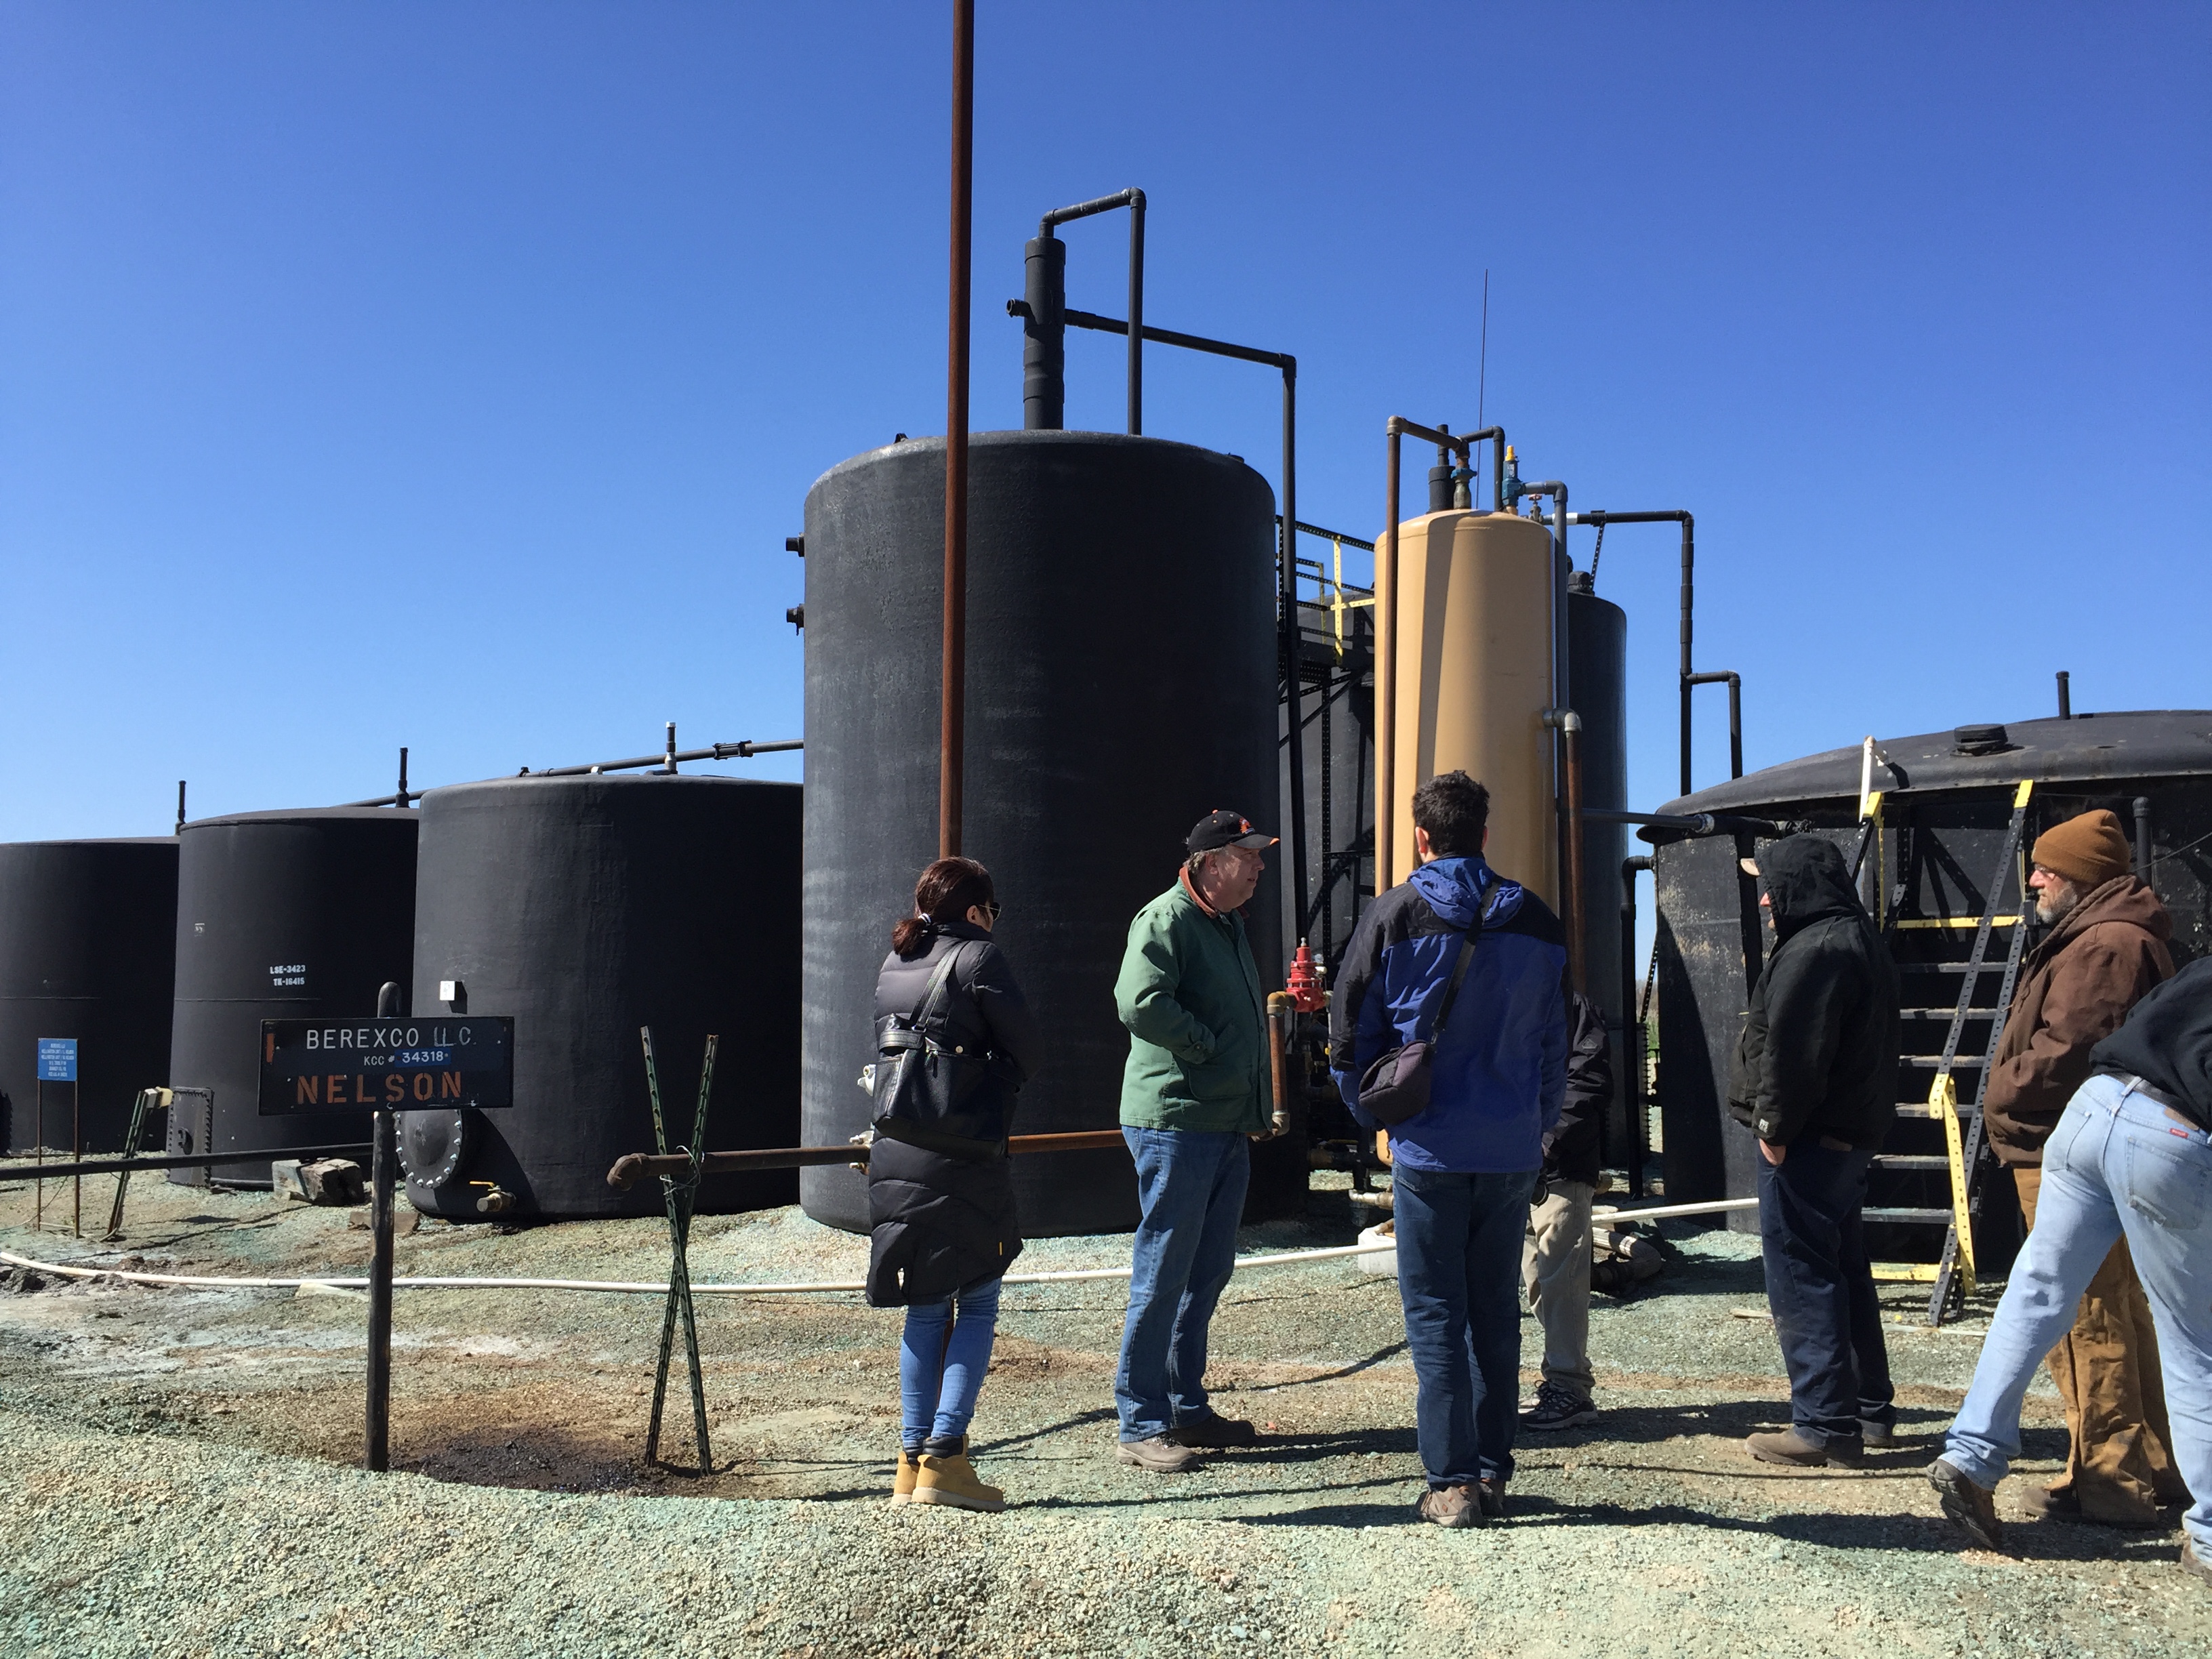
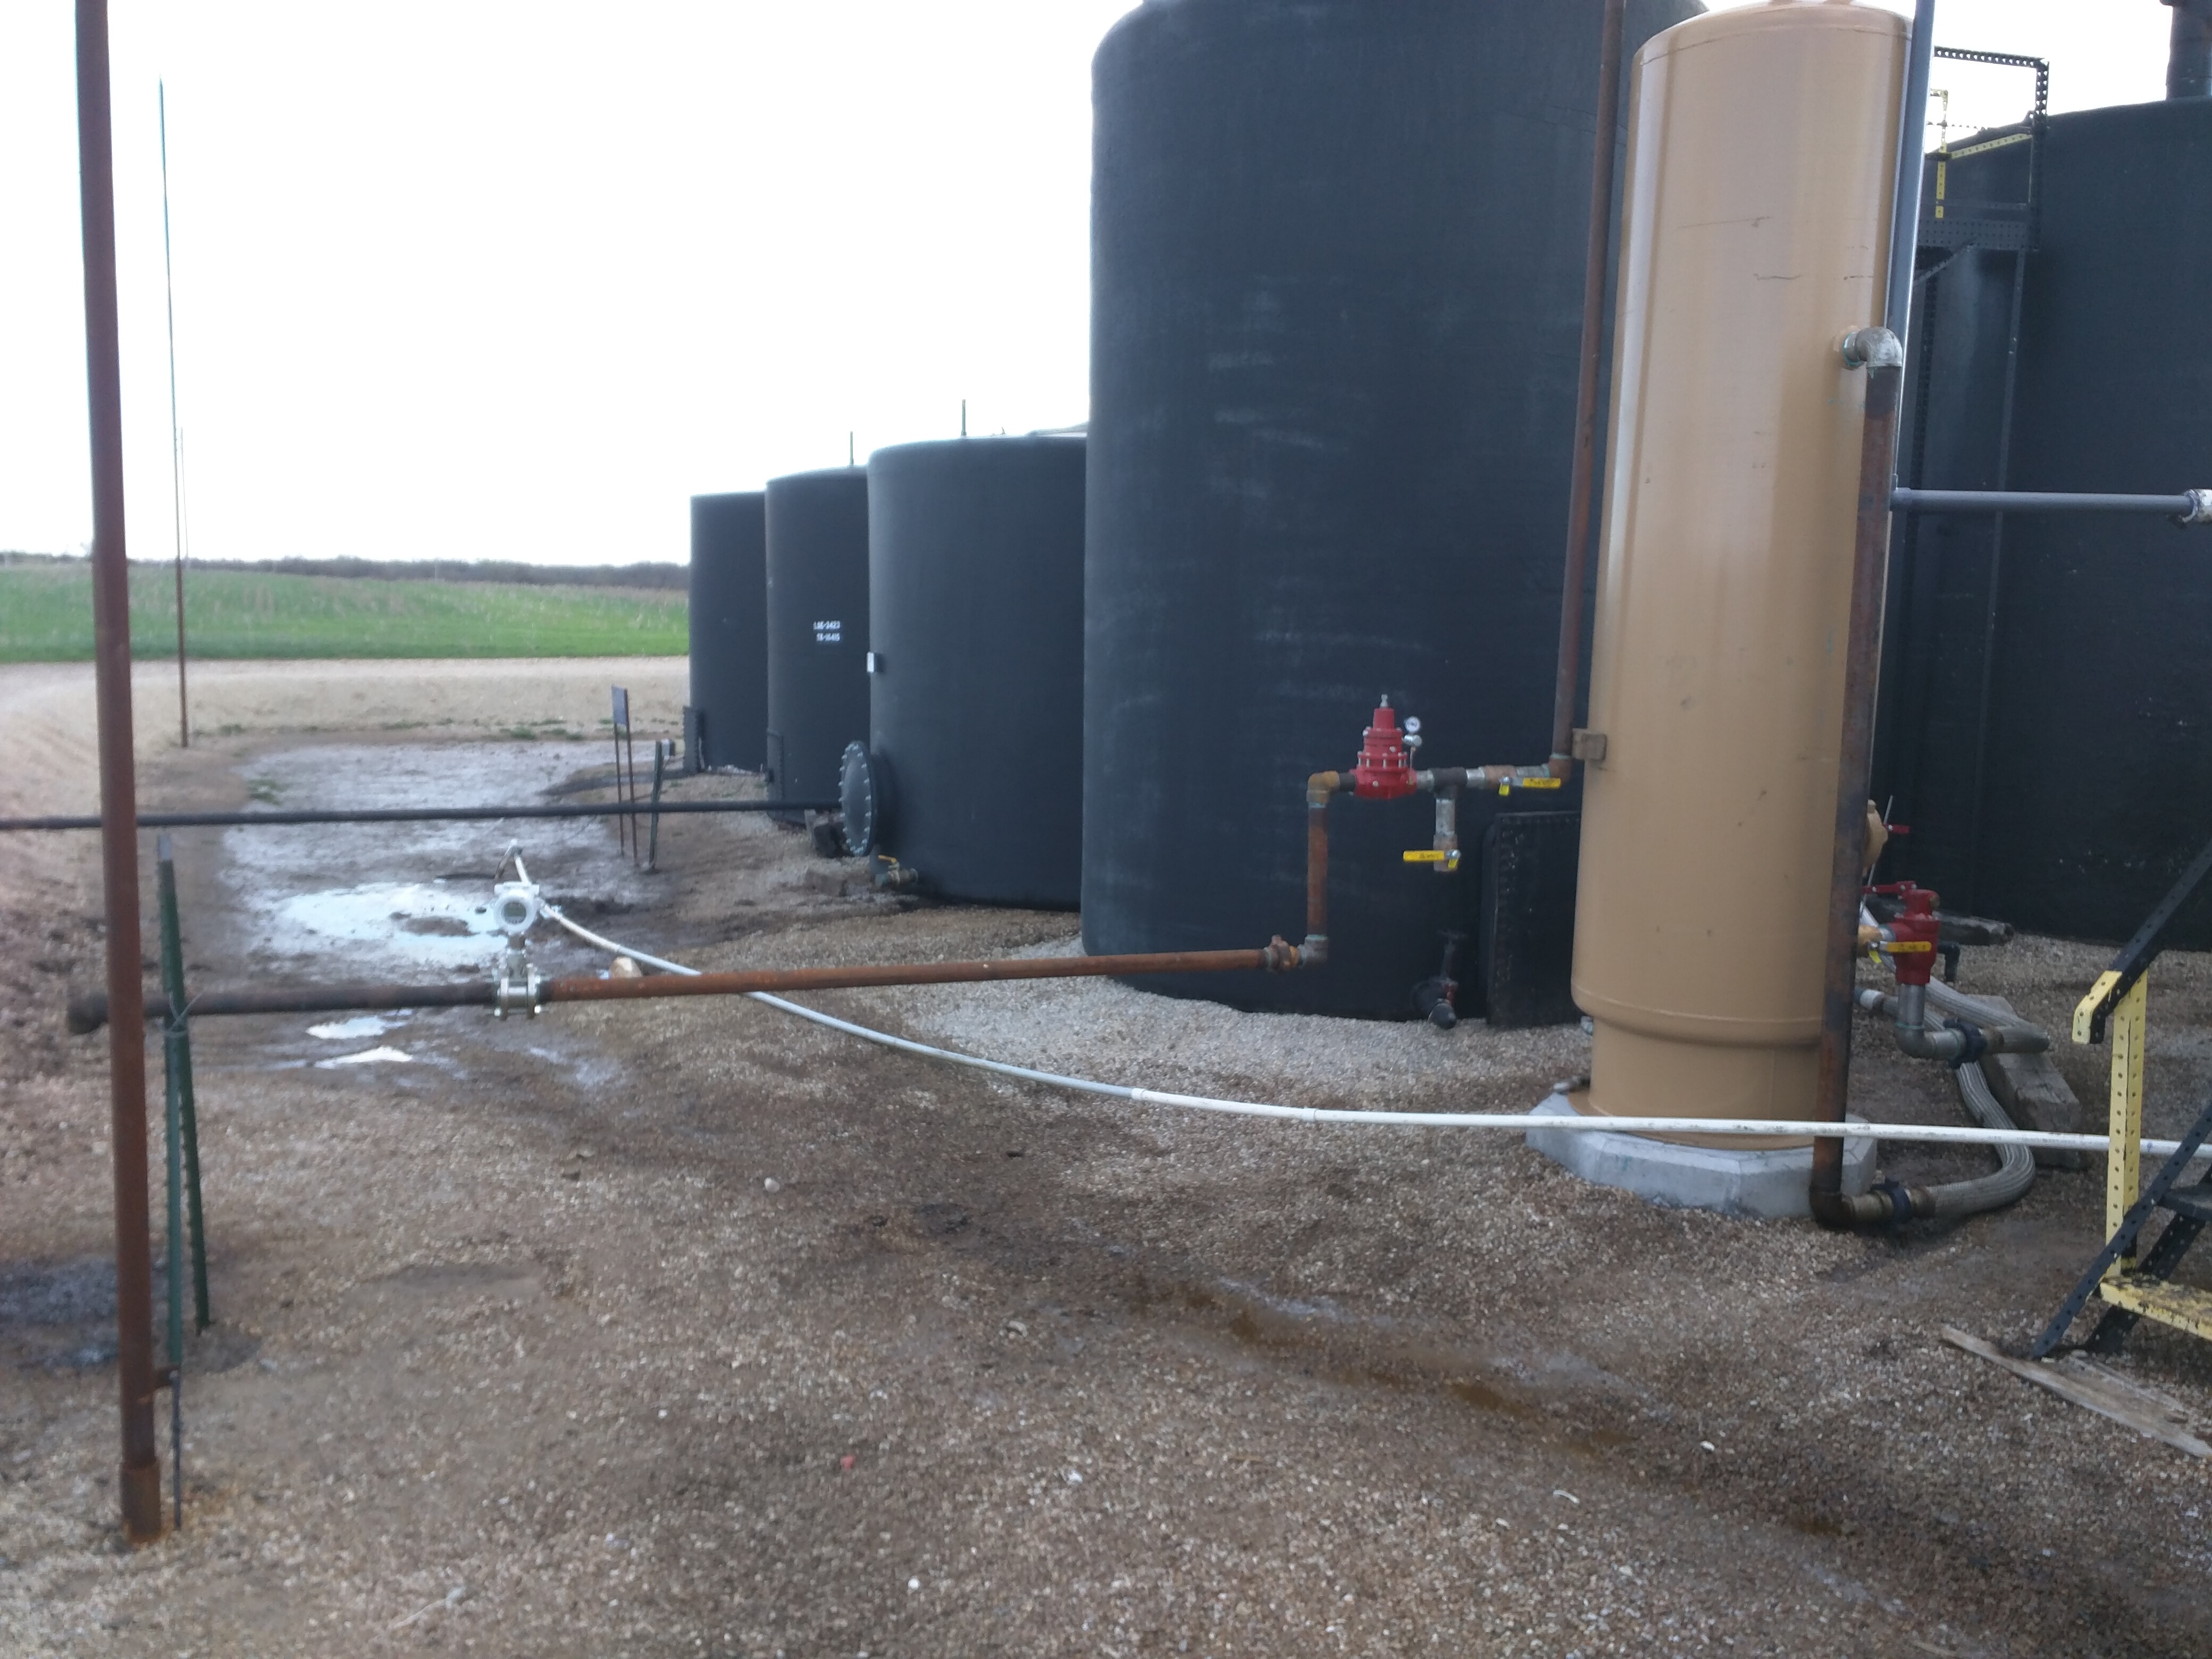
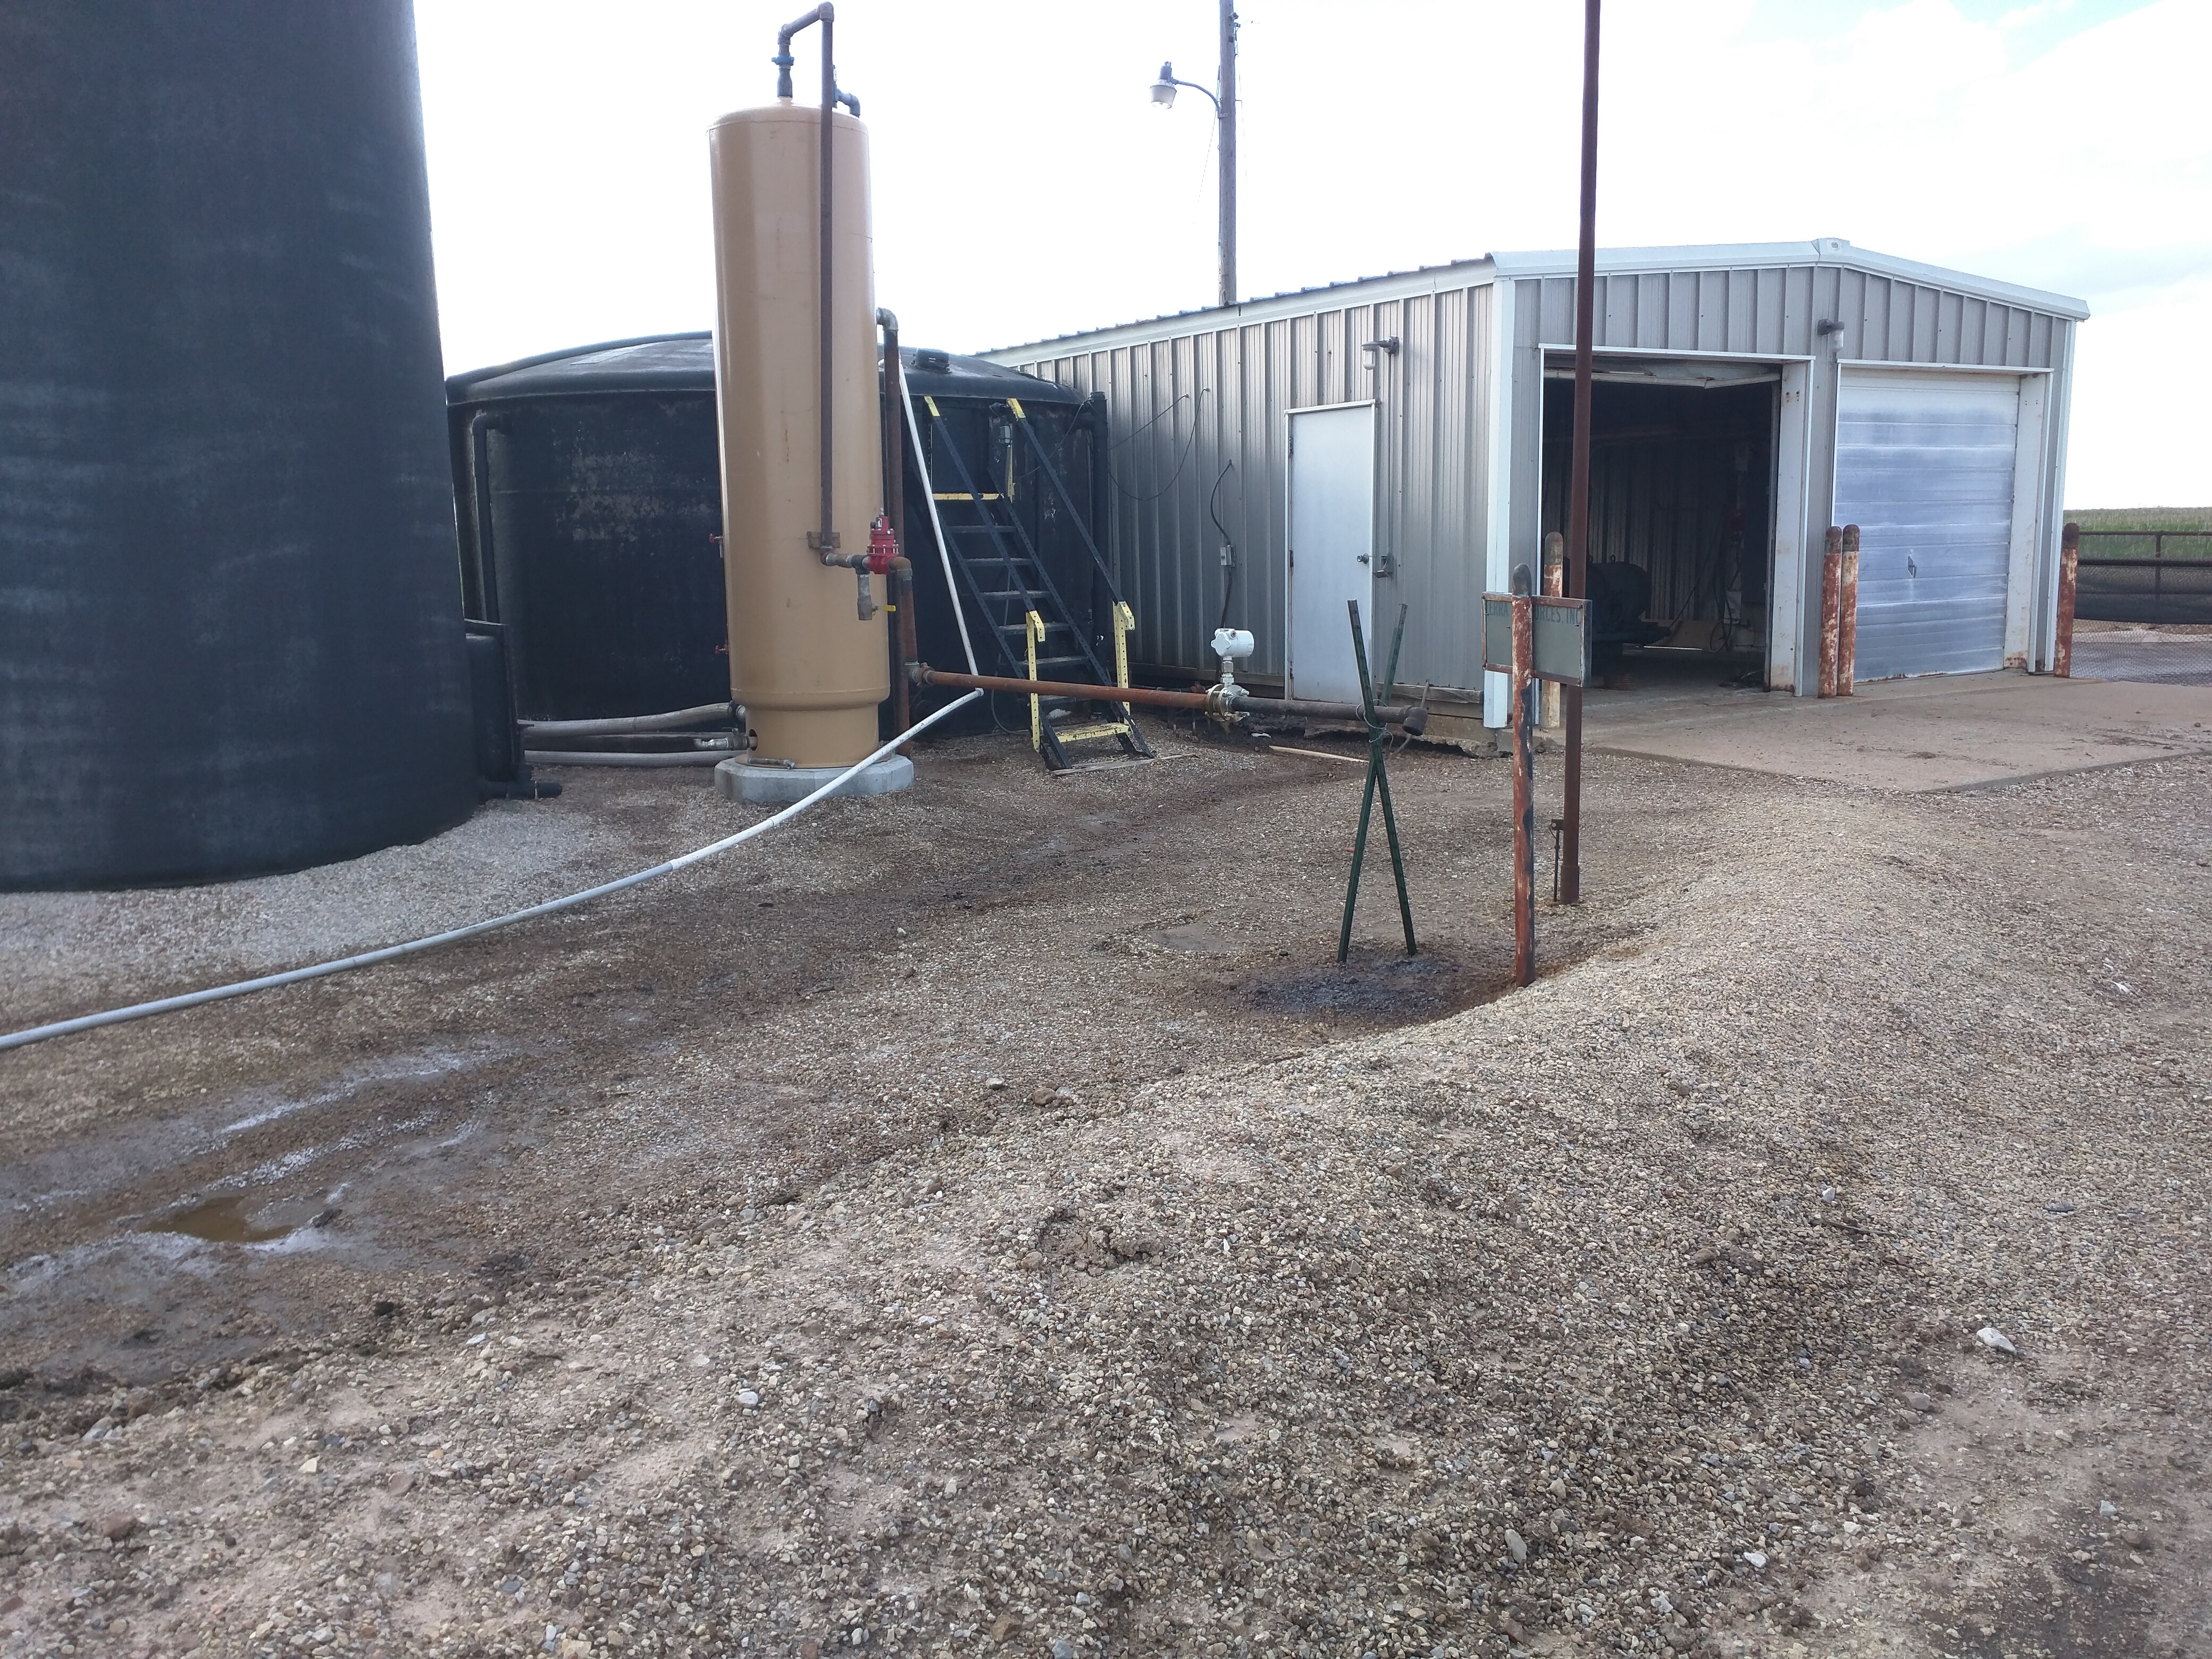
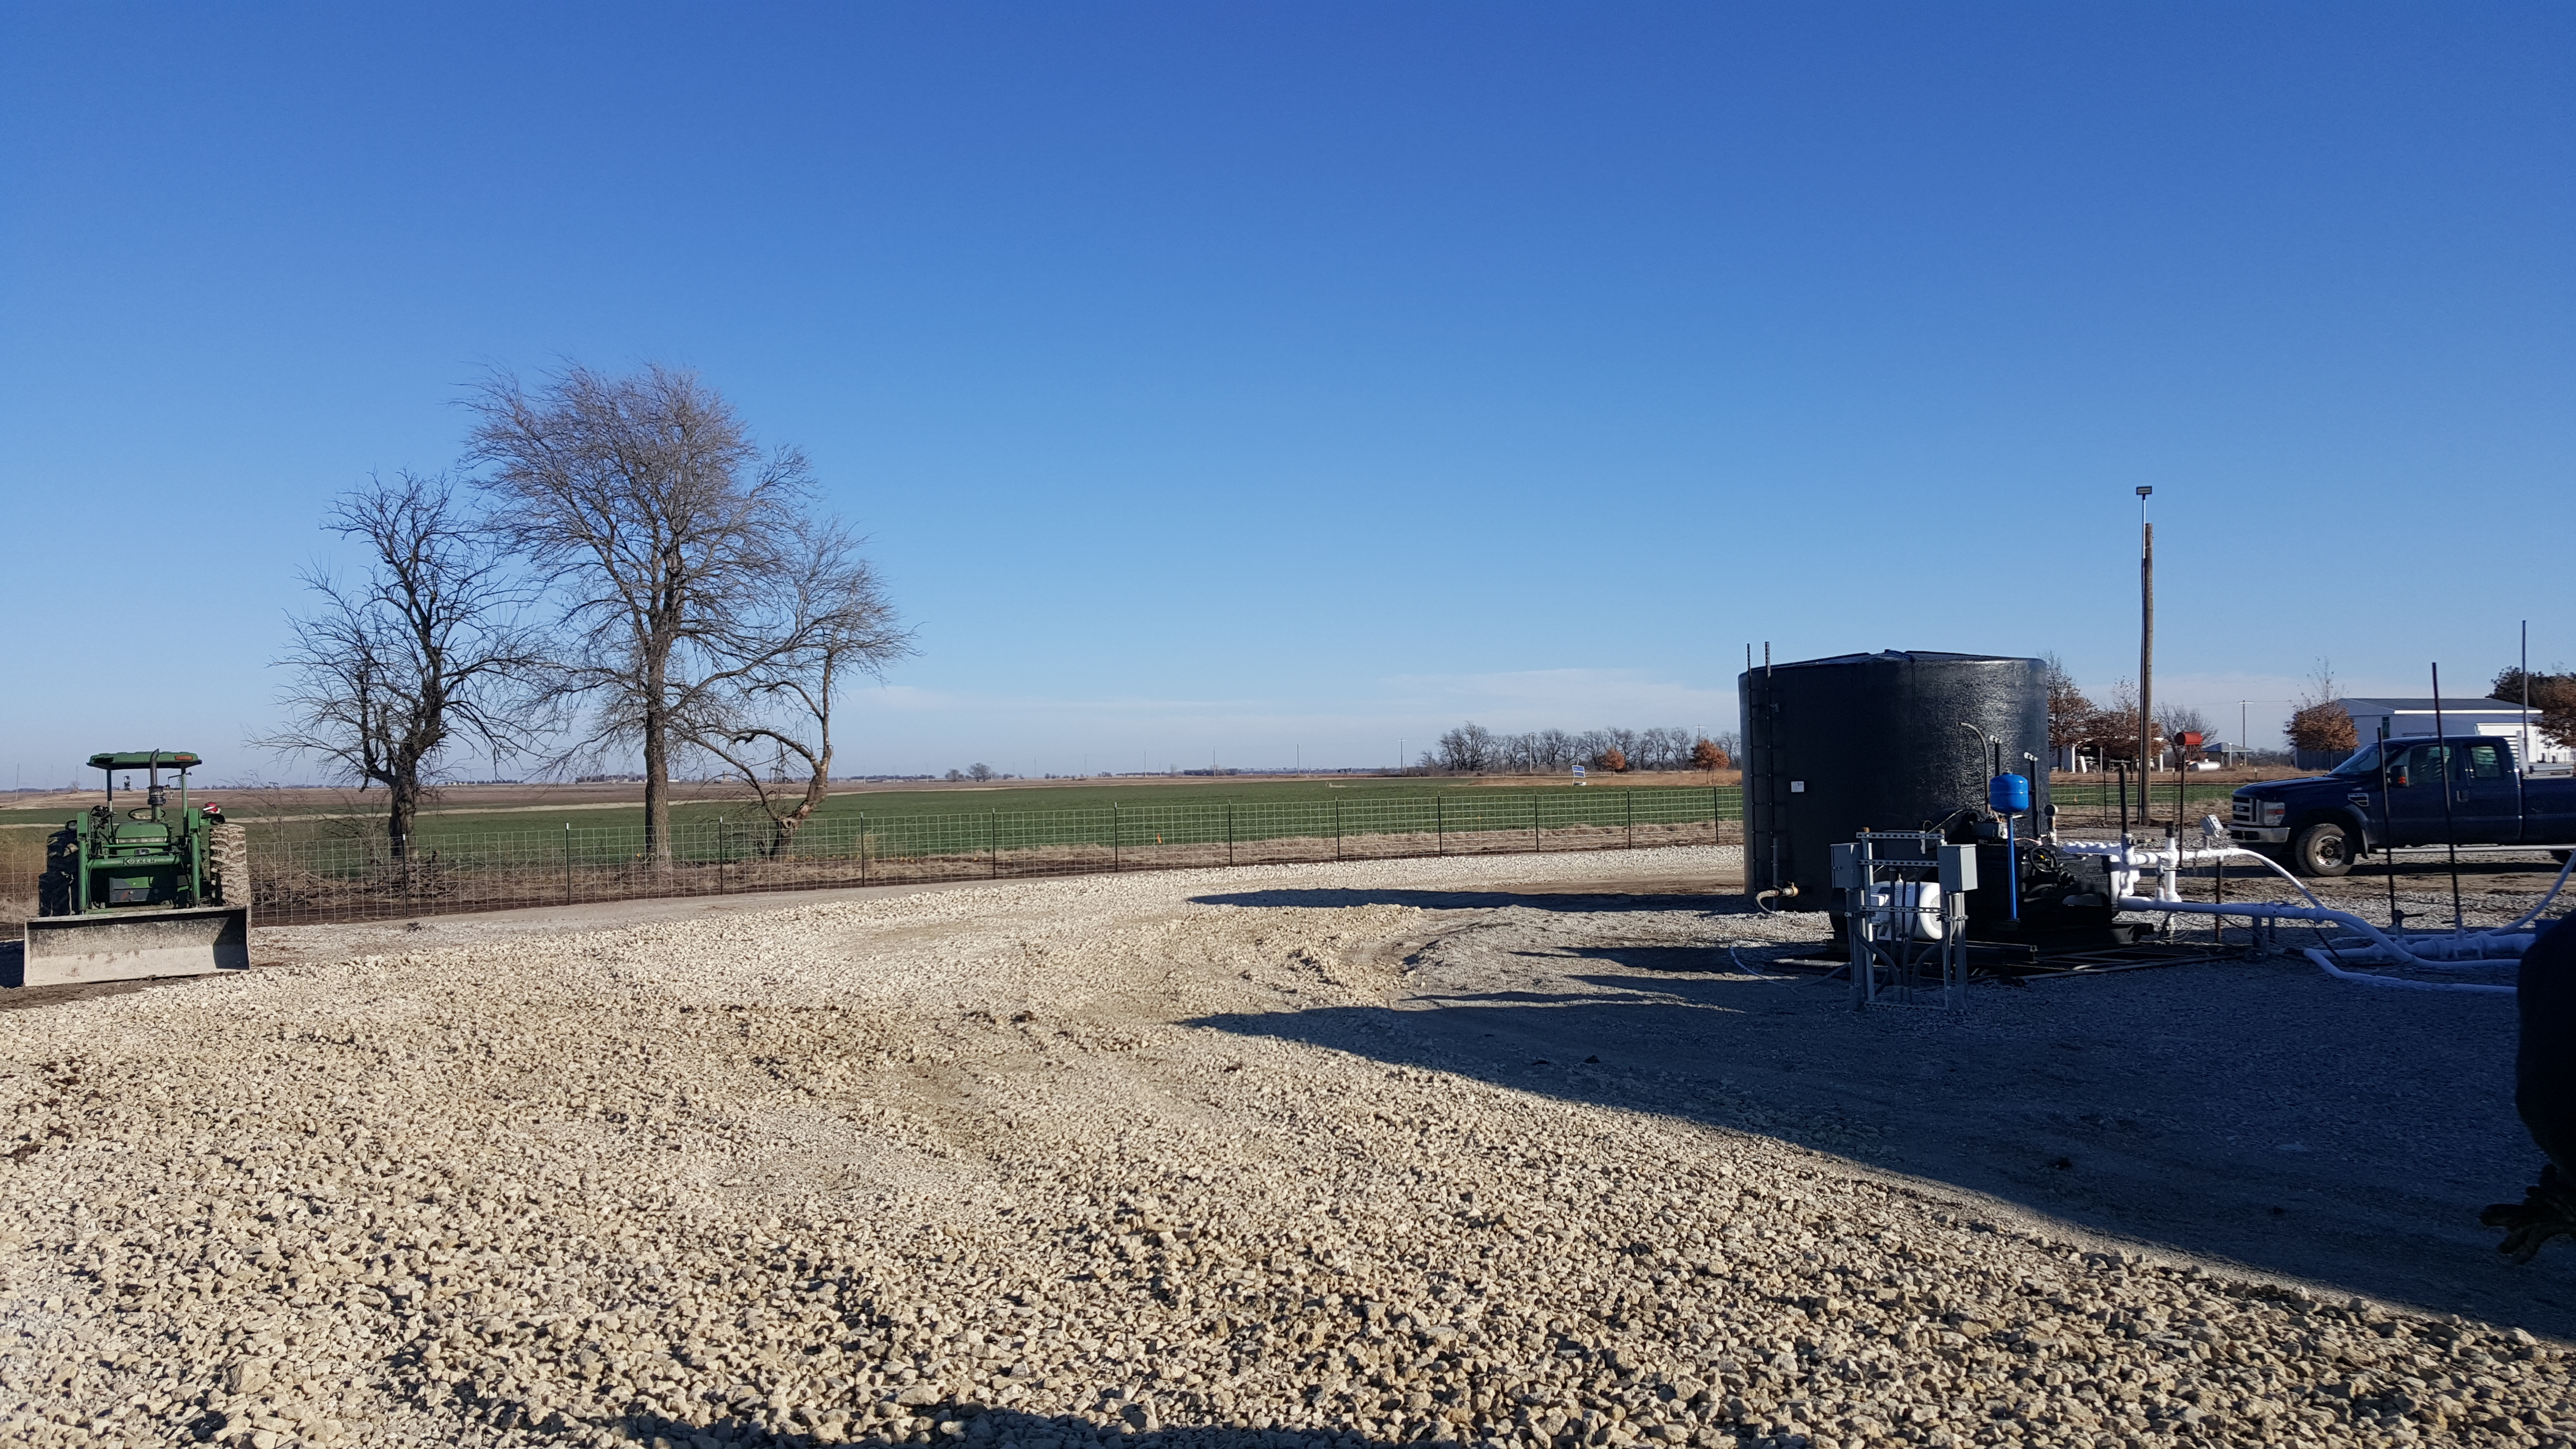
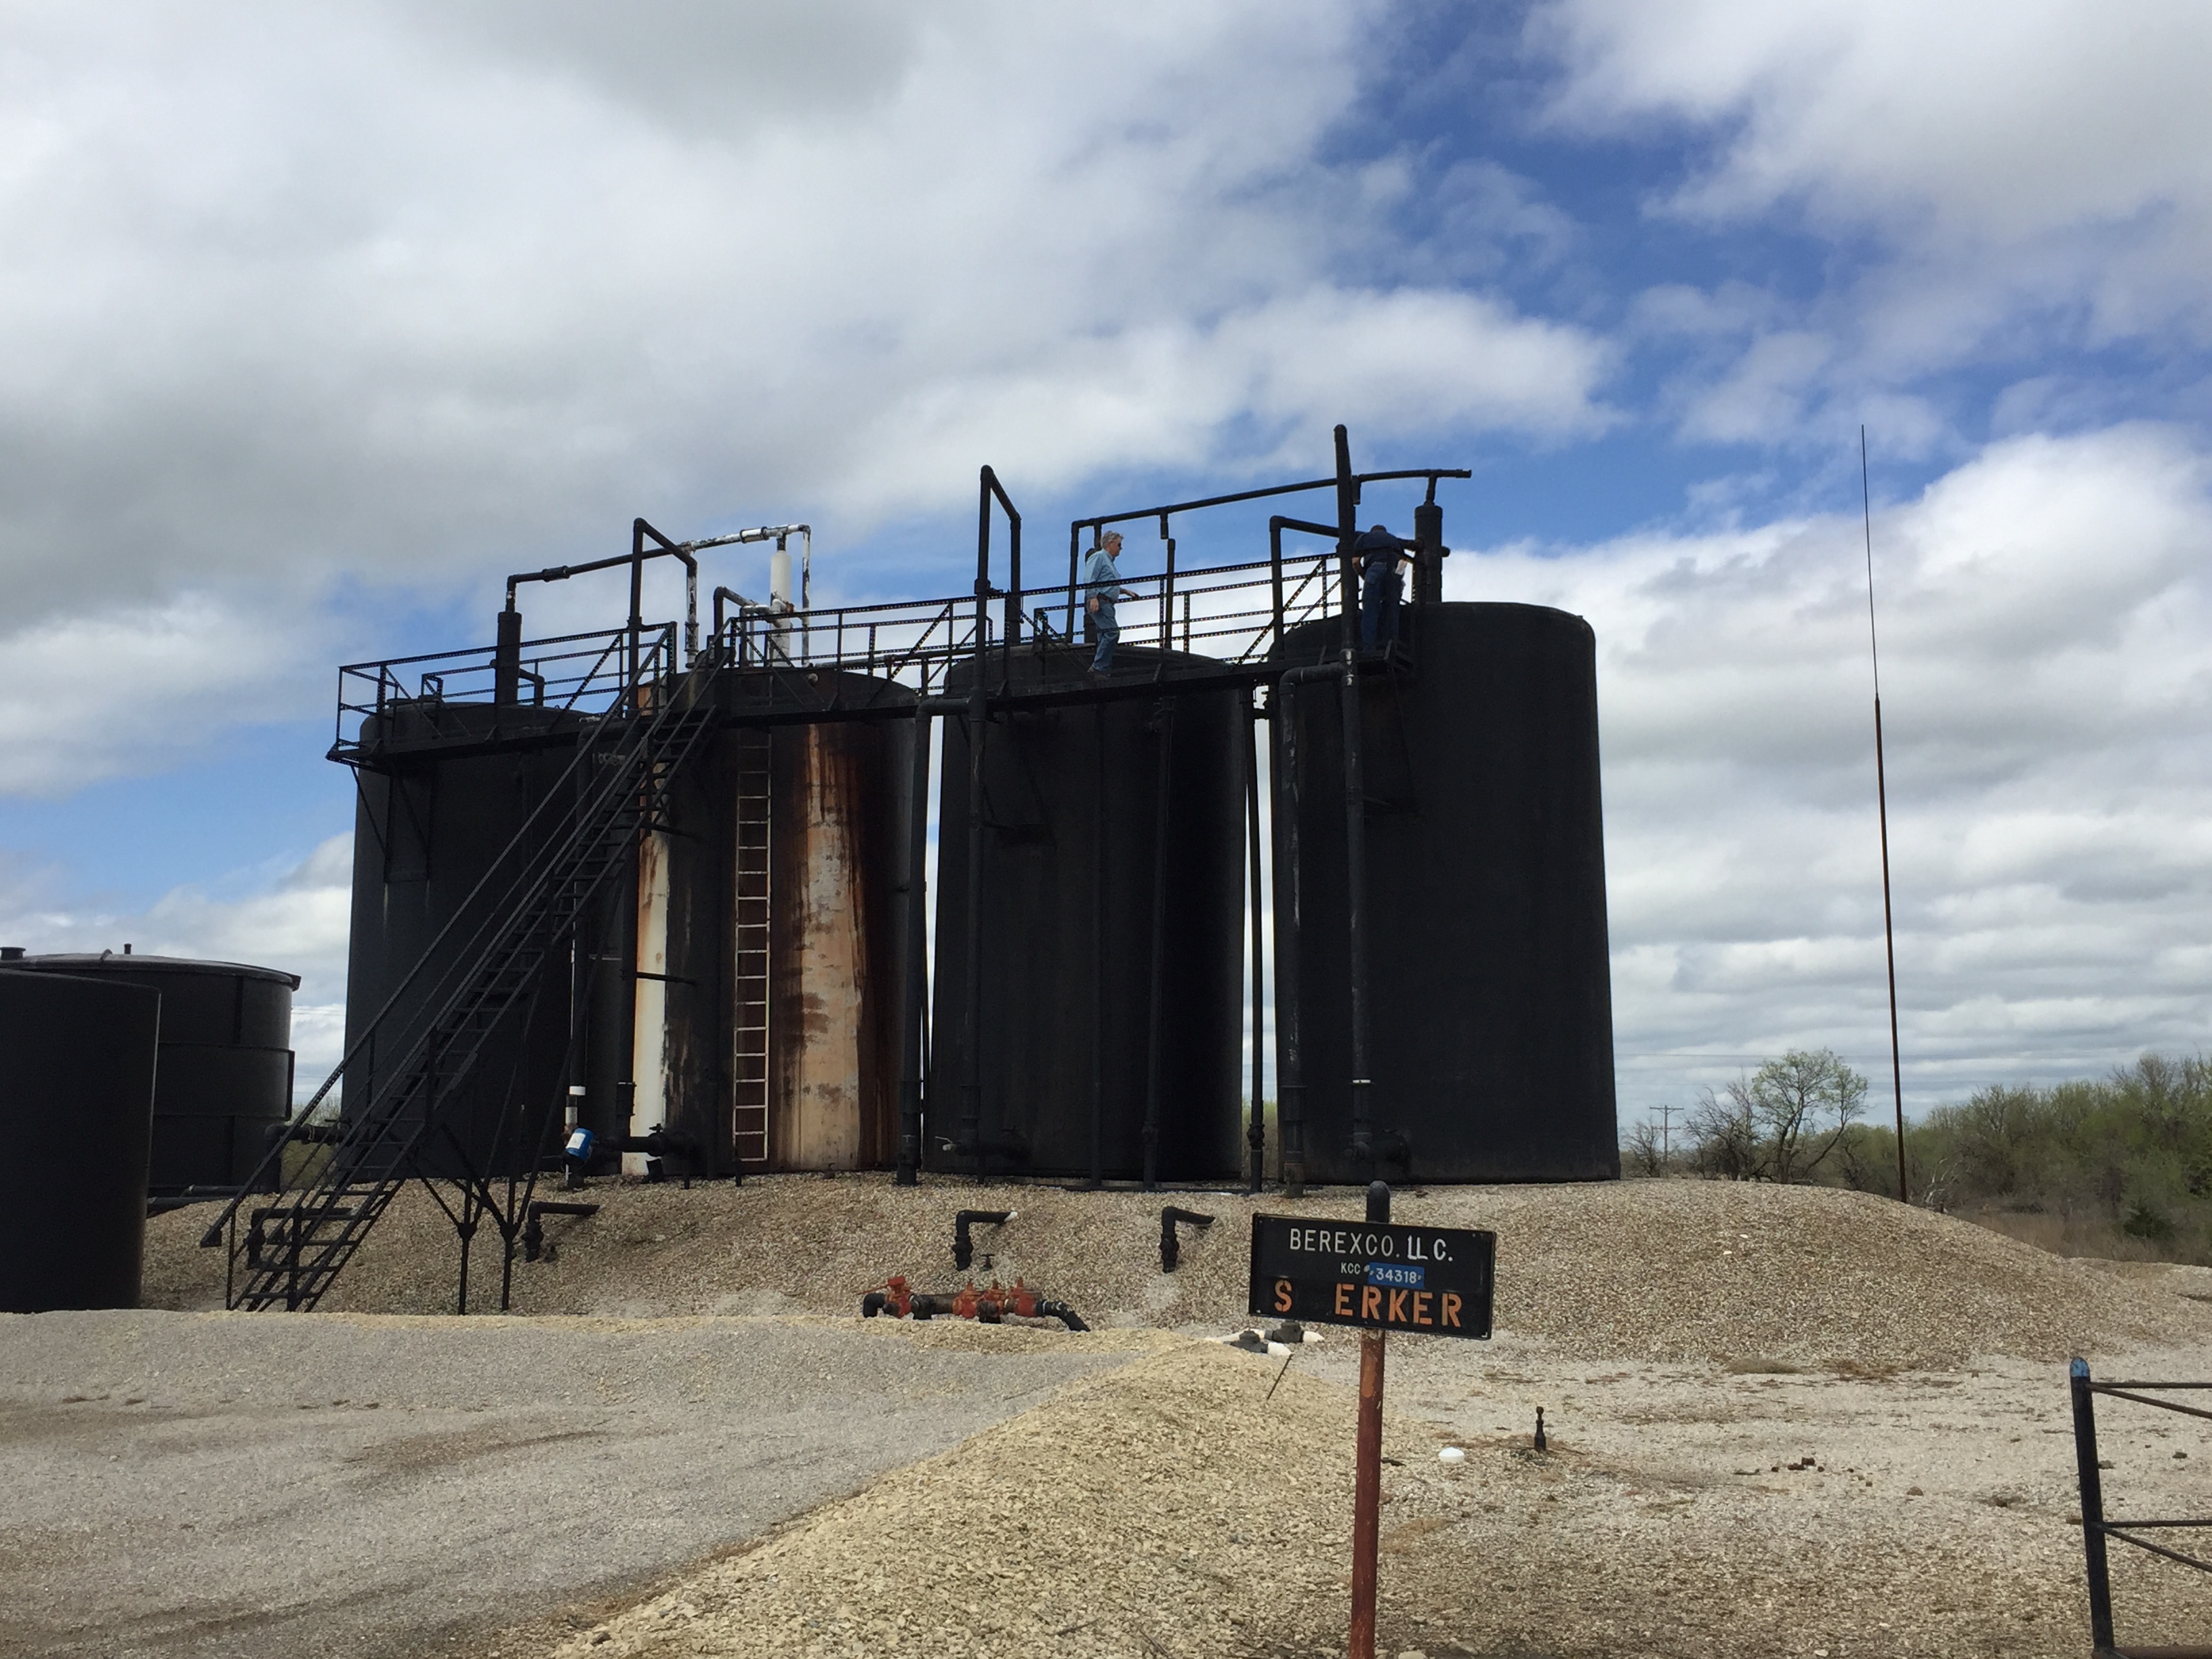
A view of the new S. Erker stock tank battery that was added to capture the additional production from the CO2 wells.

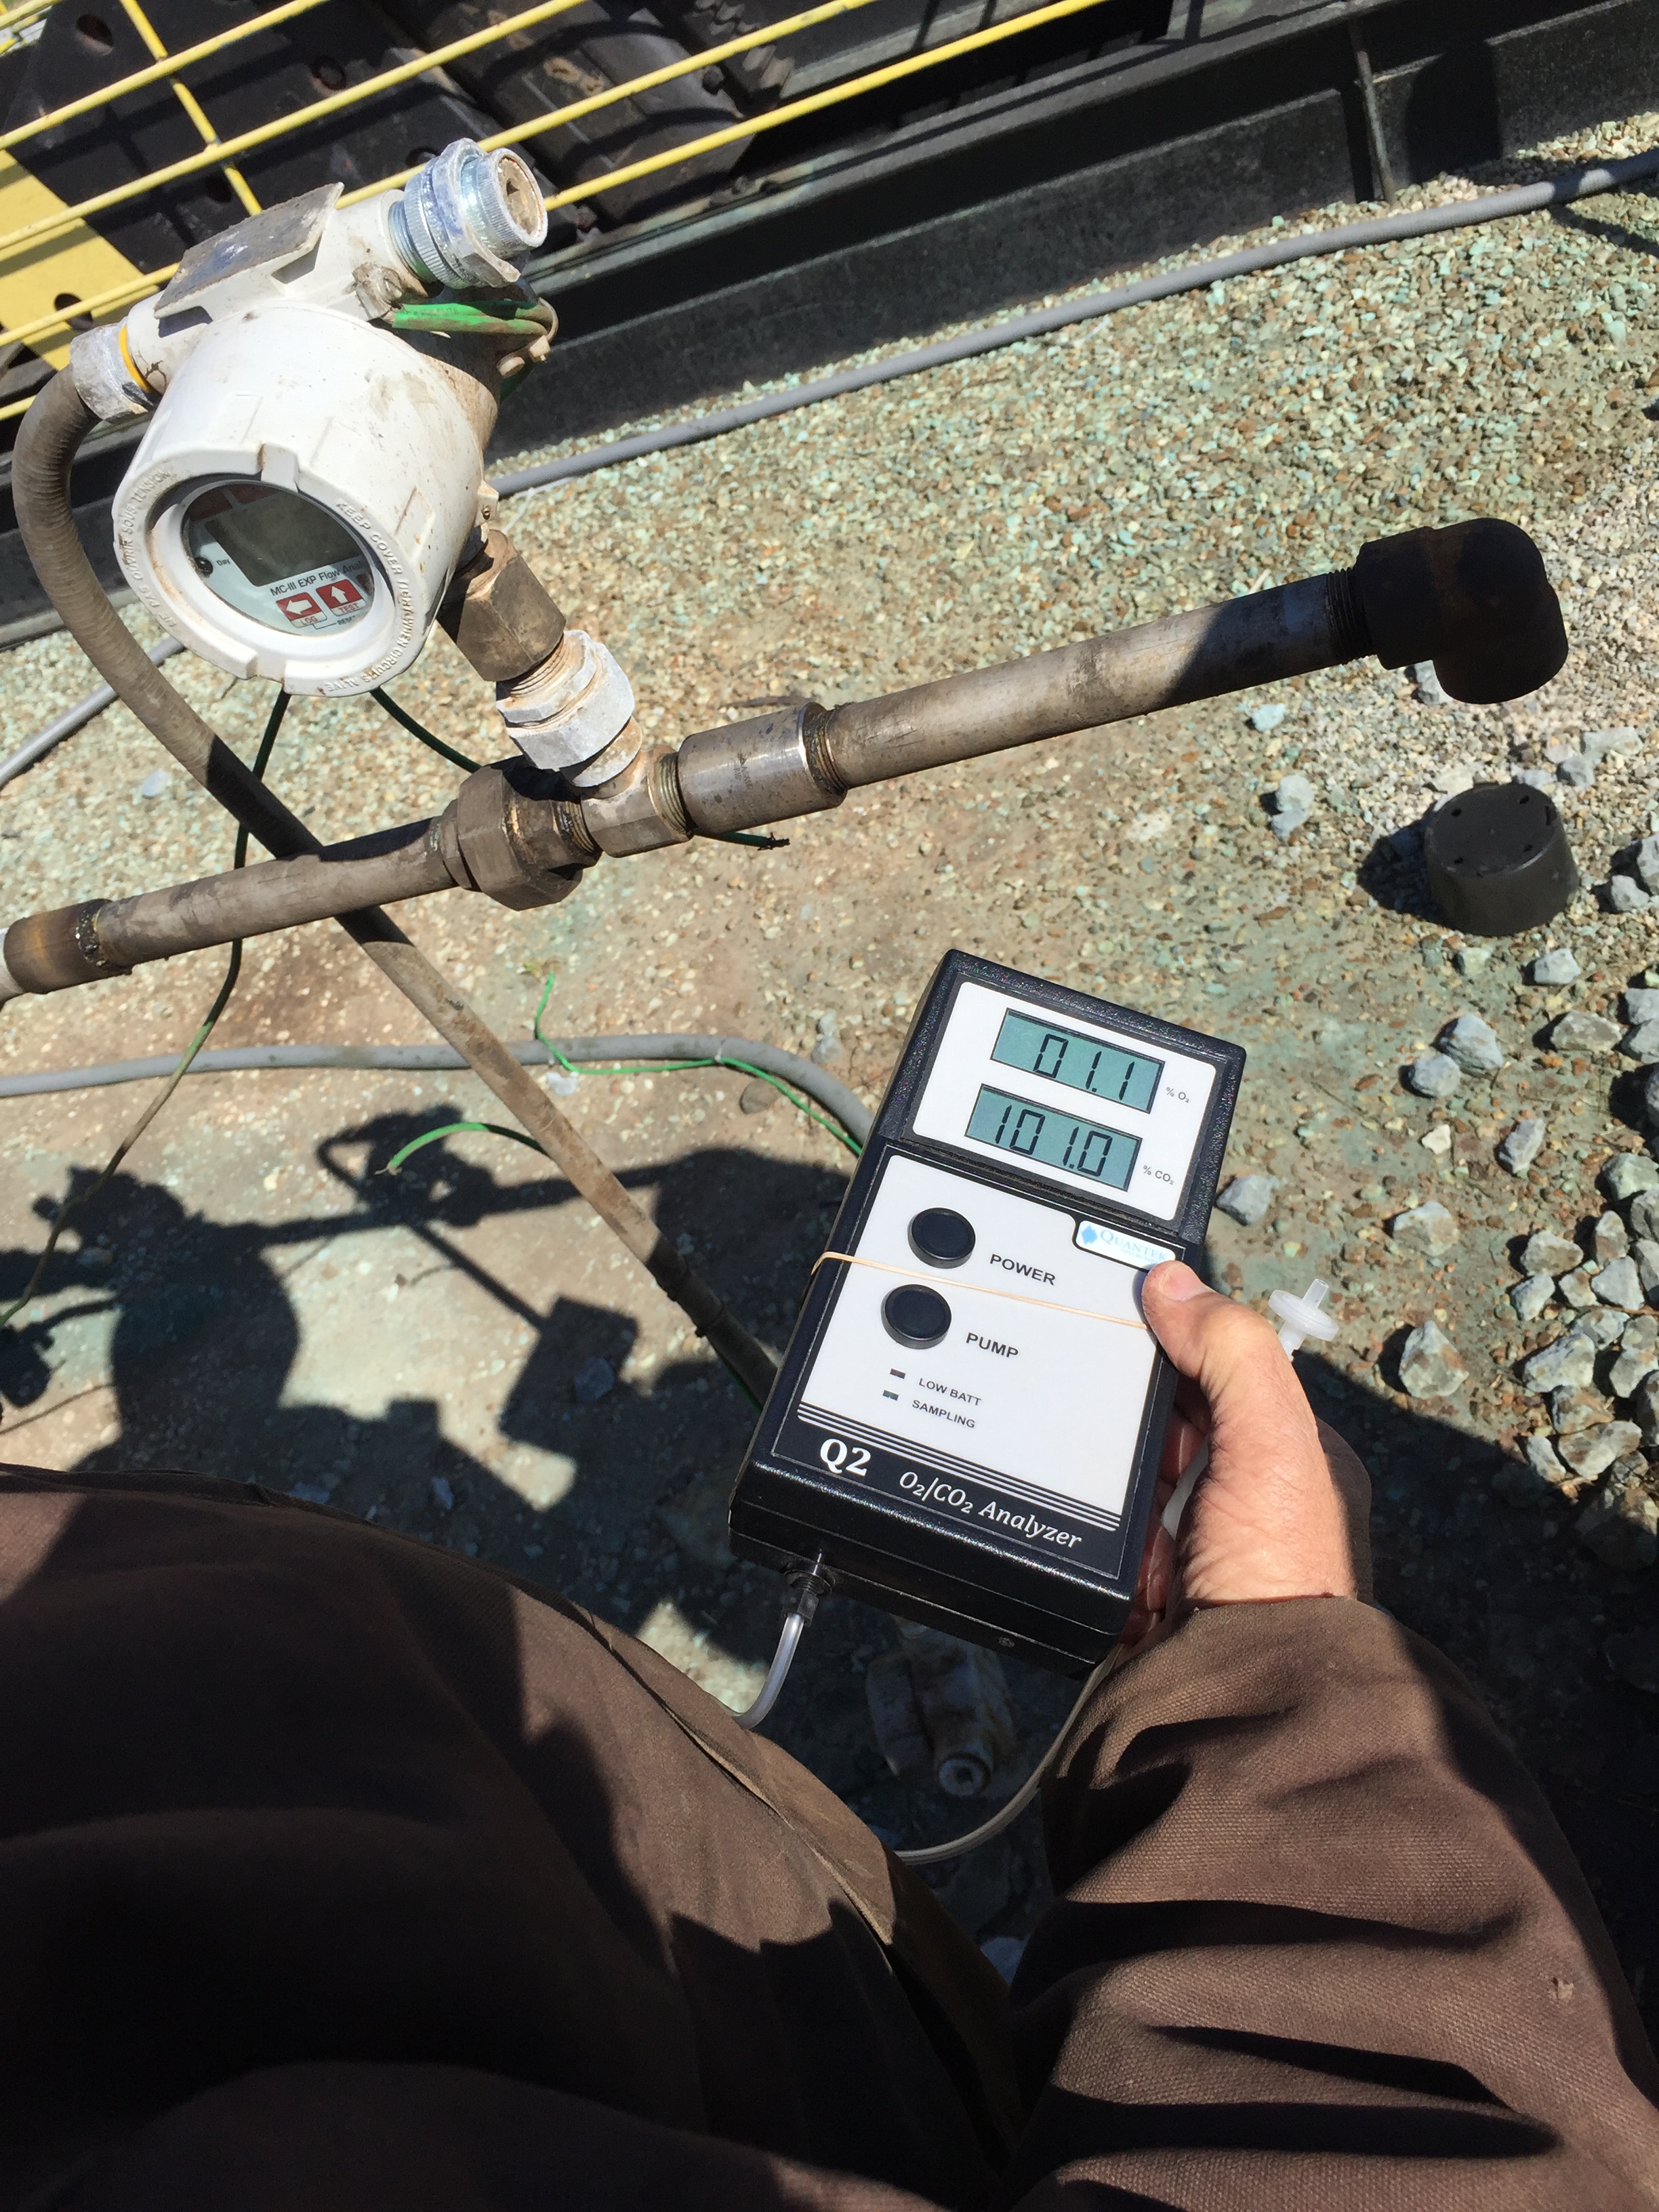
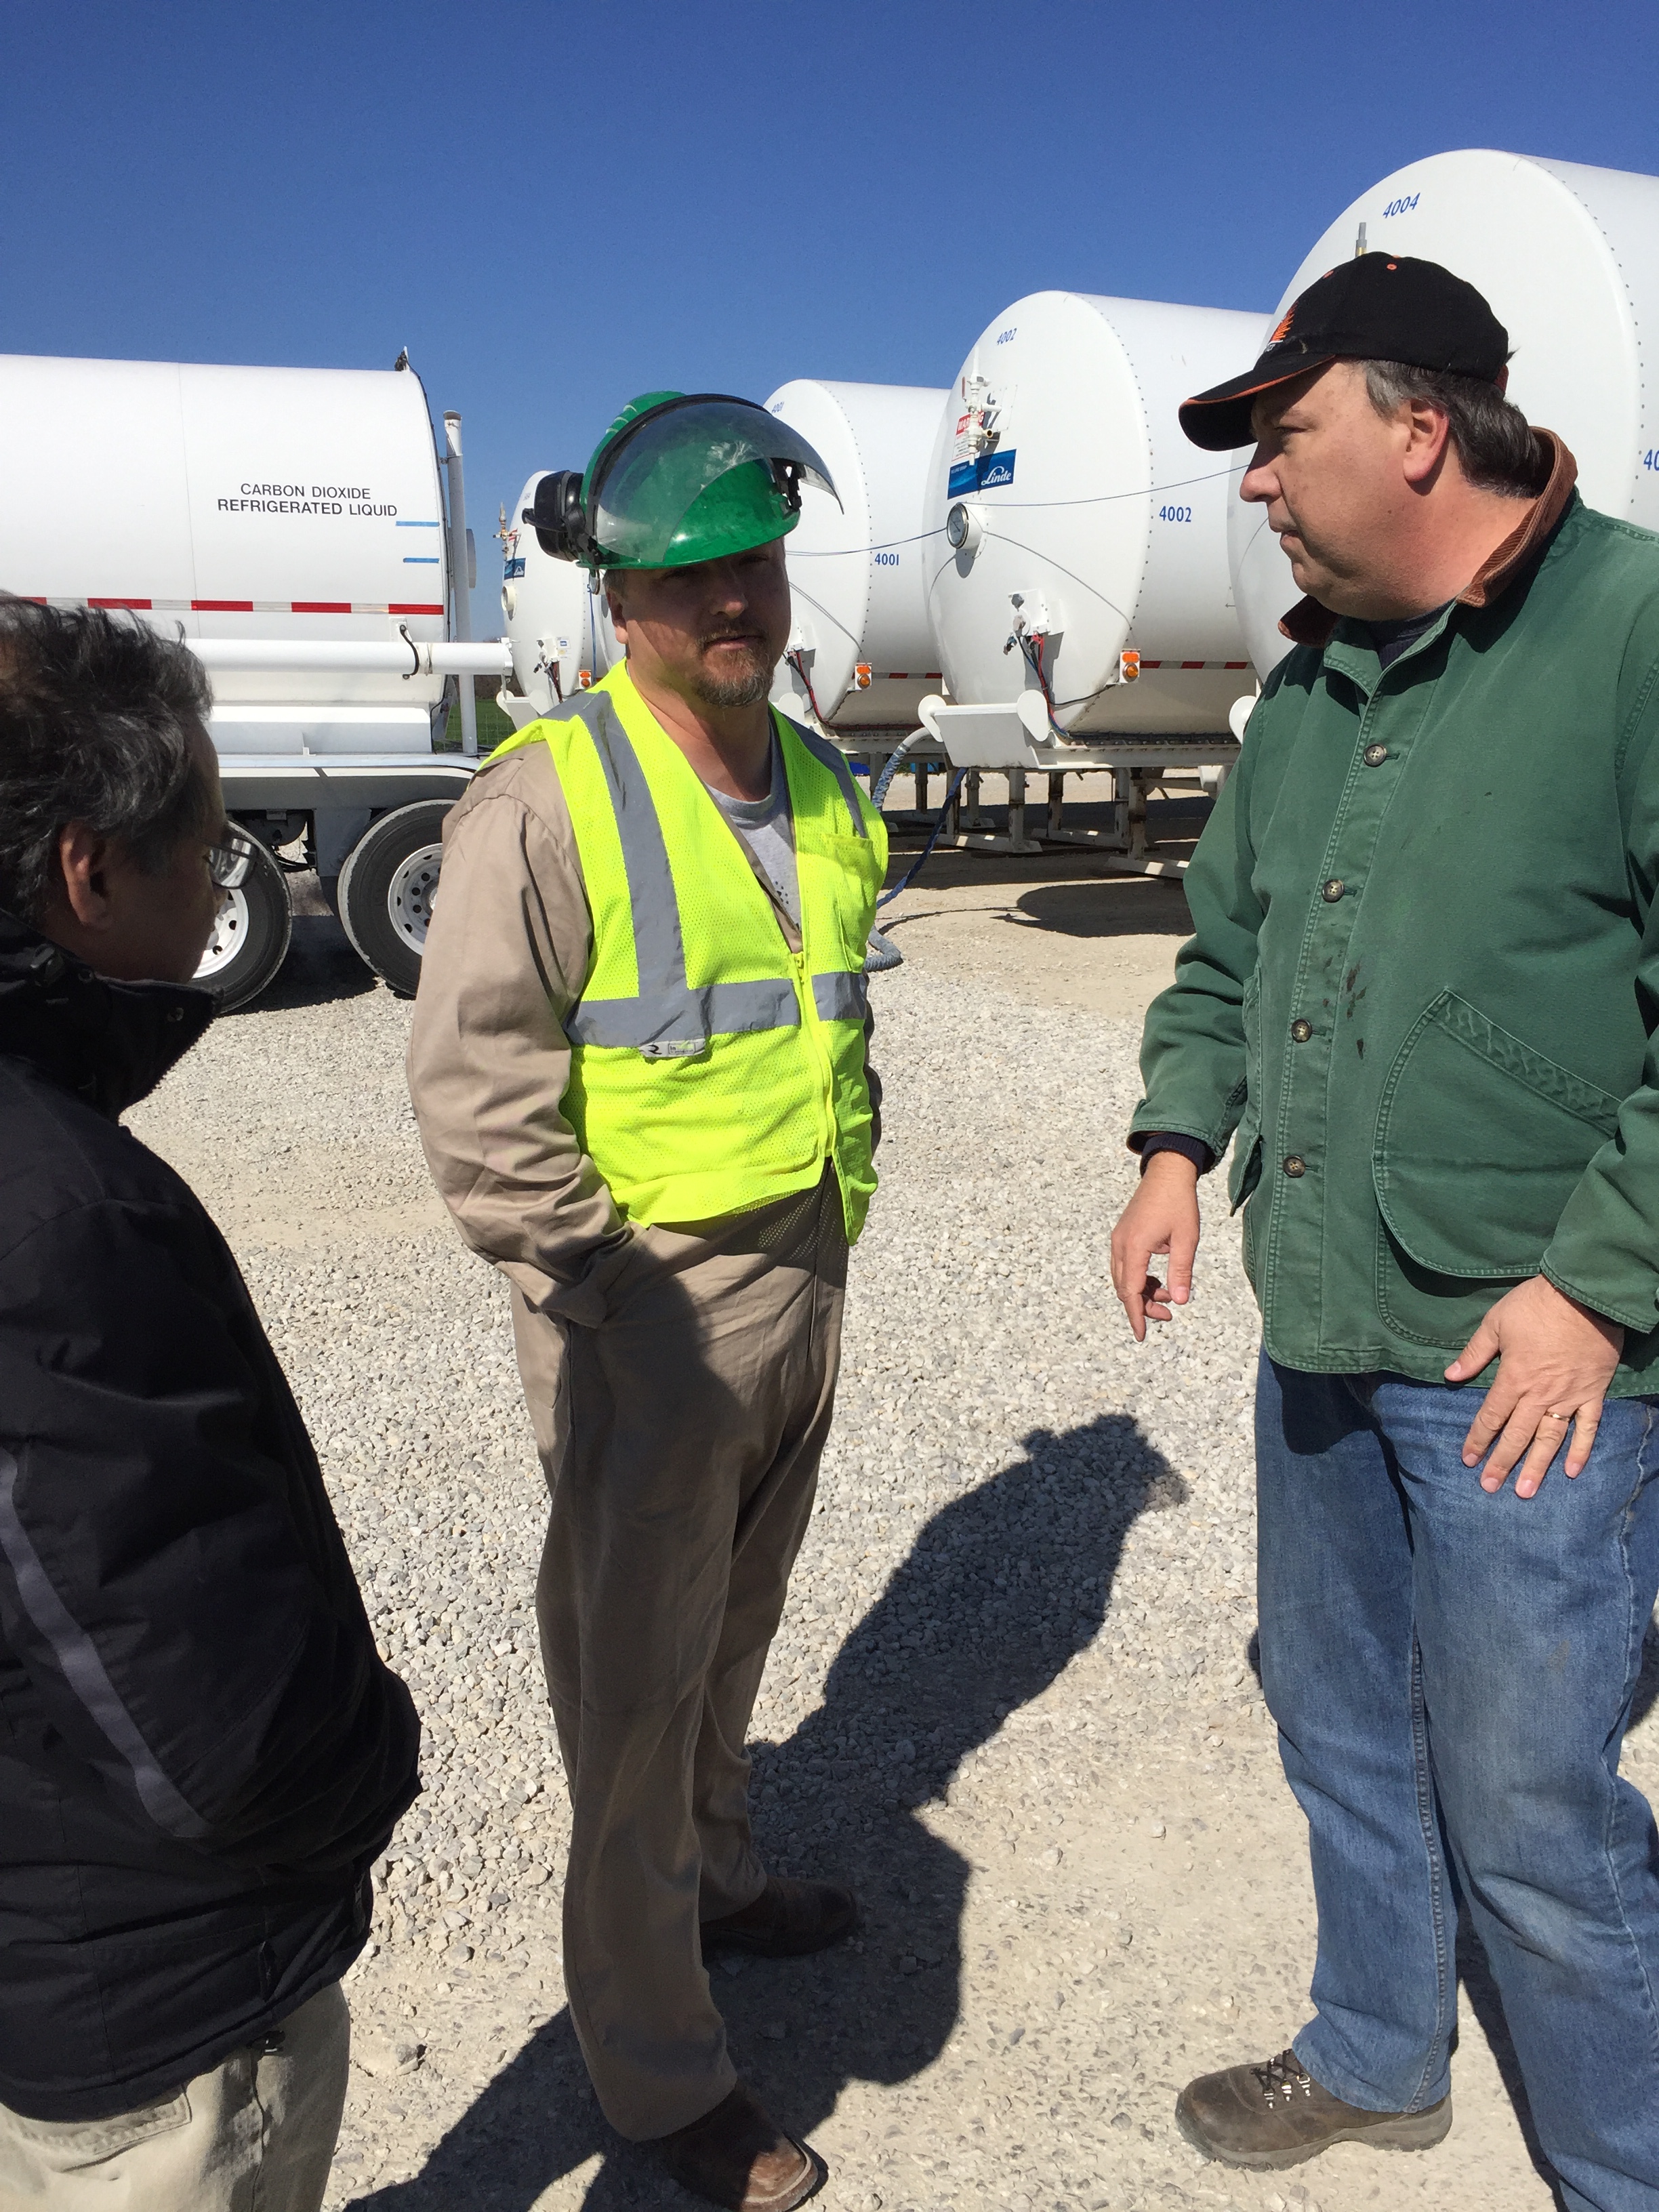
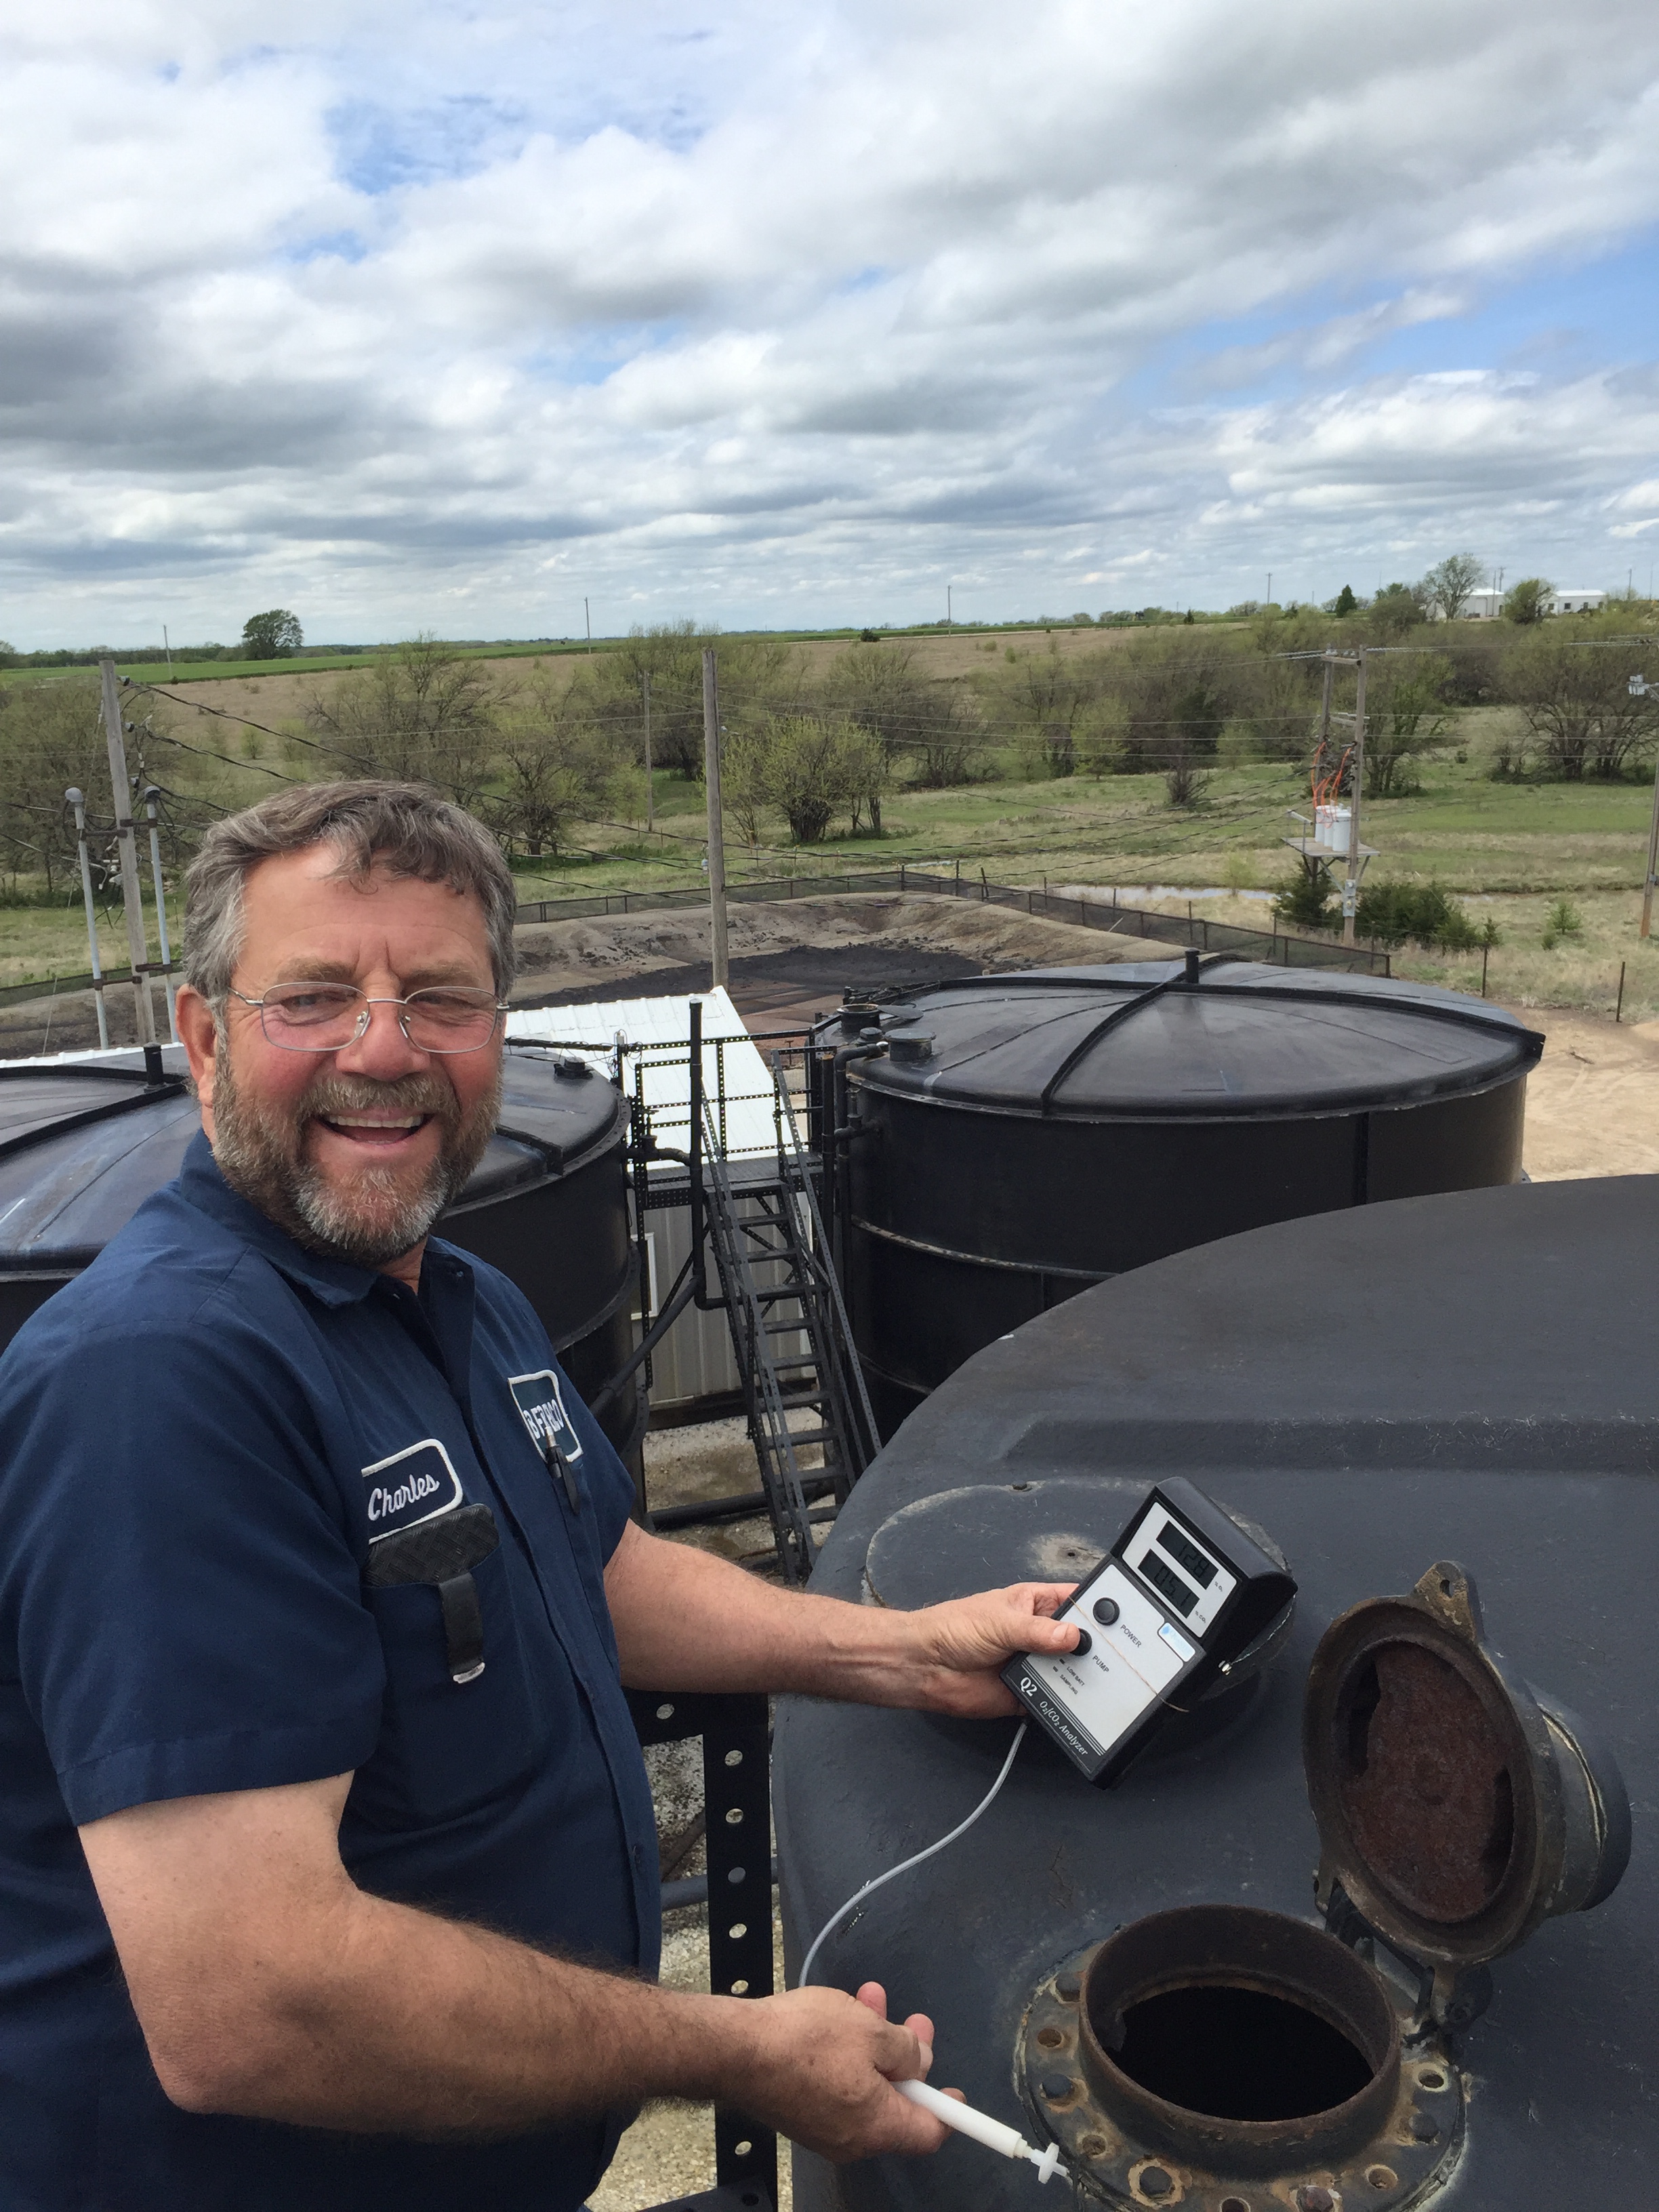
Charlie Miller measures the percent CO2 composition of the vented gas at the S Erker tank battery. About 5.4% CO2 was detected, indicating the arrival of CO2 in one of the surrounding wells. This information, along with finer details recorded from each well, will help researchers identify the behavior and characteristics of the CO2 plume within the reservoir.

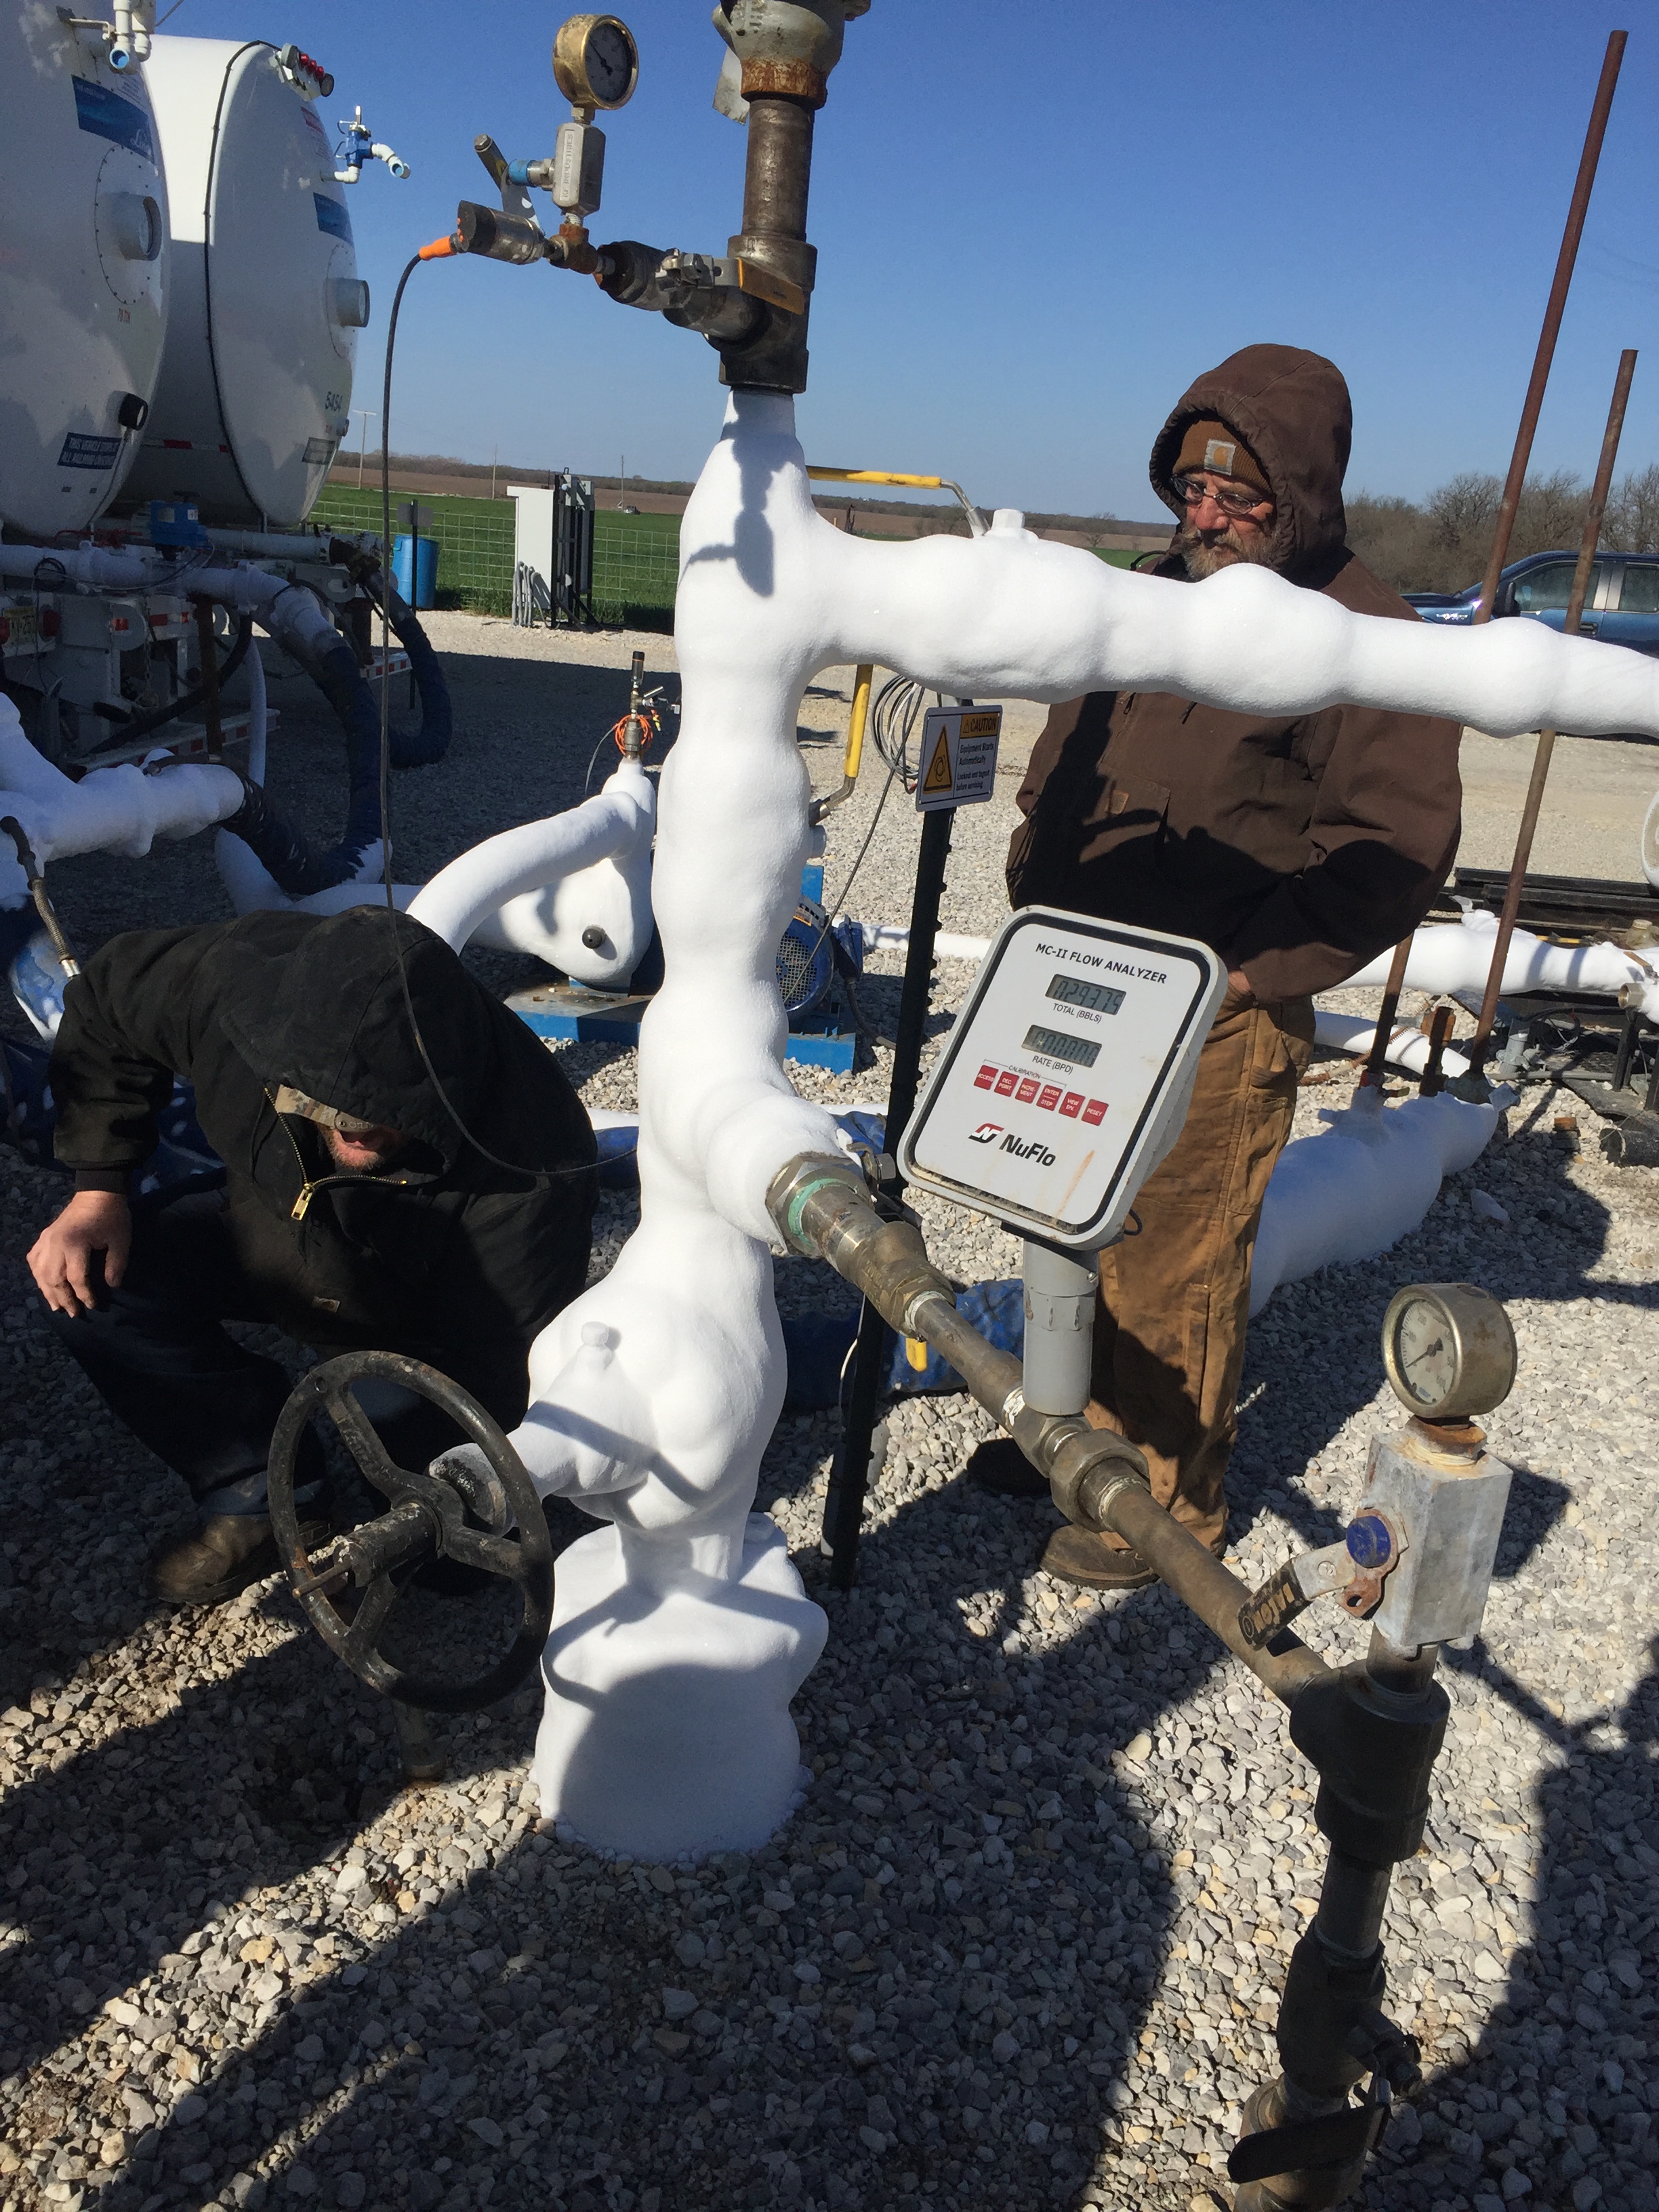
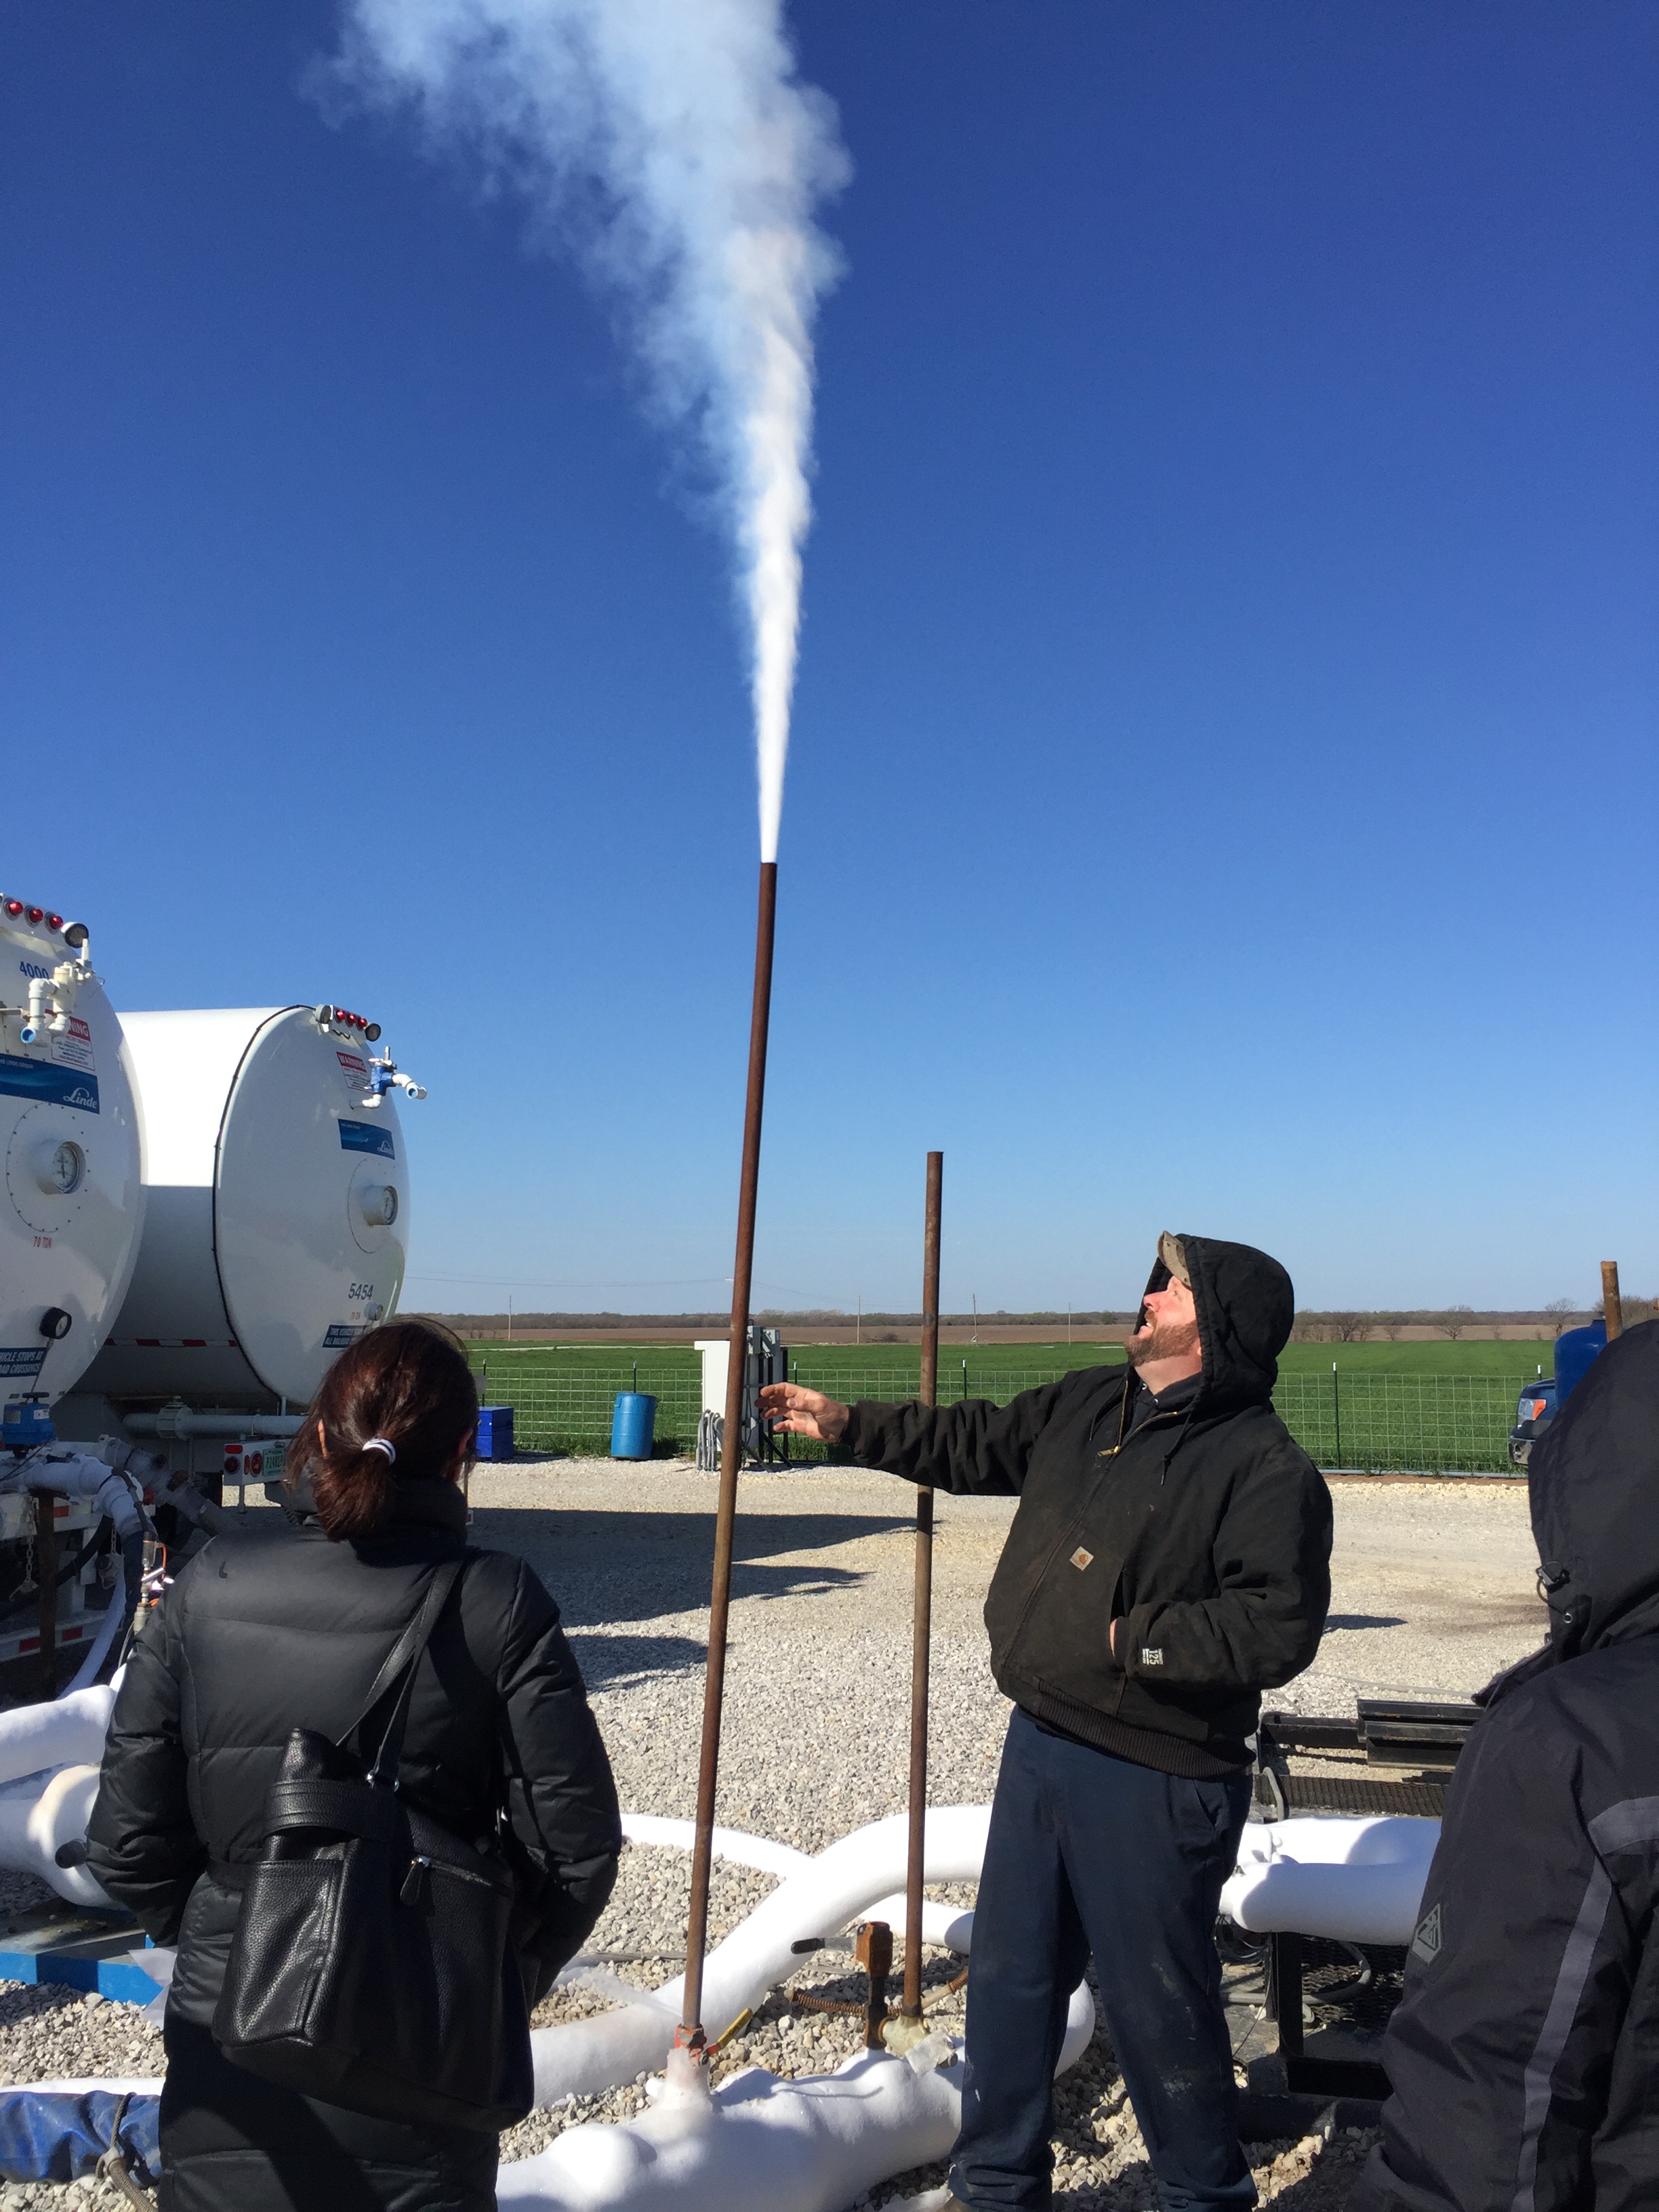
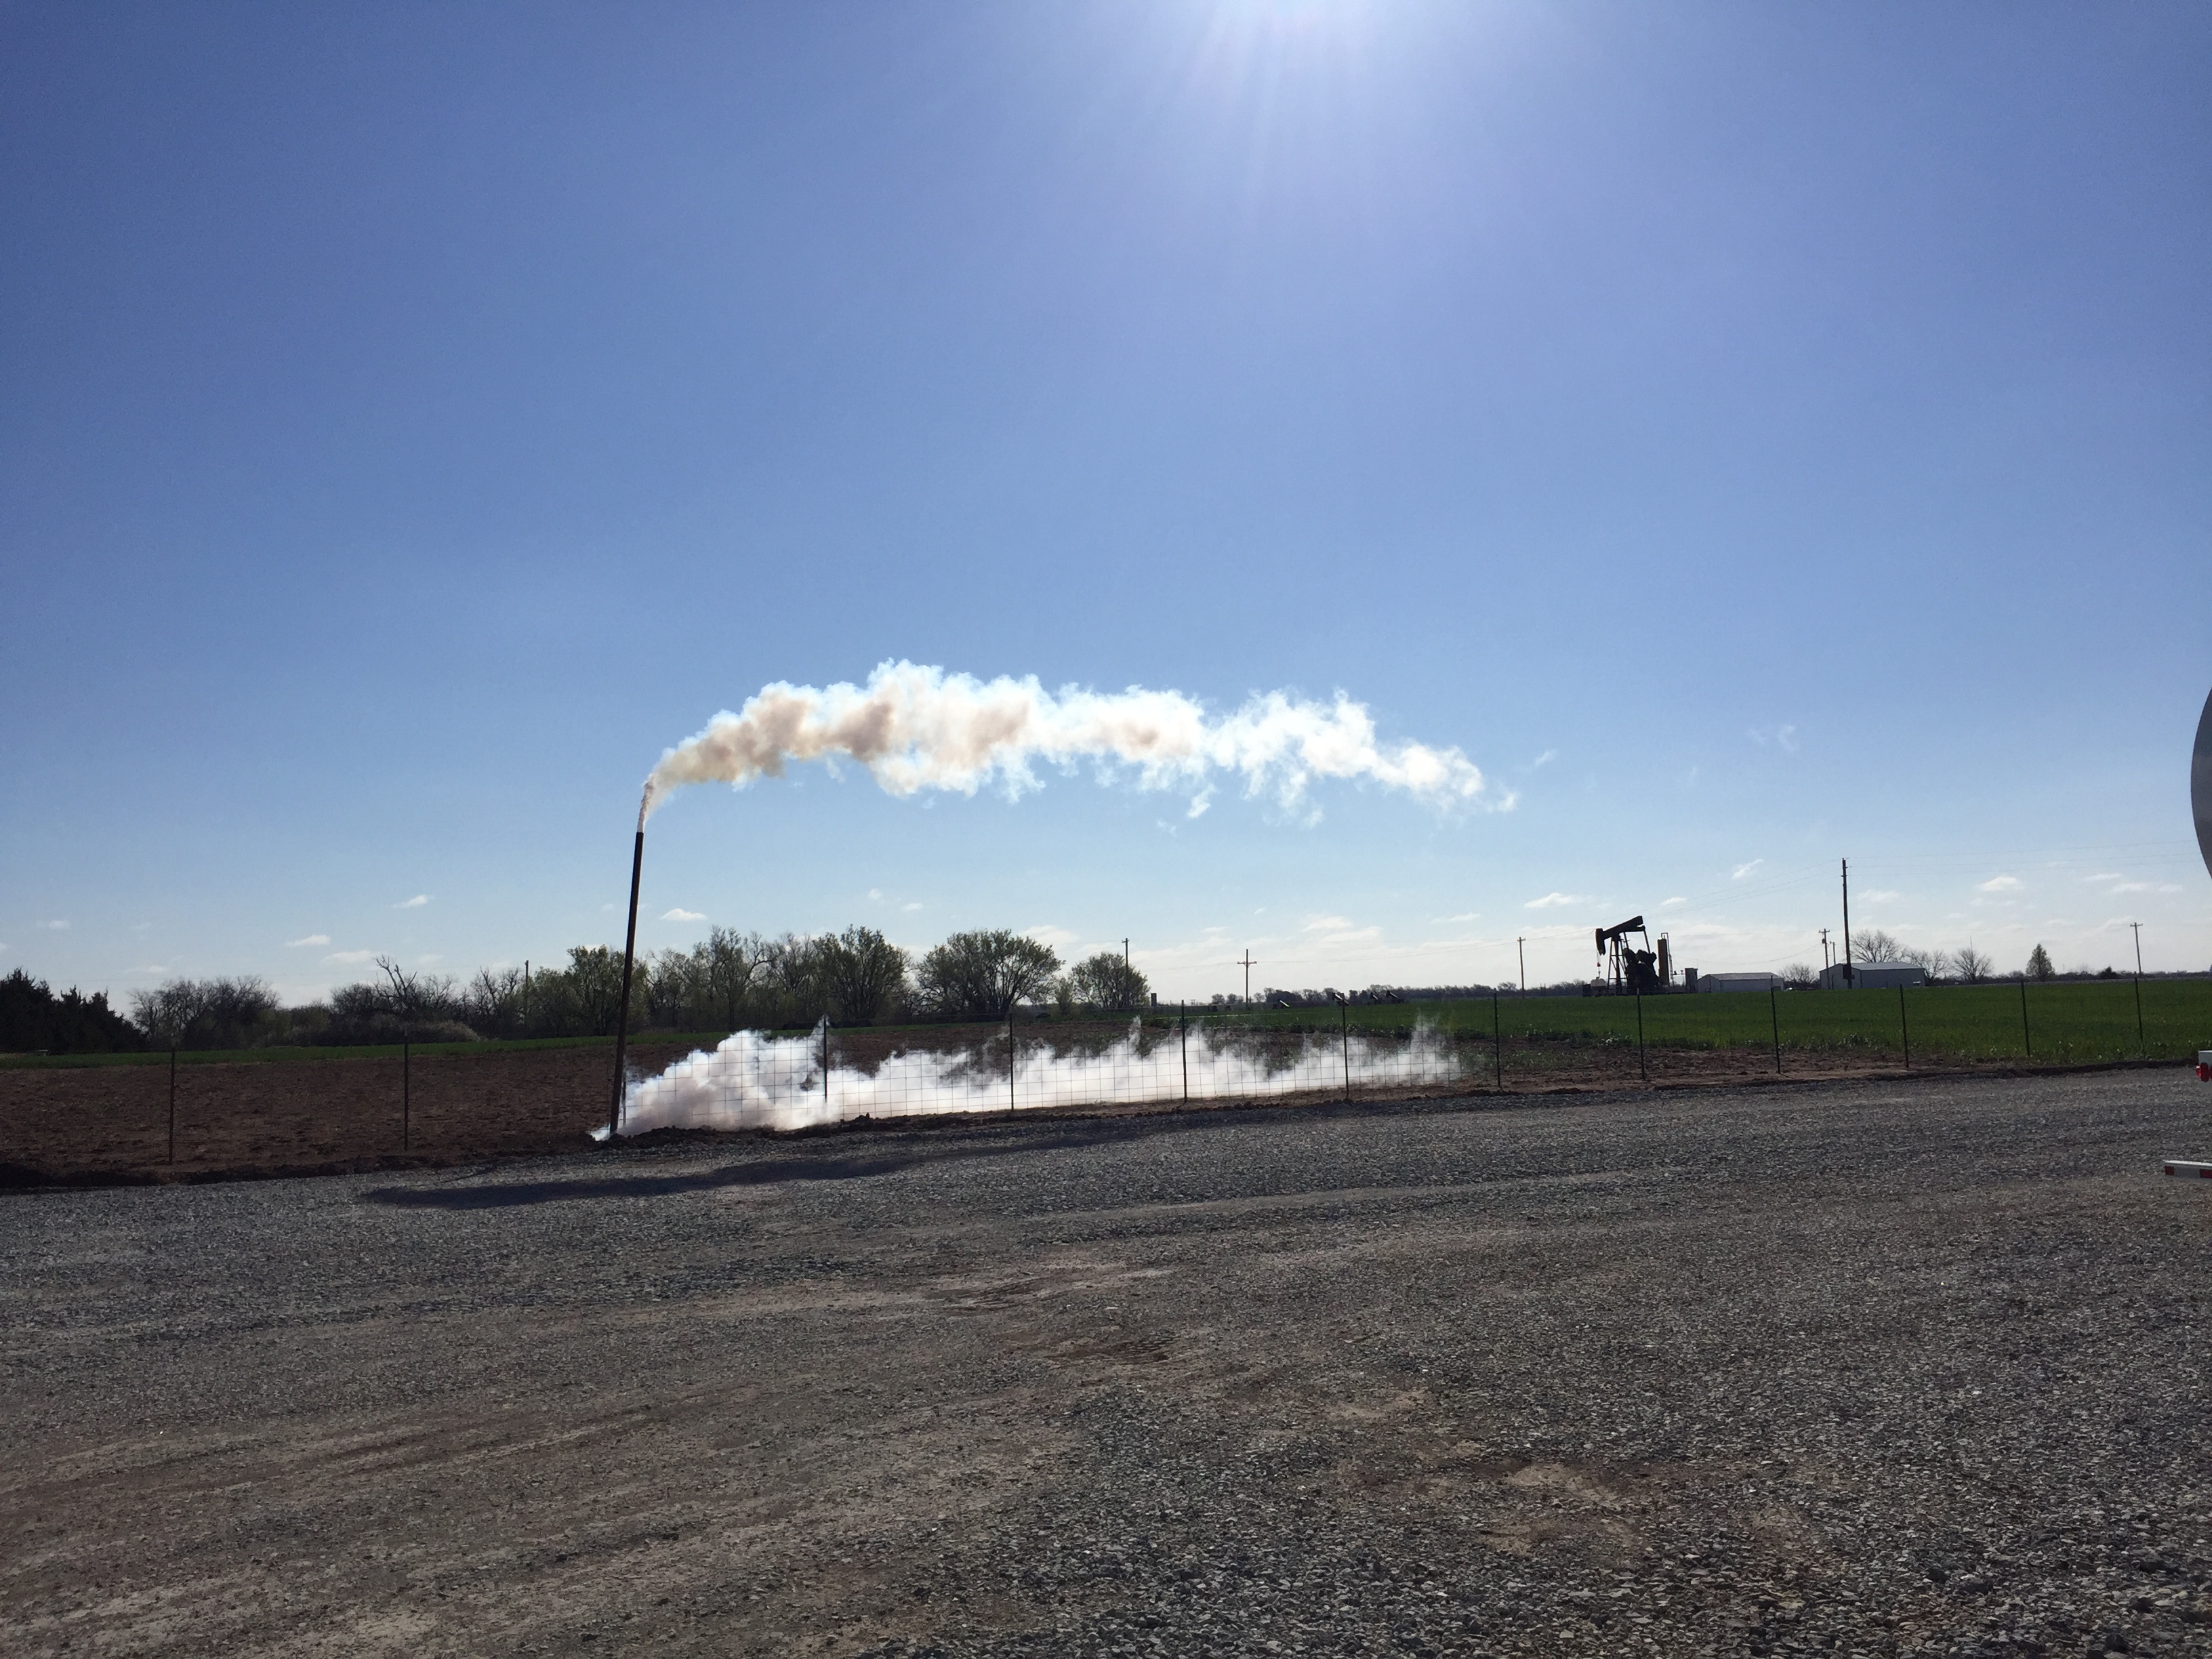
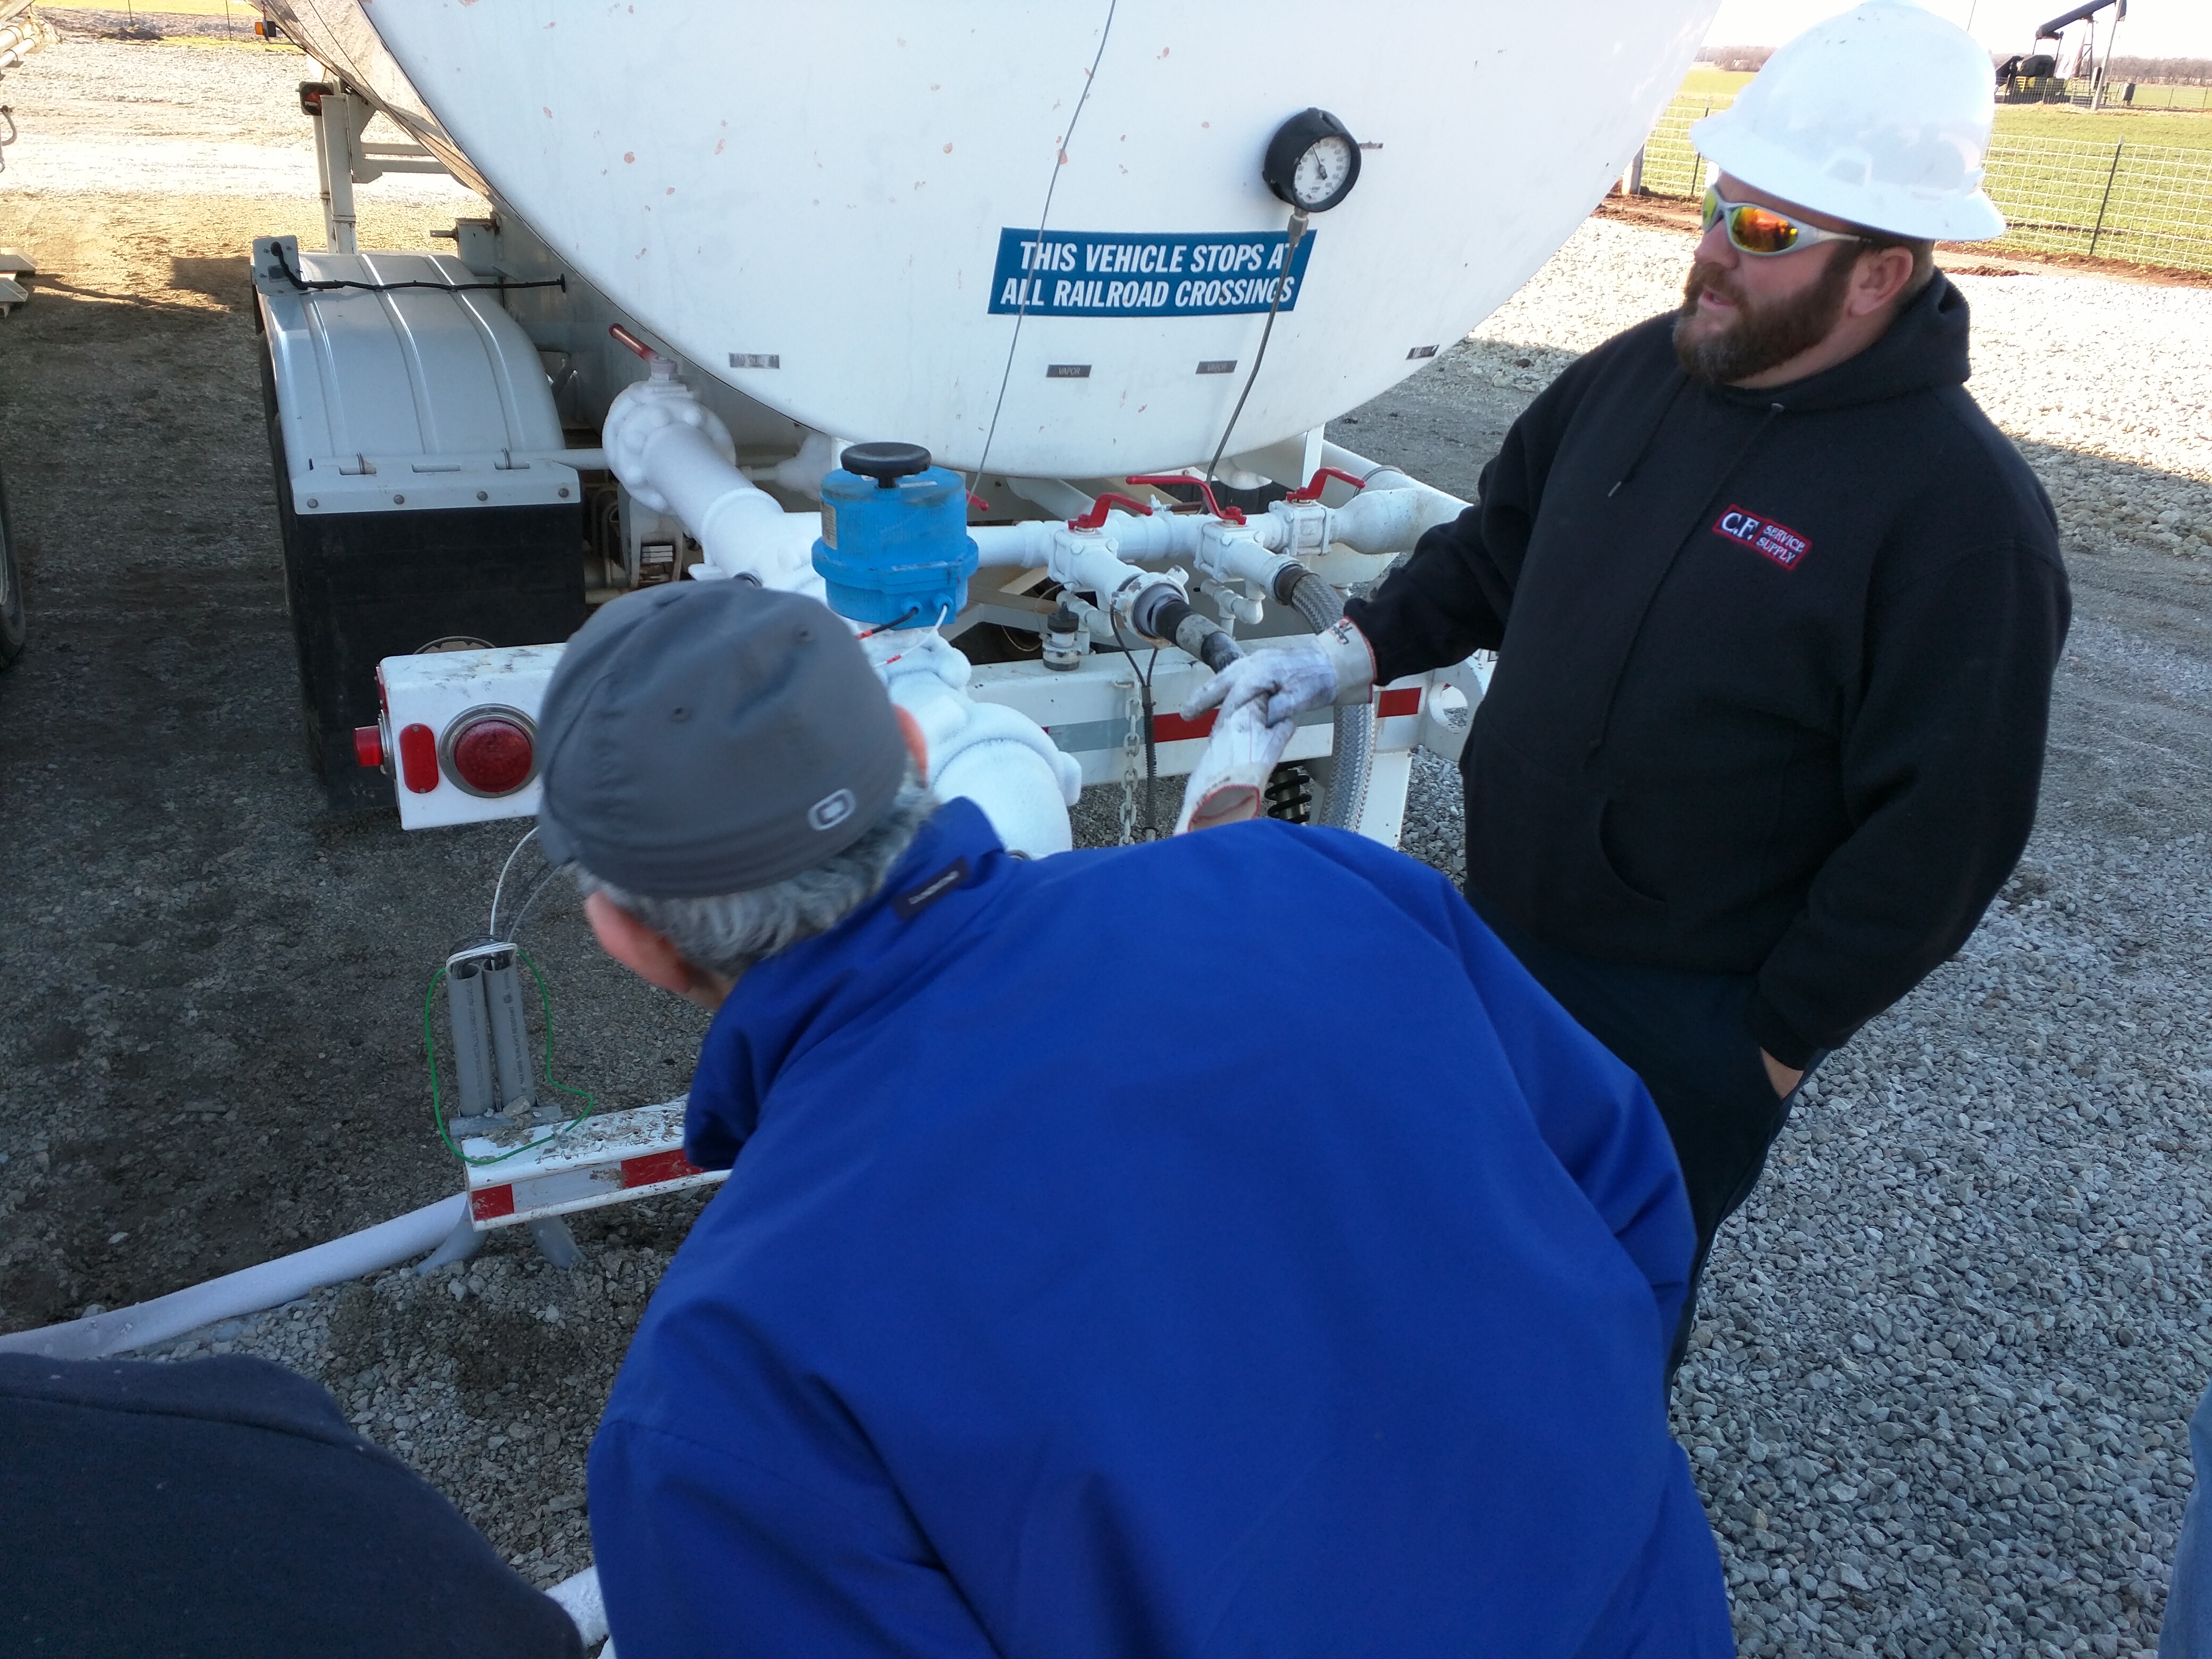
Jason Bruns vents excess CO2 vapor from the KGS 2-32 wellhead.

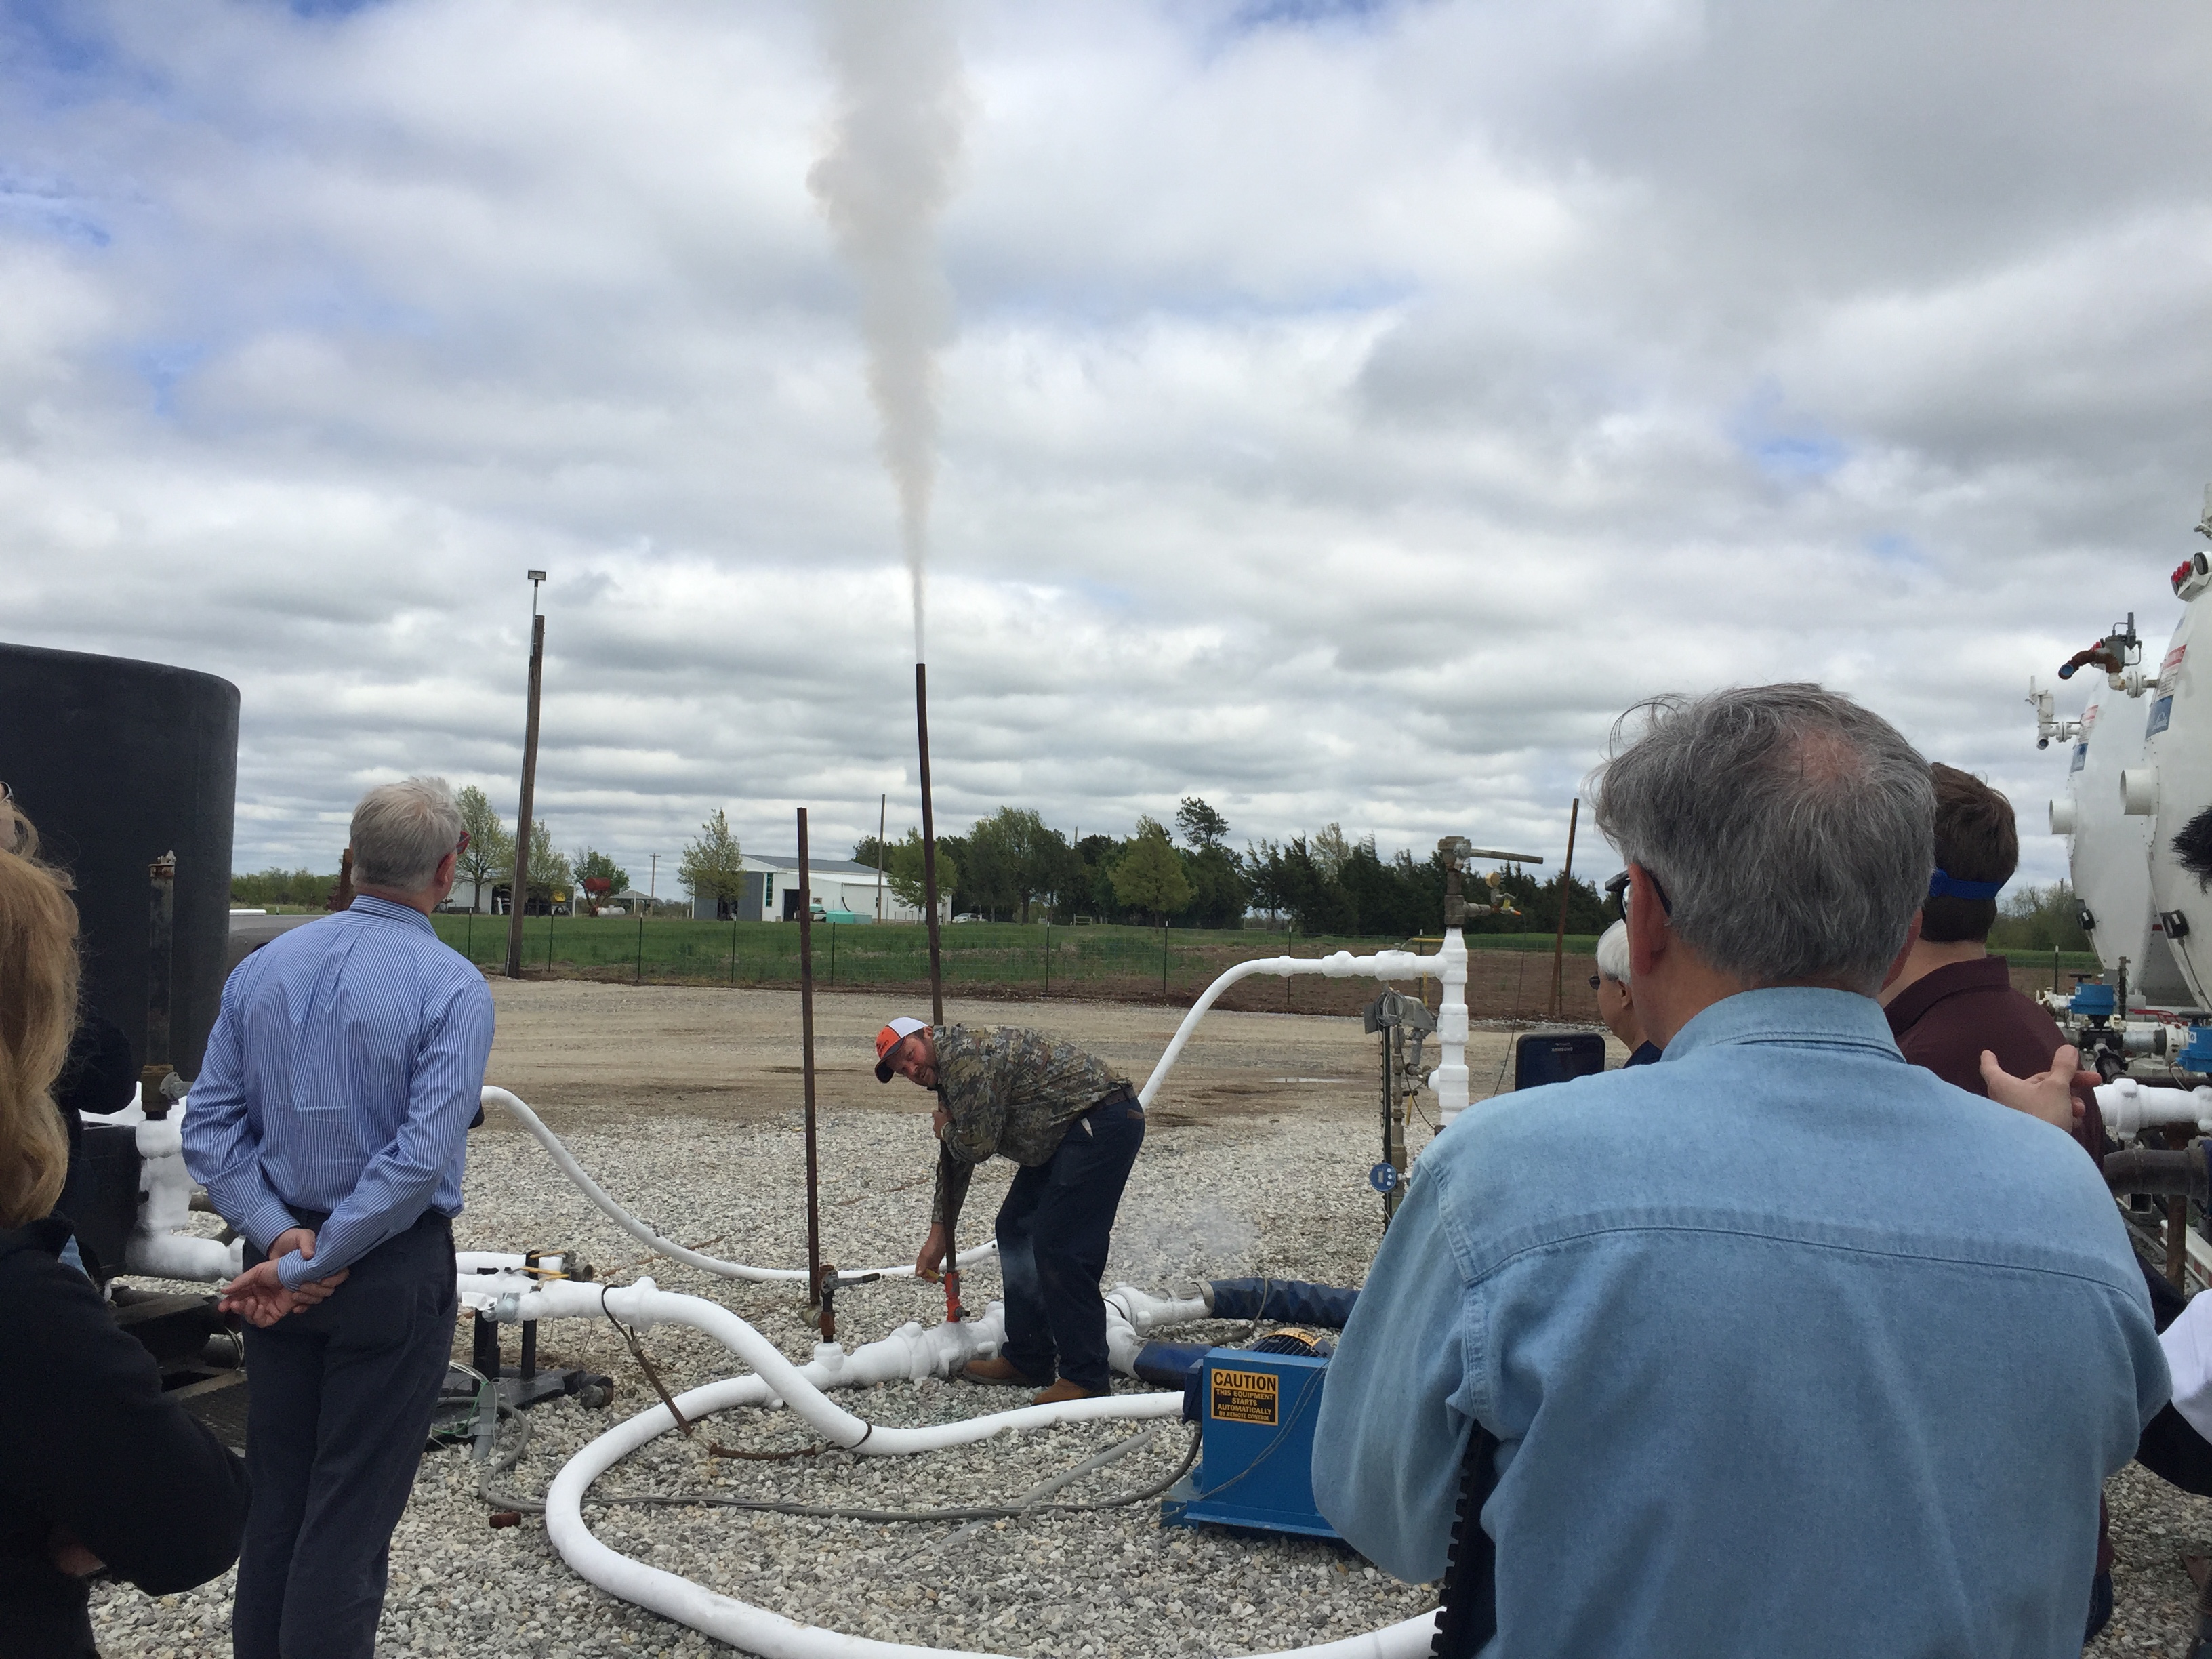
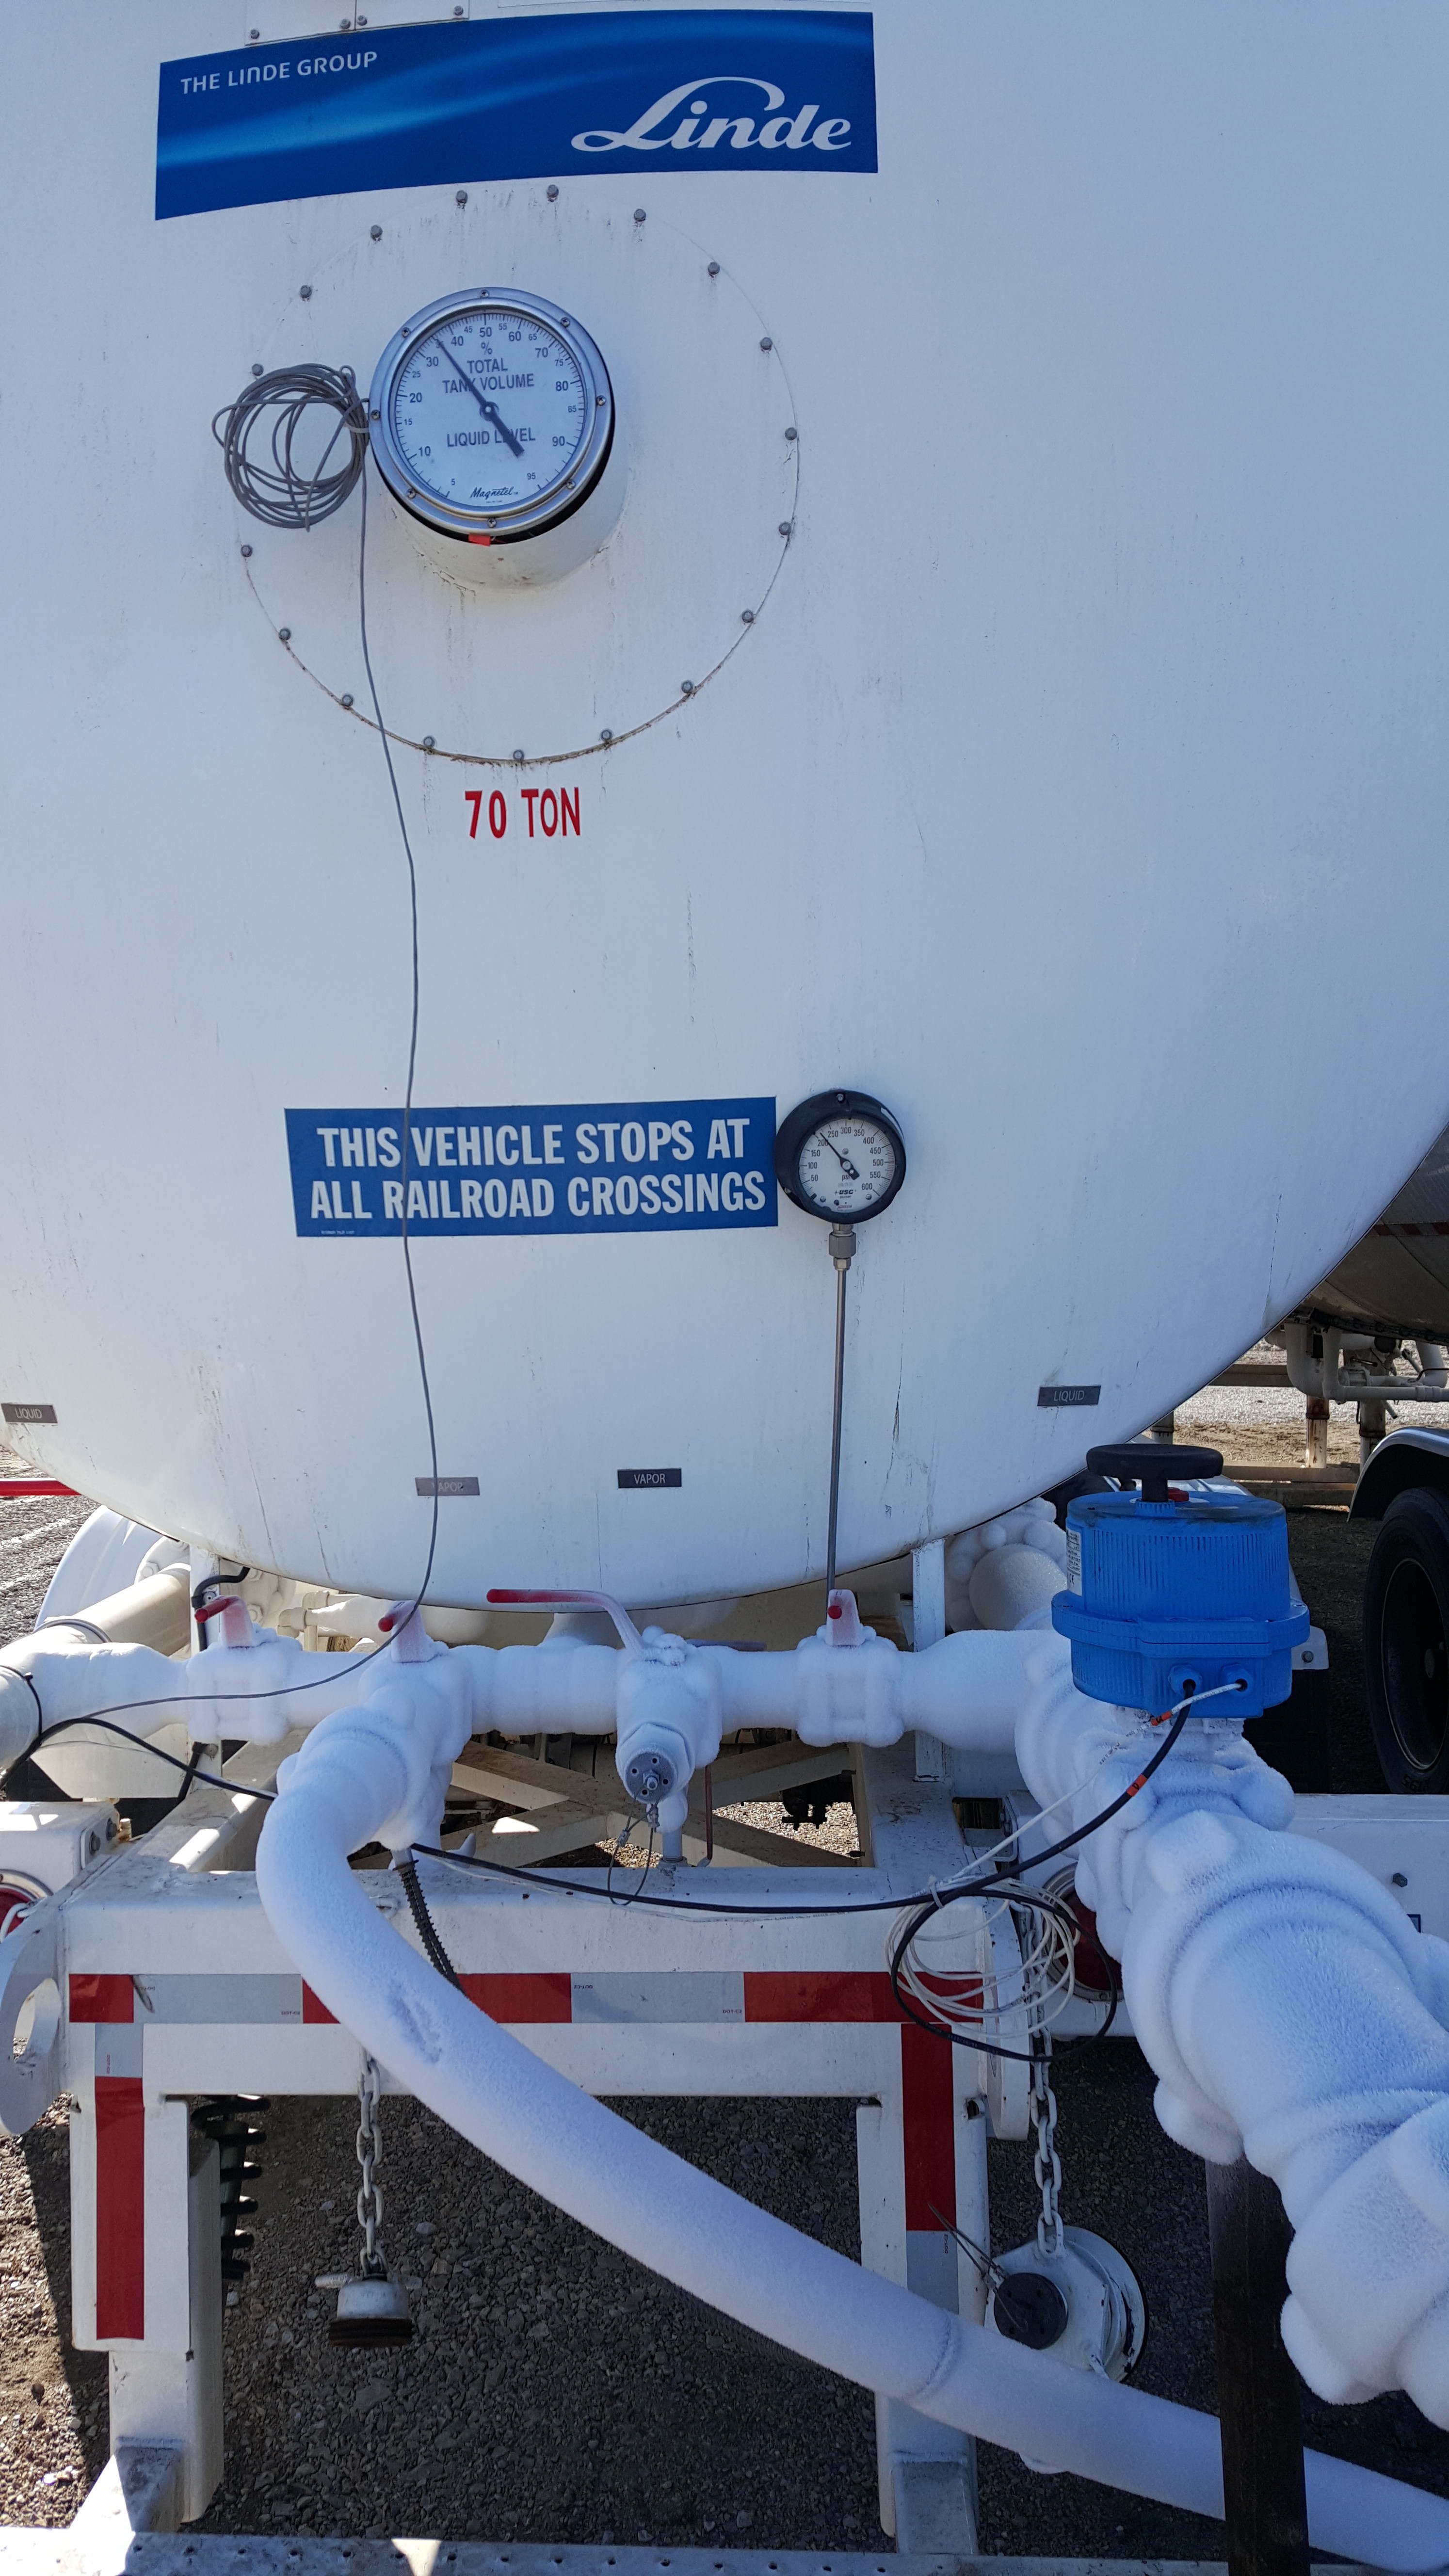
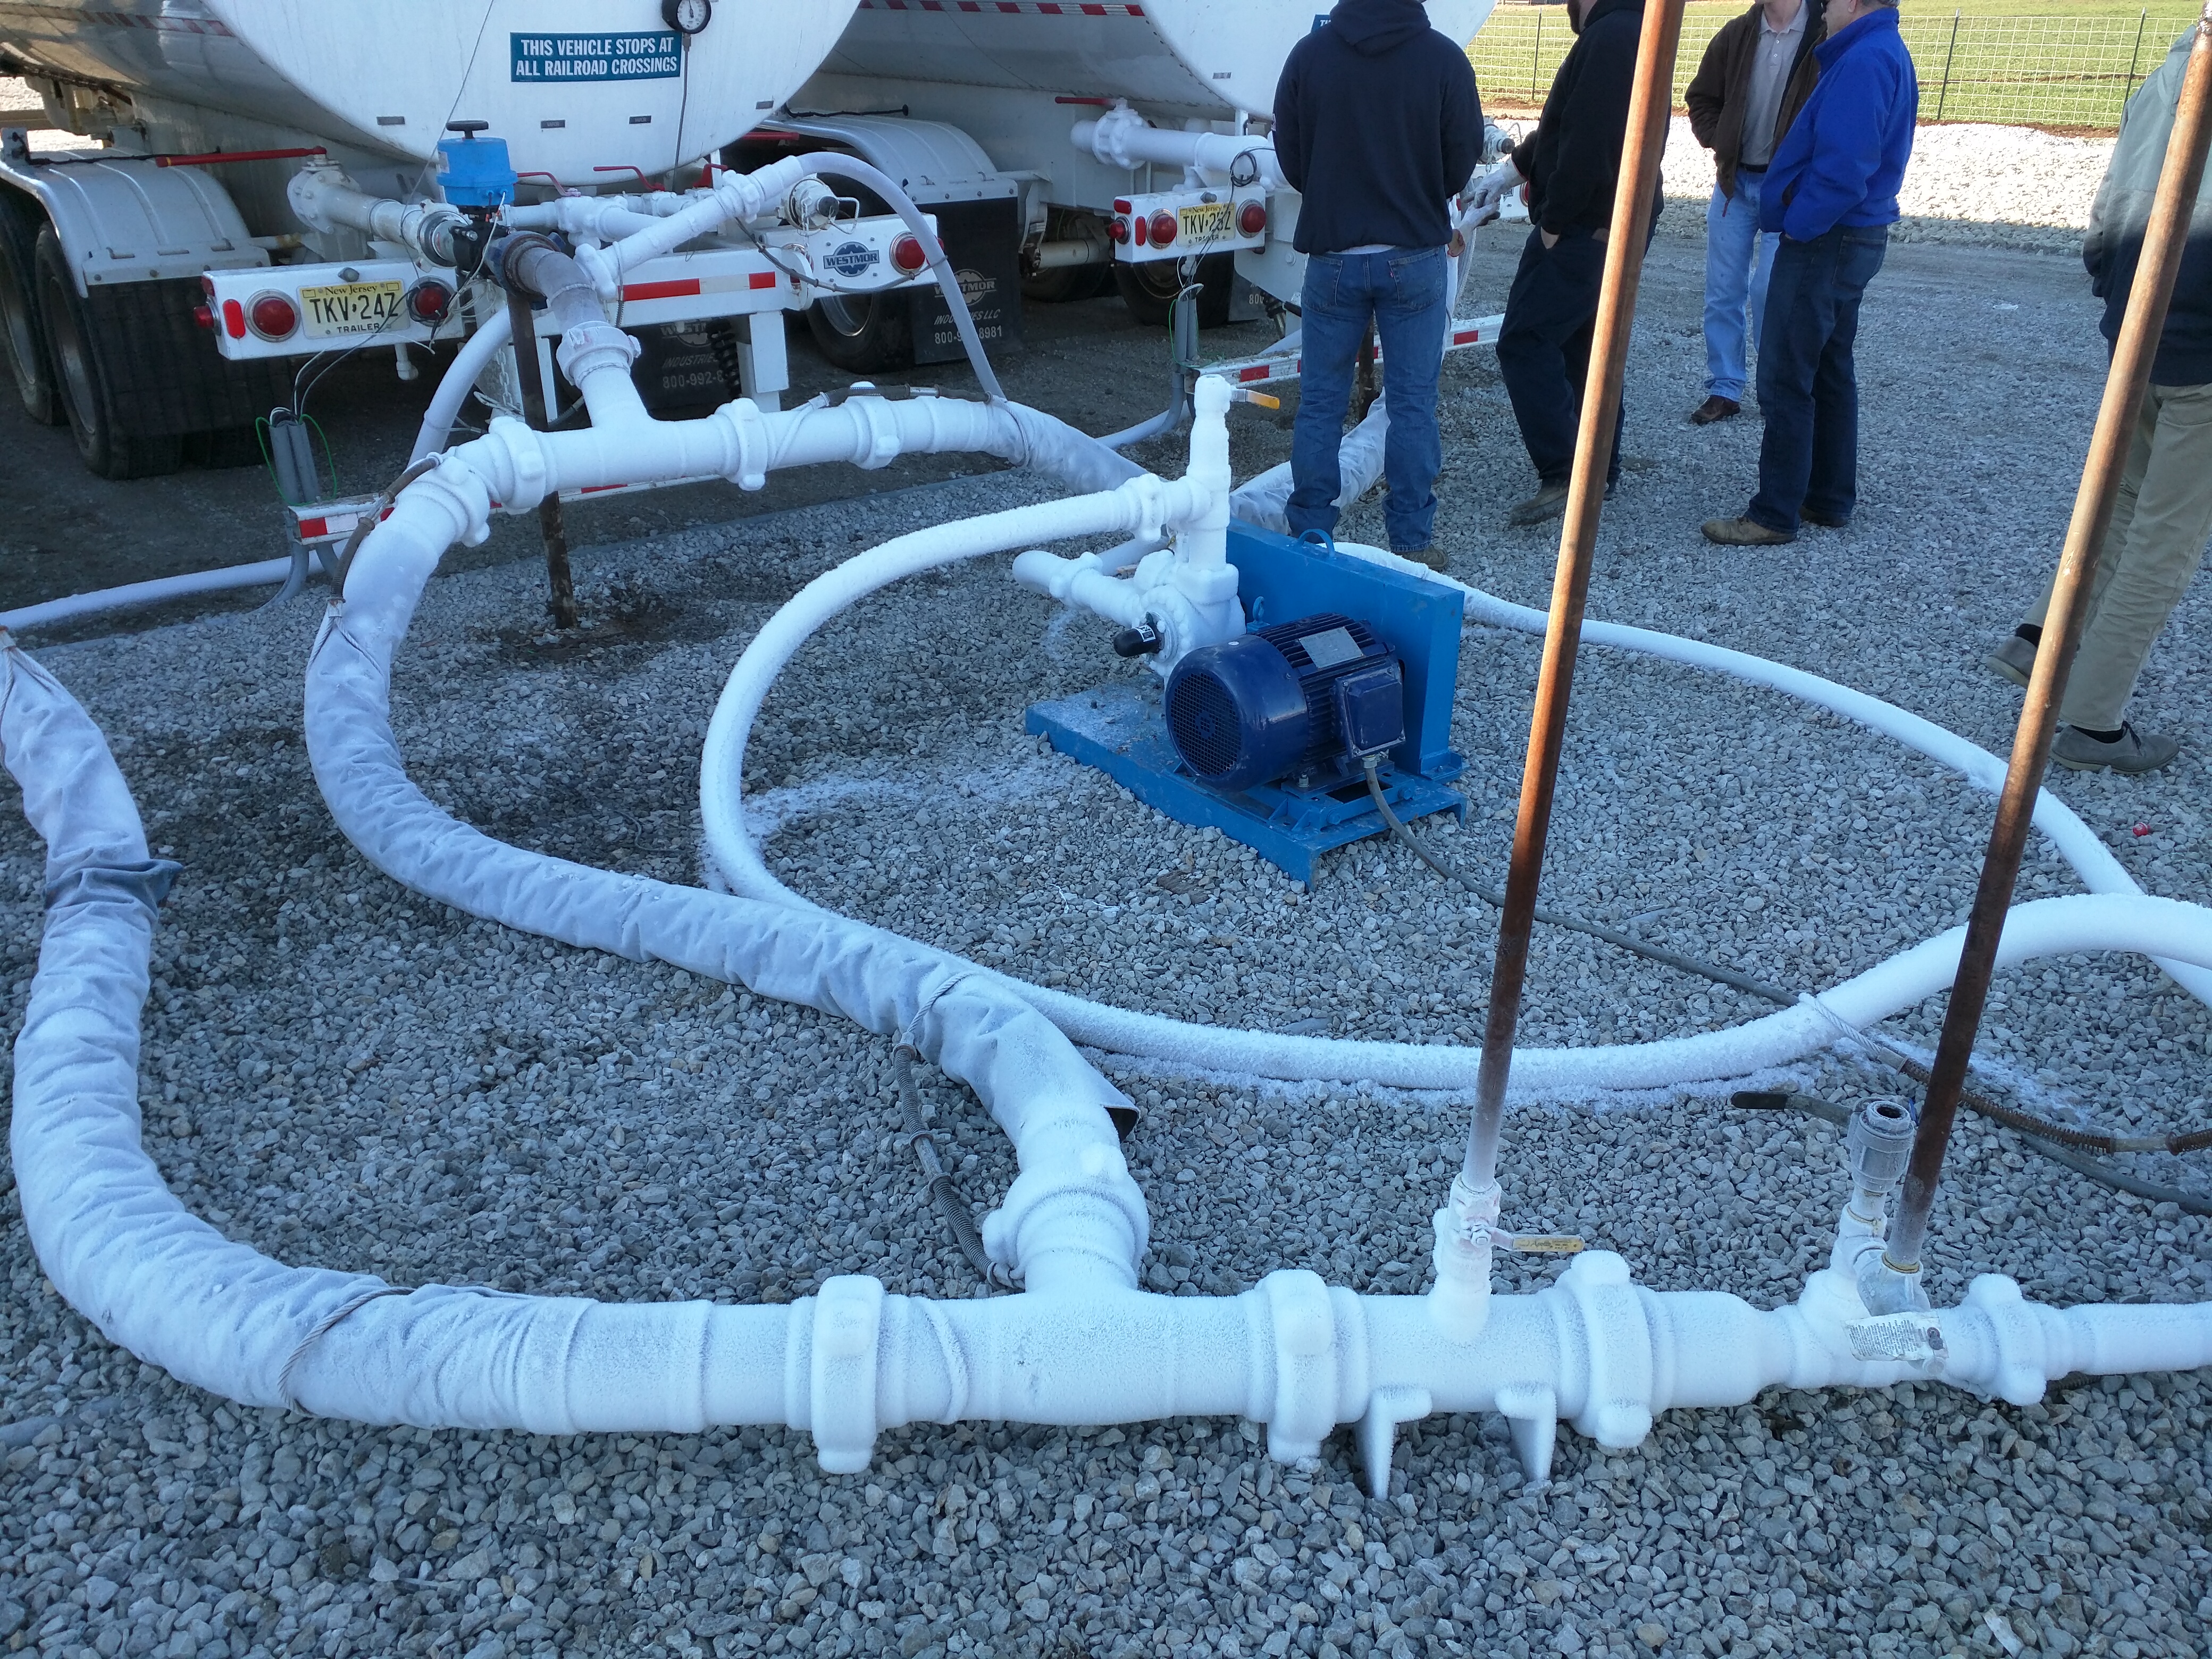
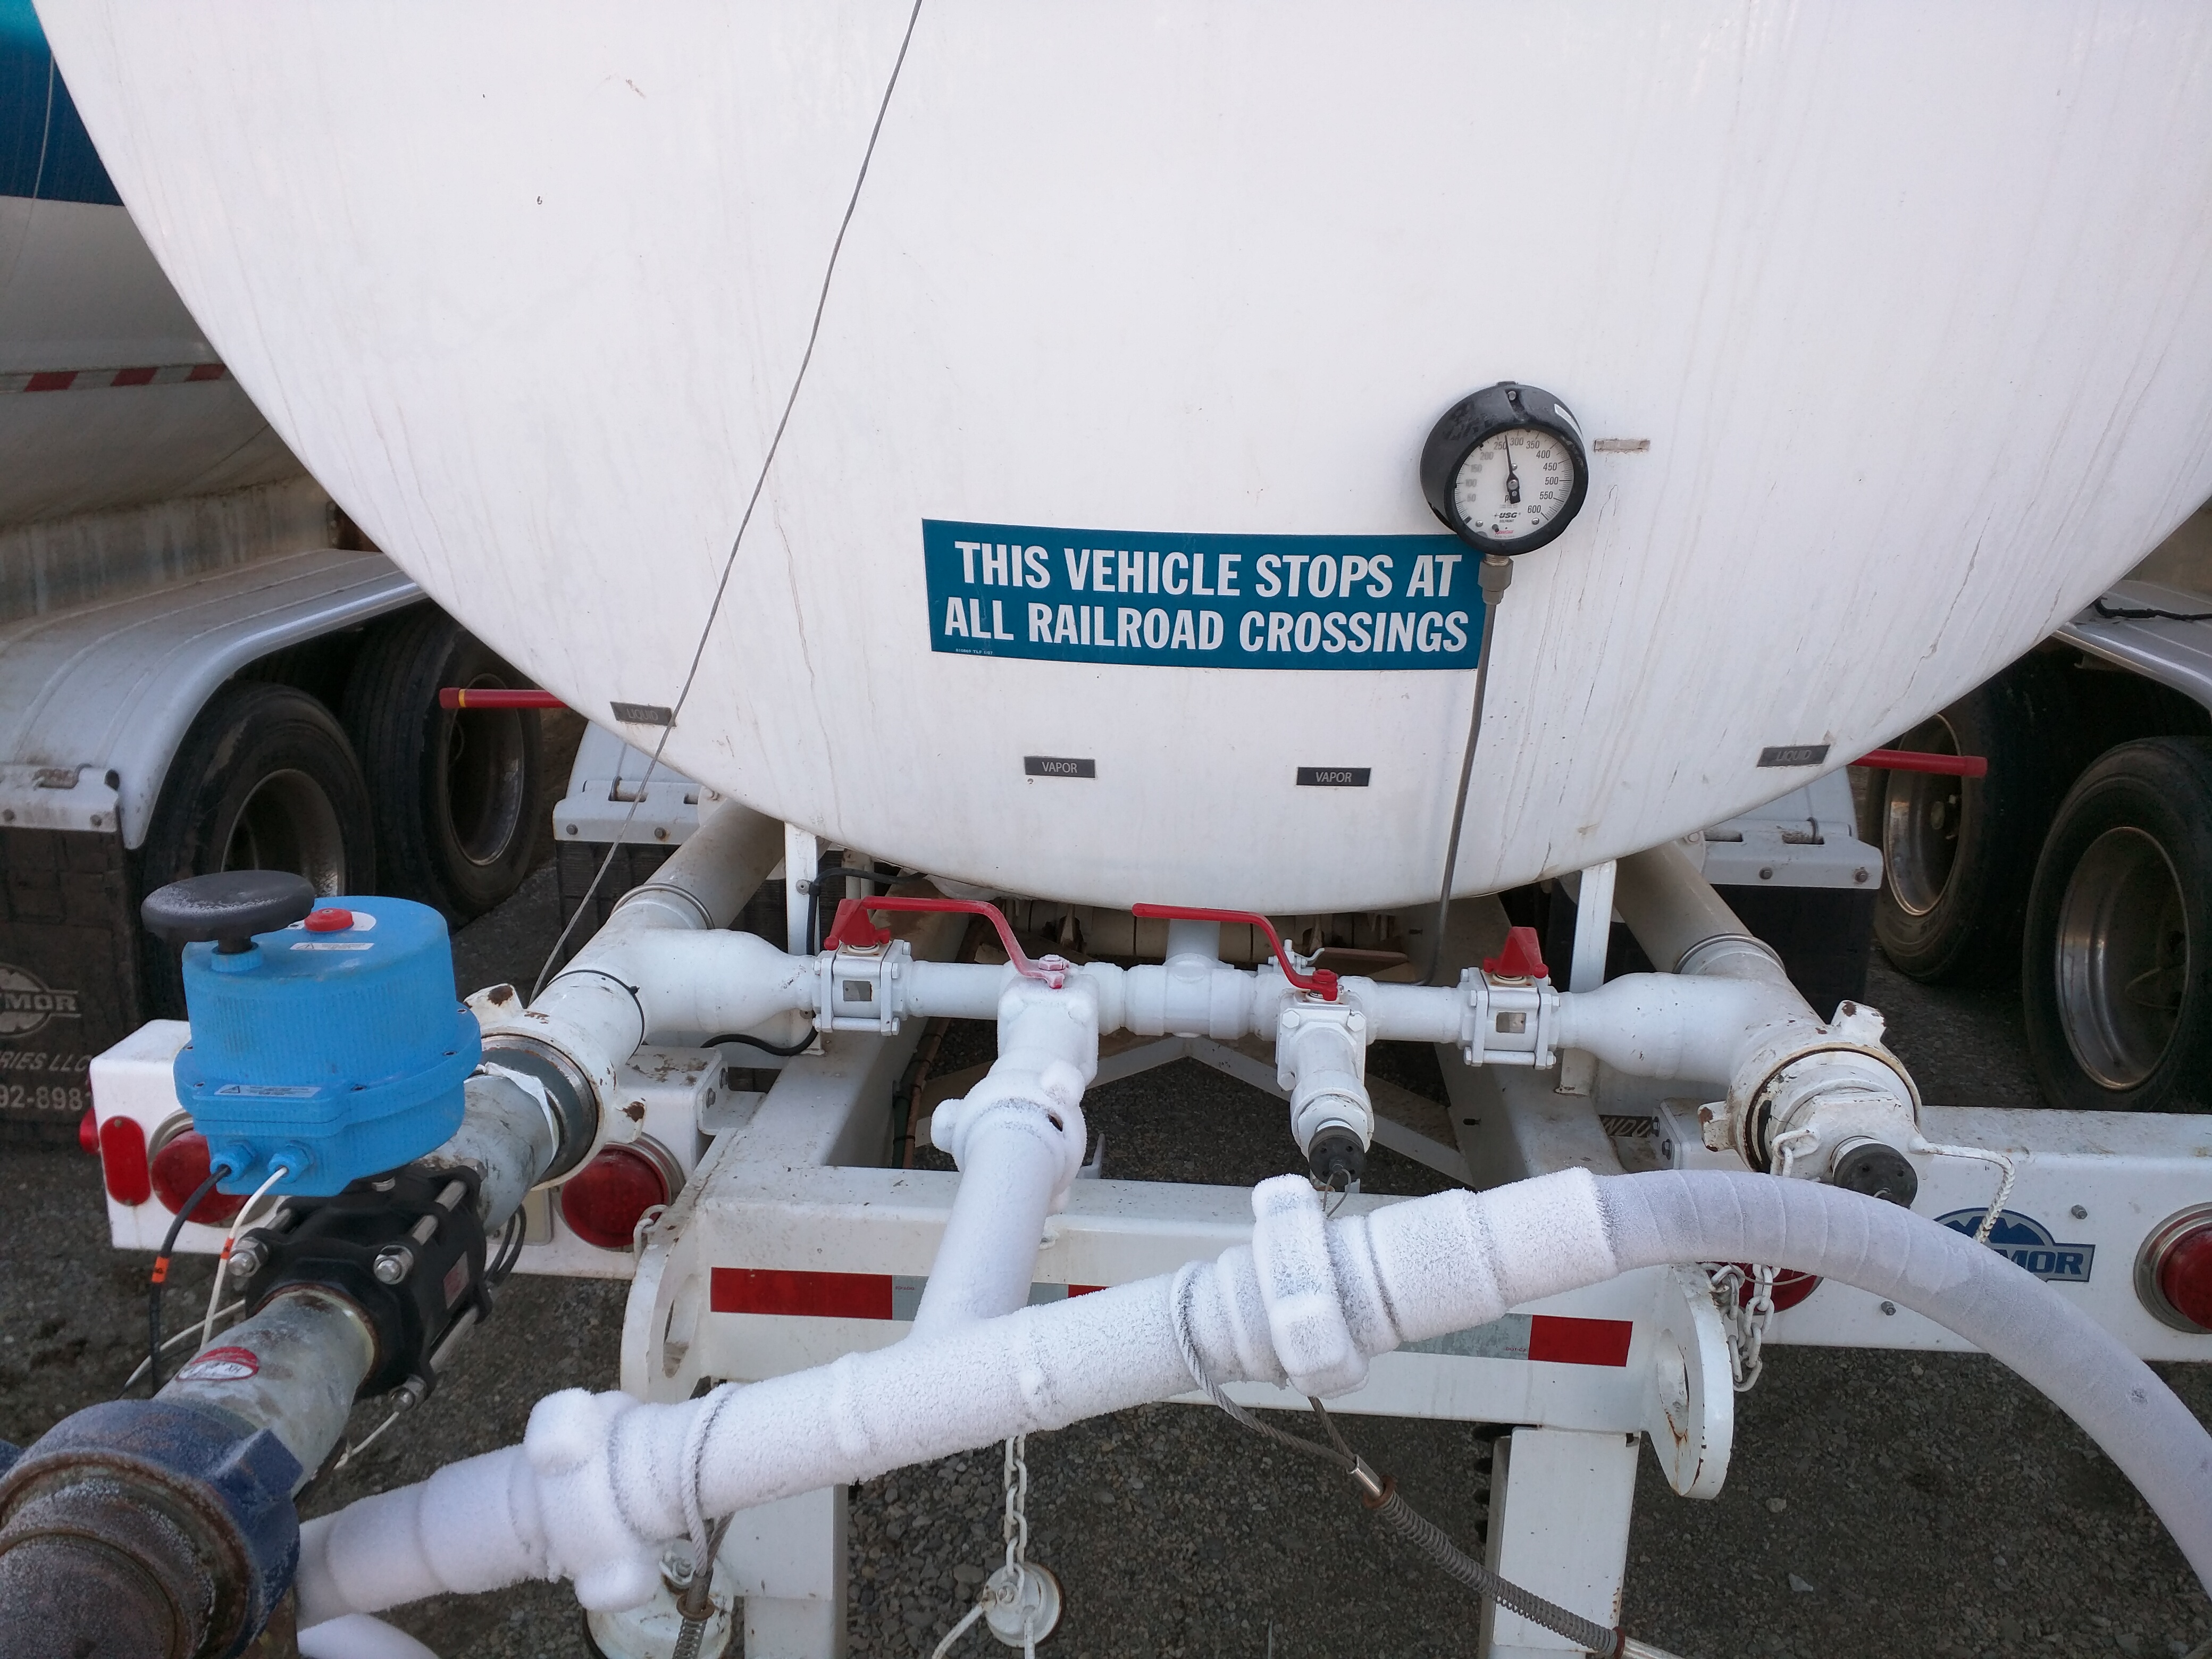
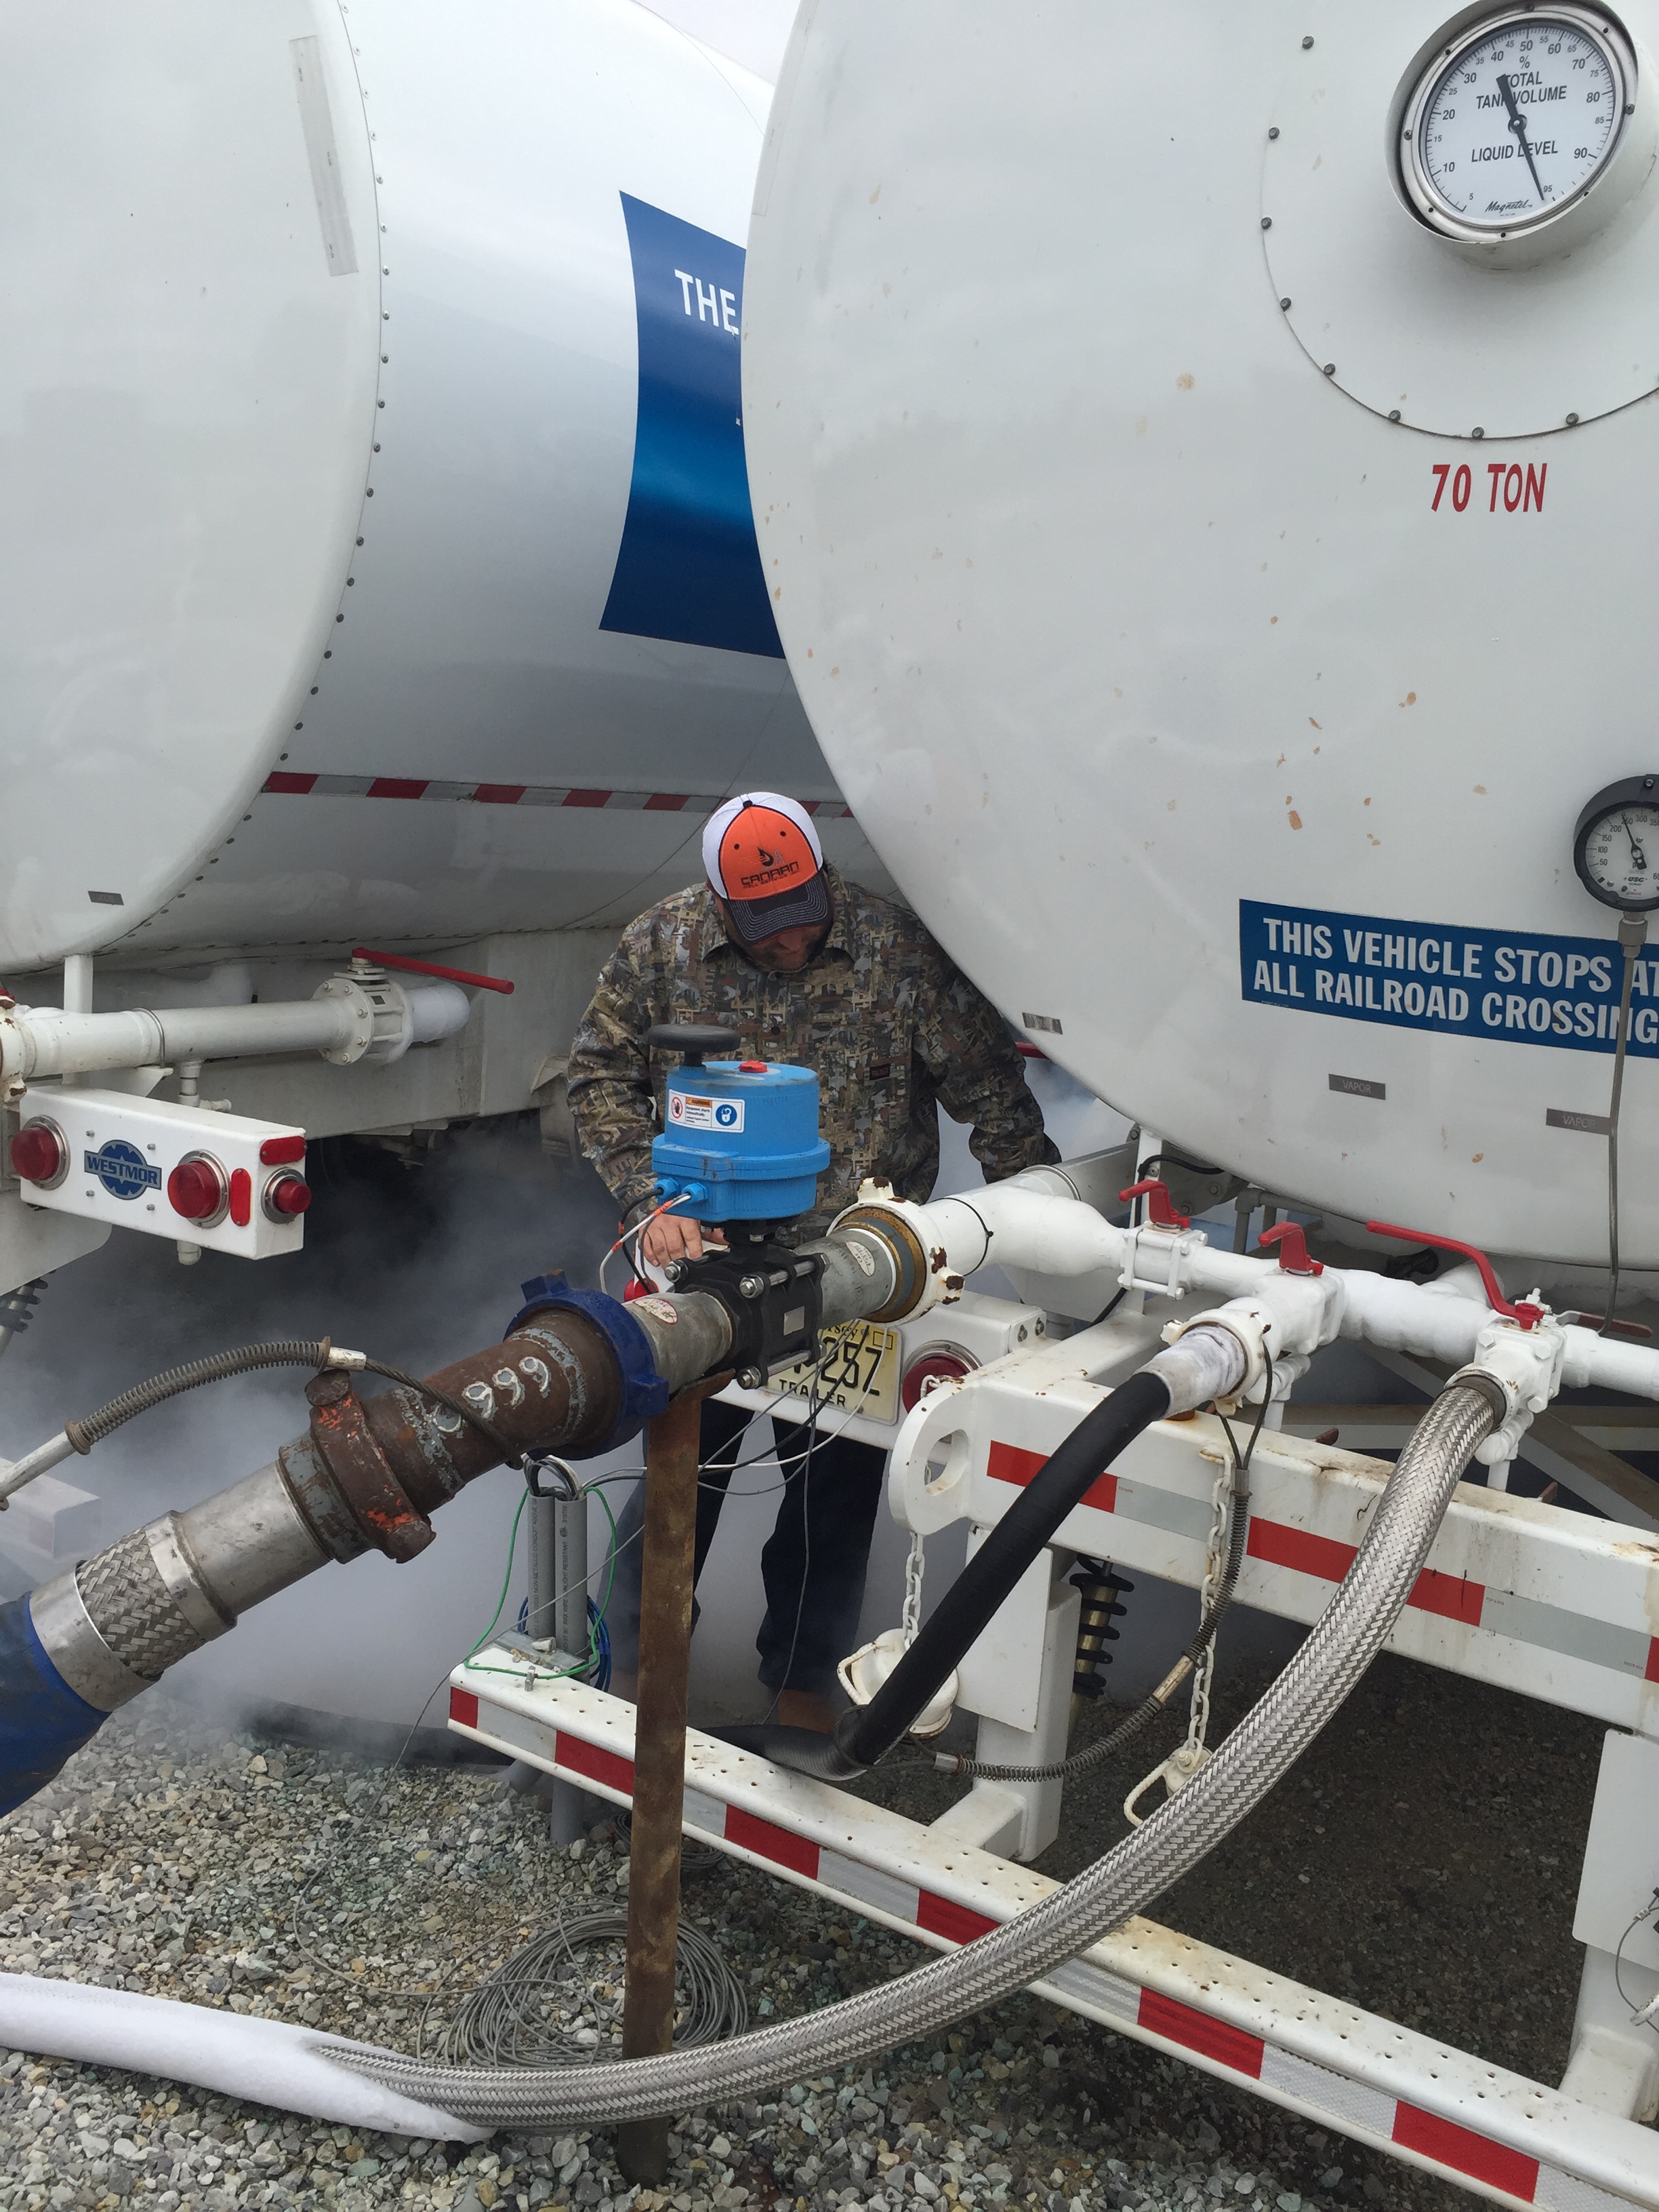
A demonstration to explain how a pressure buildup of gaseous CO2 can be vented from CO2 storage tank lines. Safety valves and emergency shutoff systems are in place throughout the entire series of lines.

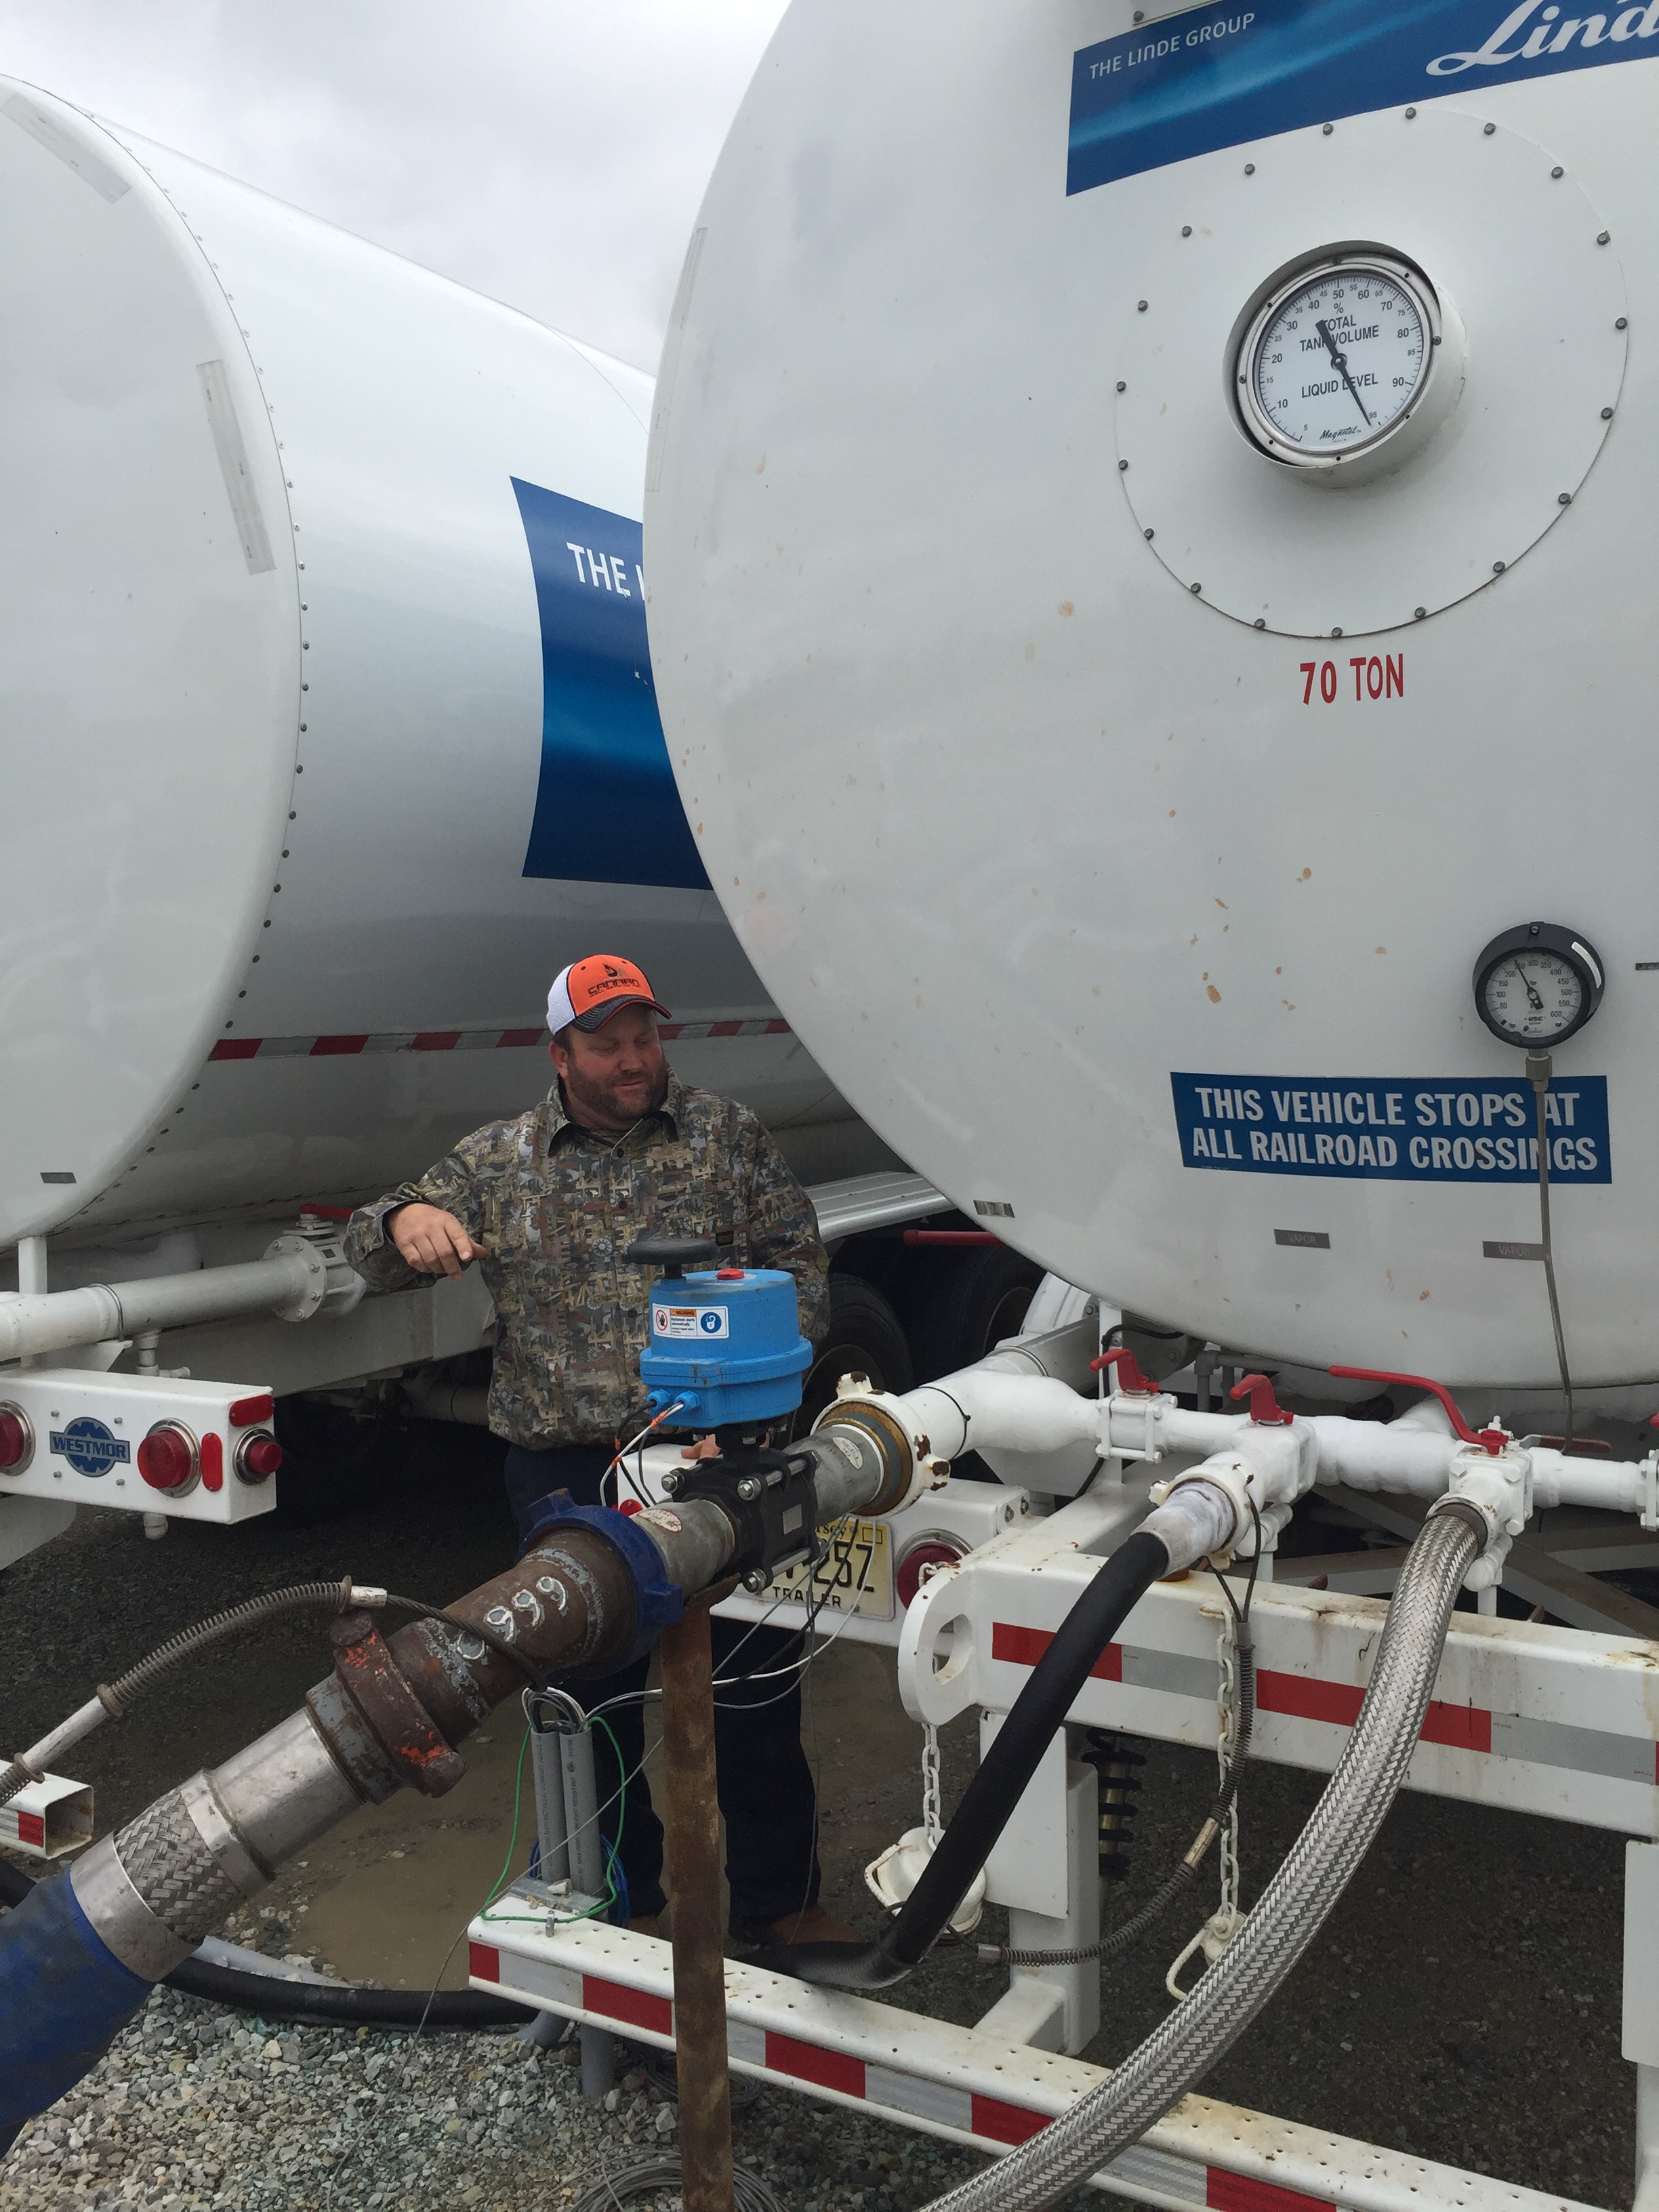
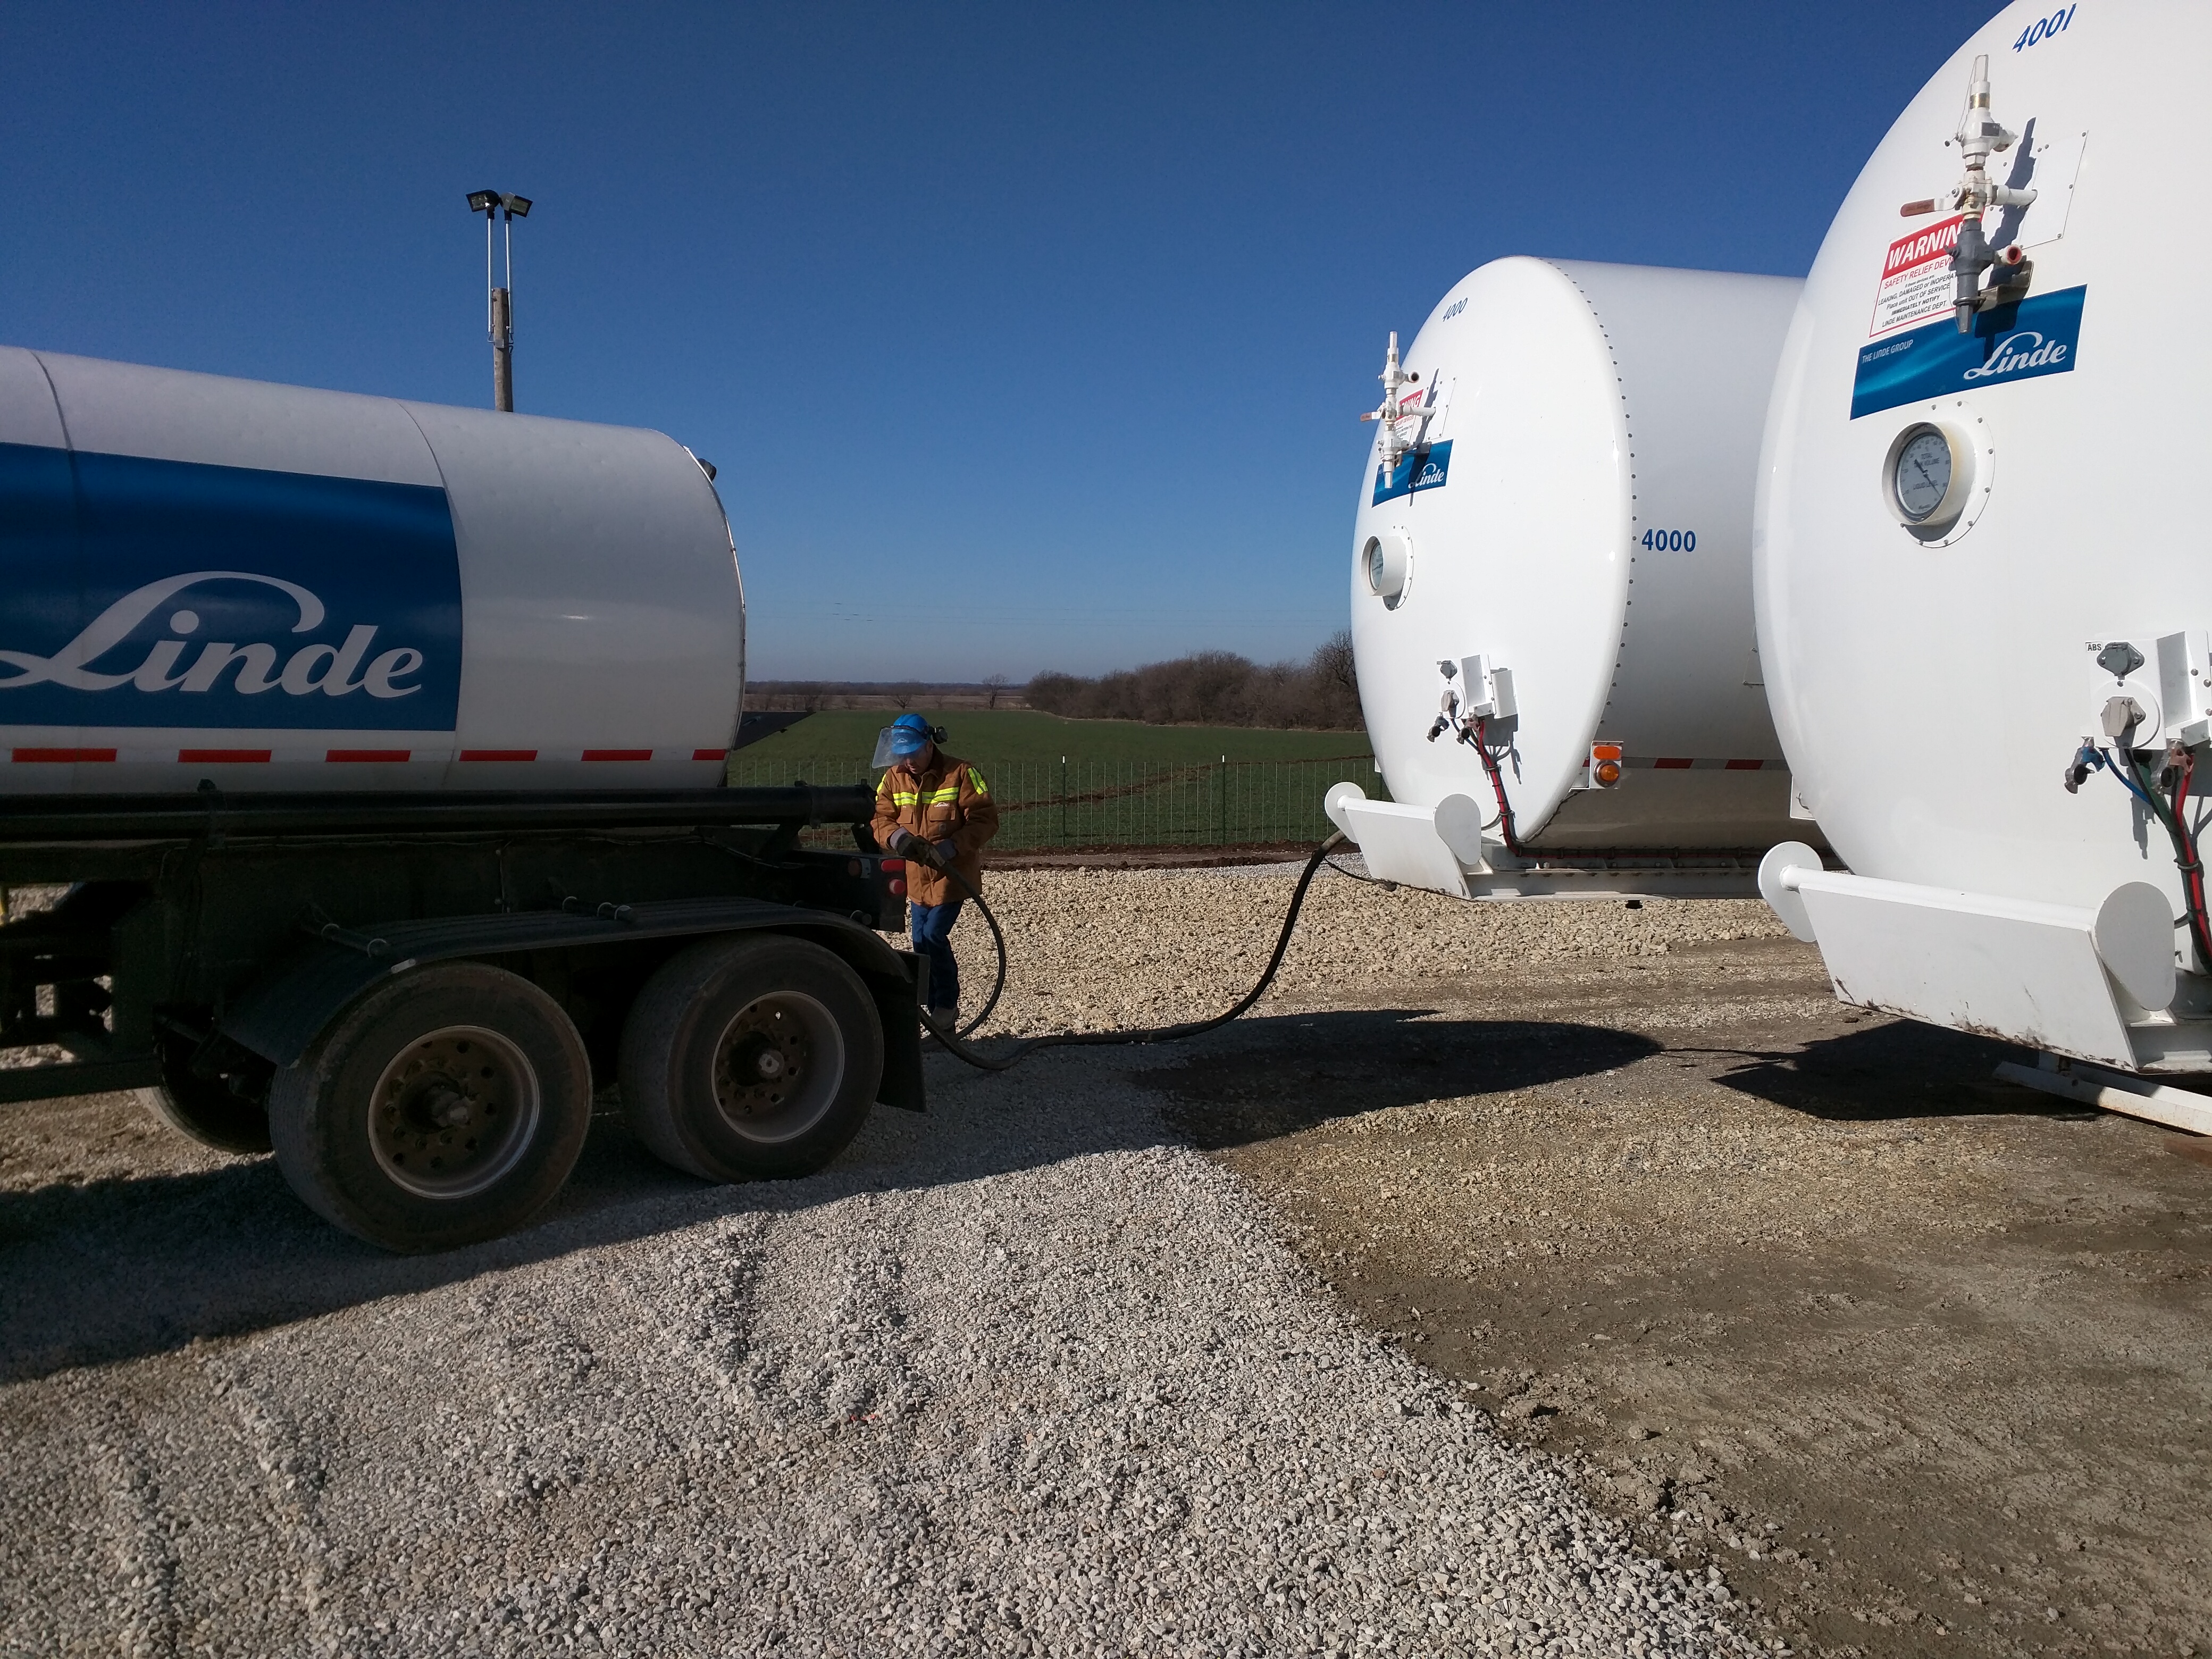
Jason begins venting gaseous CO2 trapped within storage tank lines from one of the available devices.

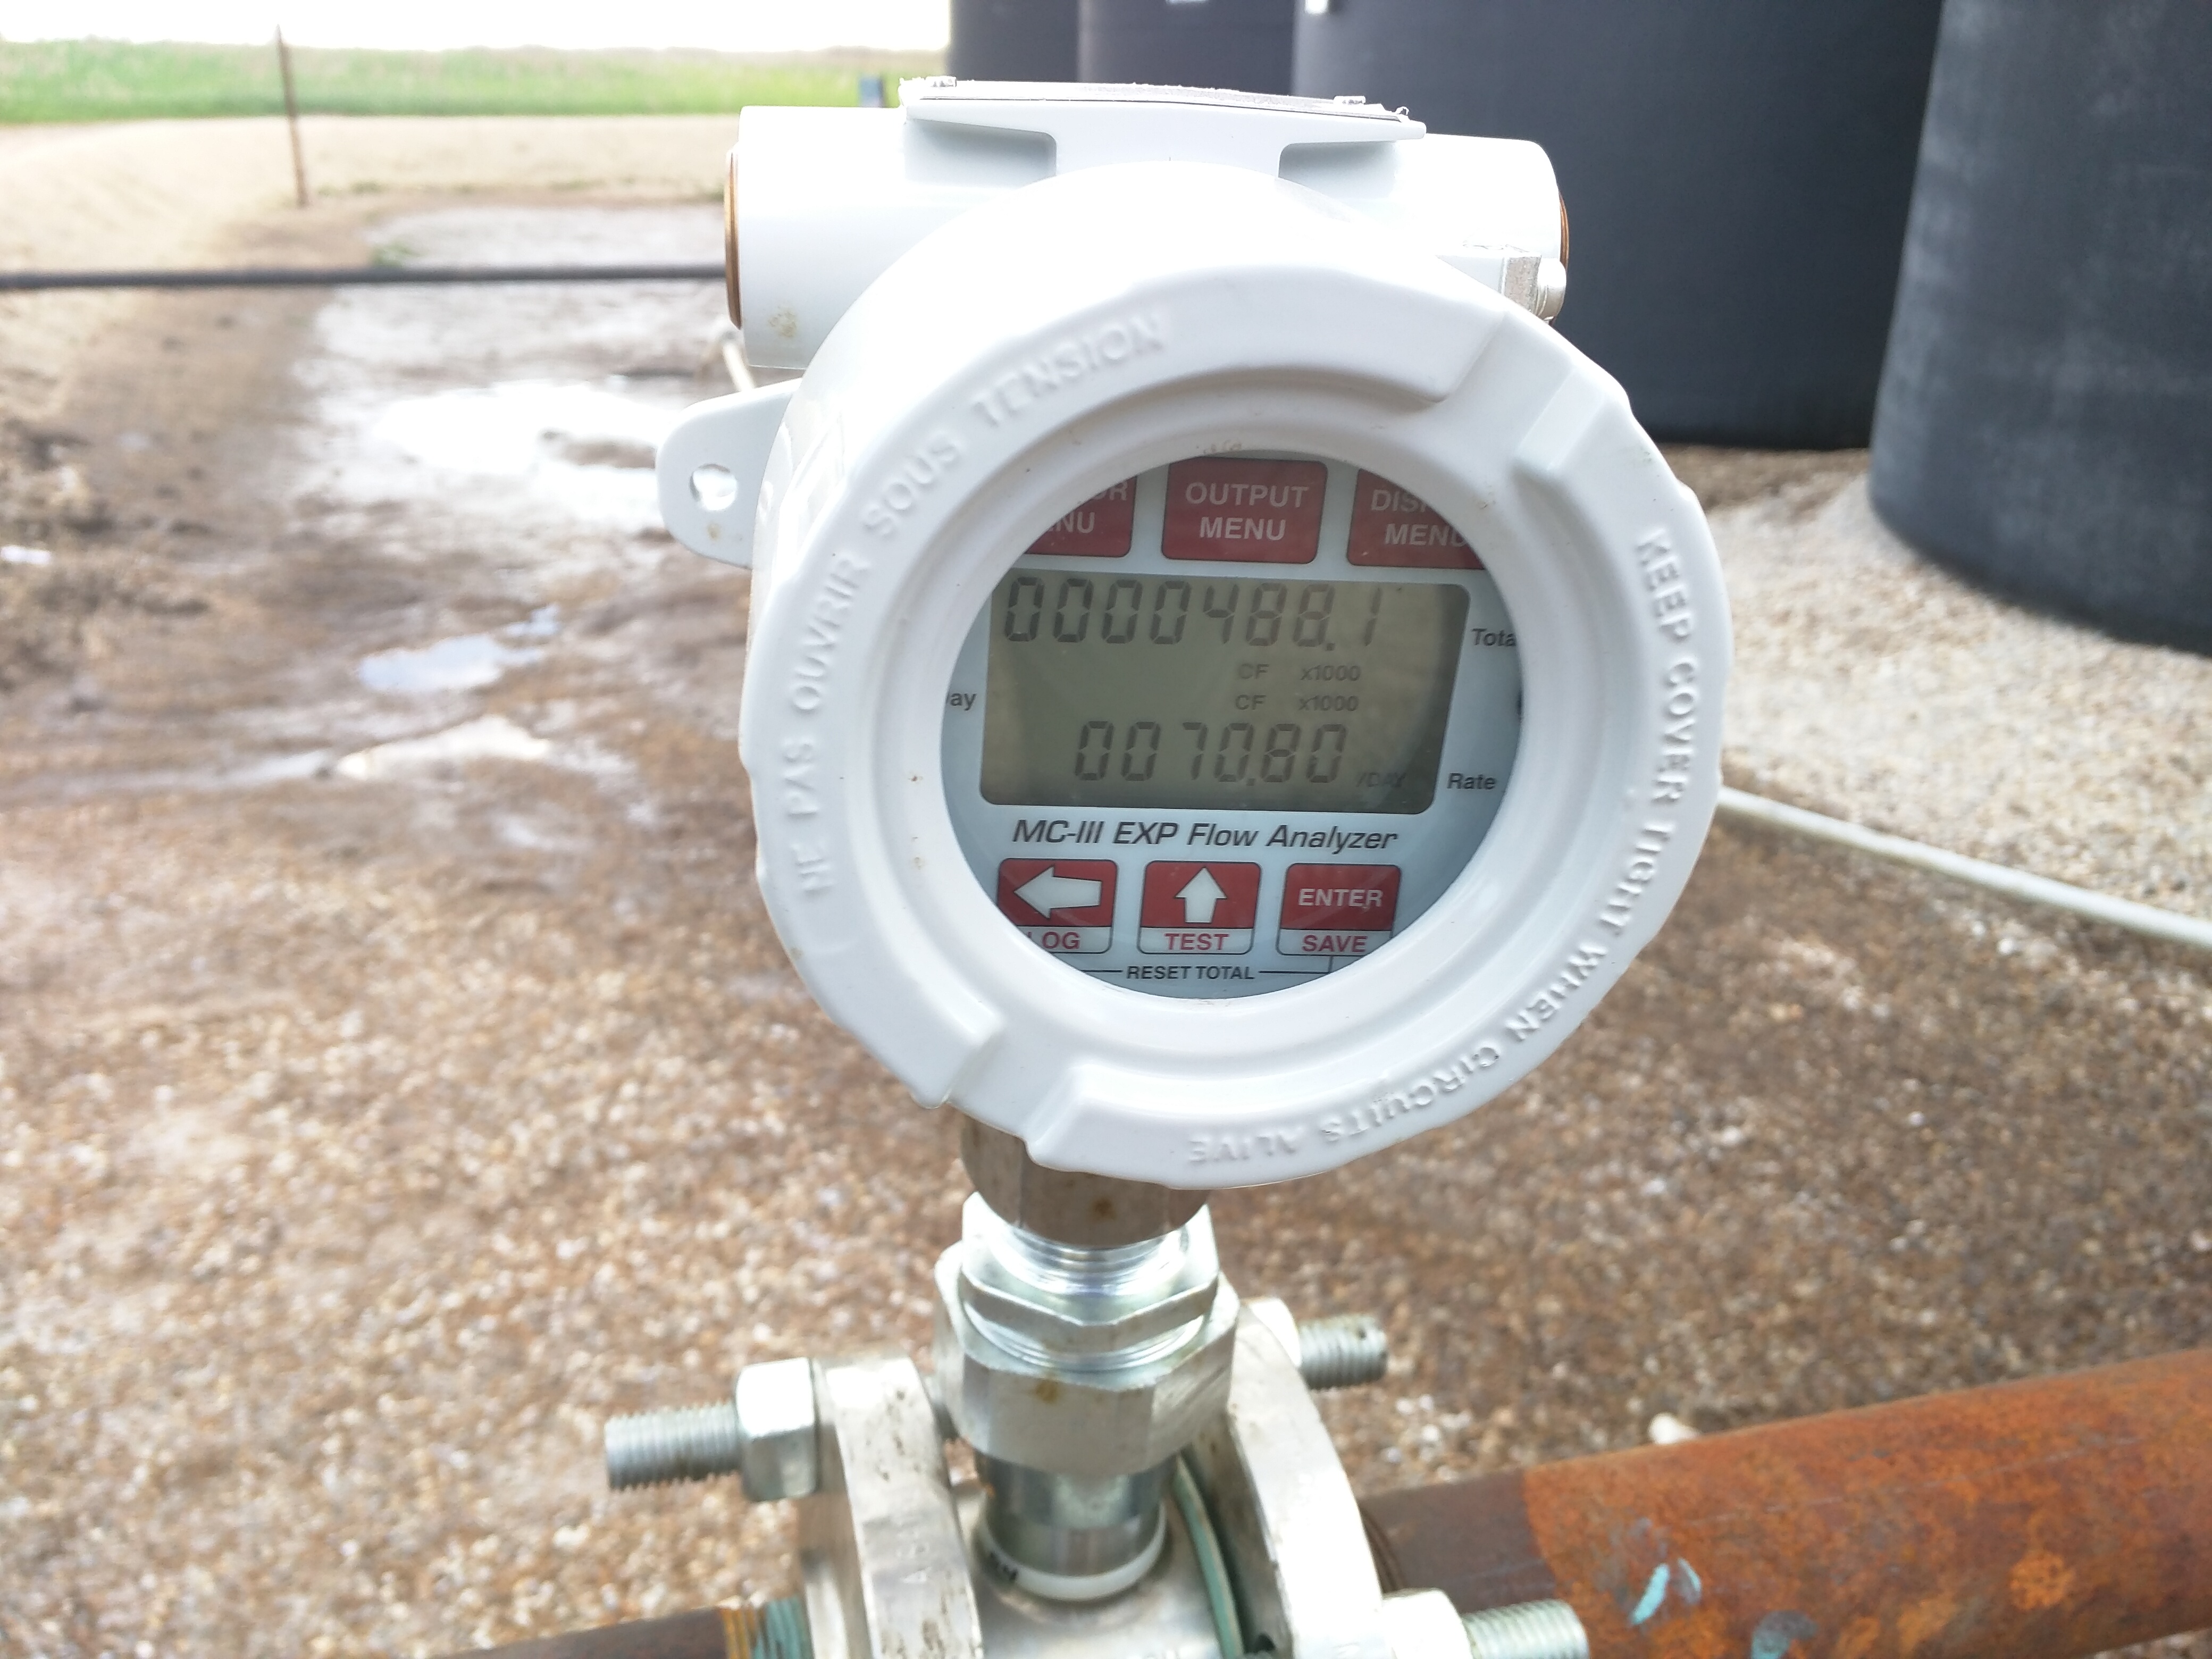
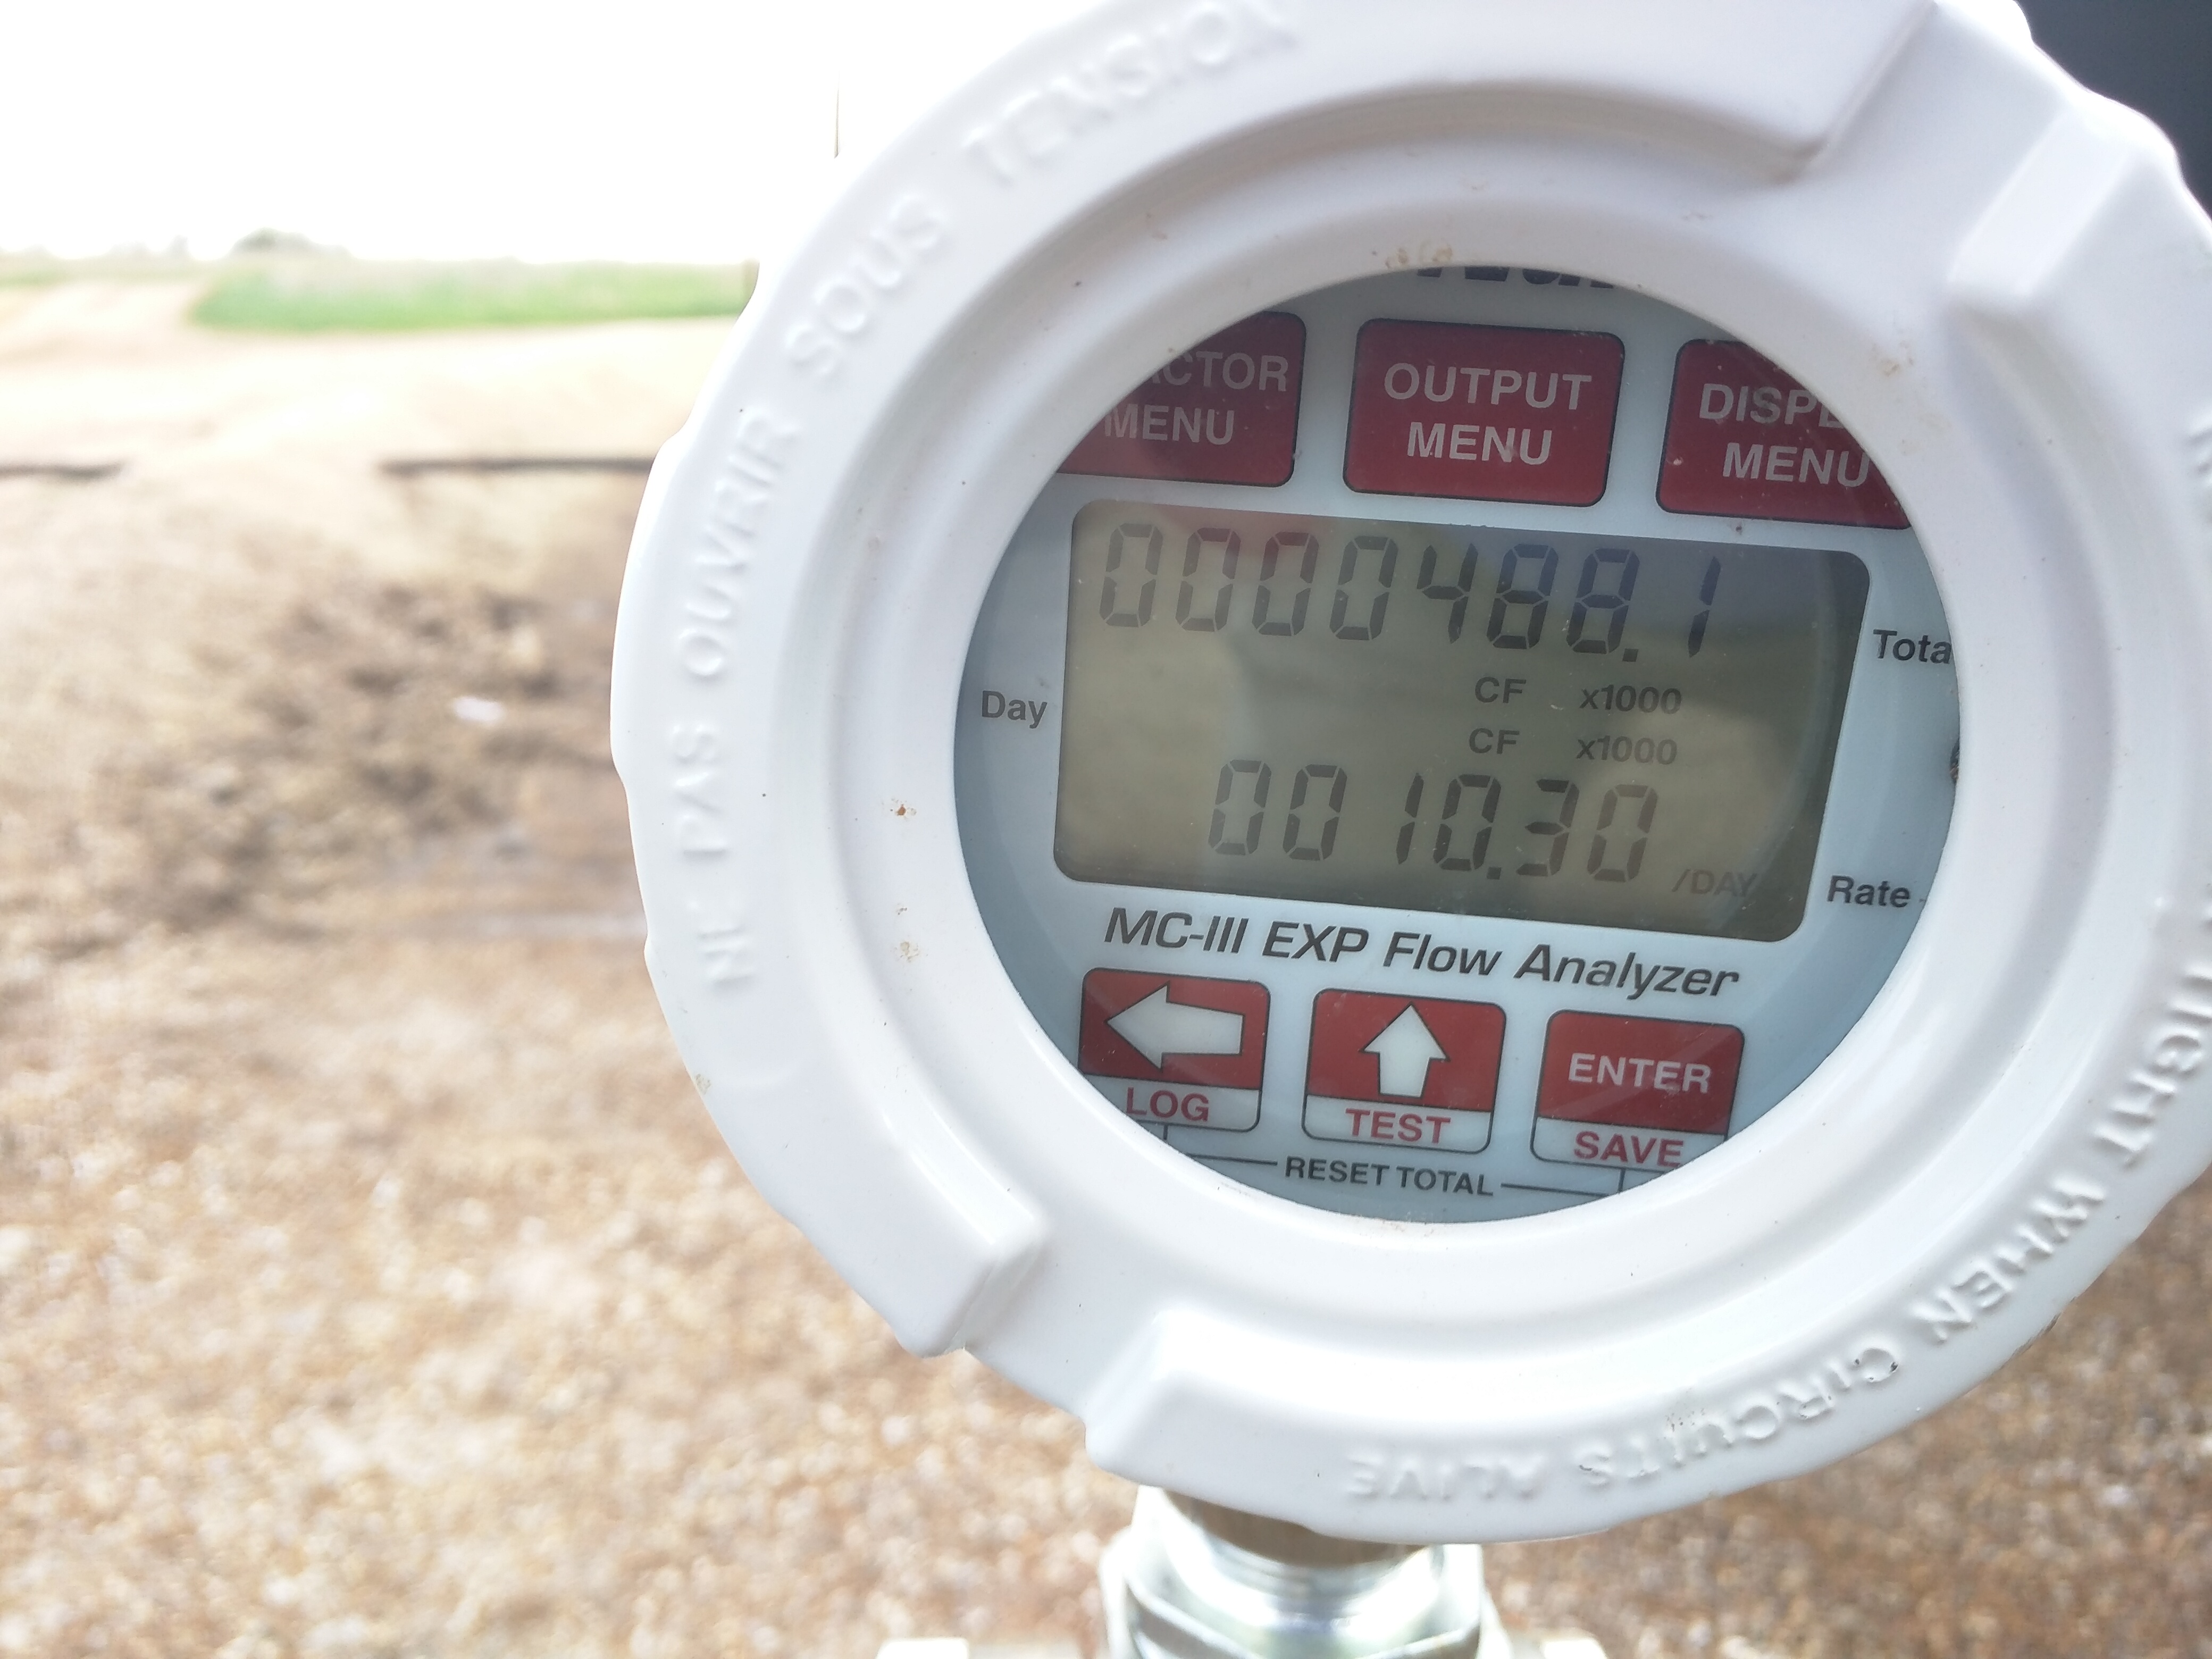
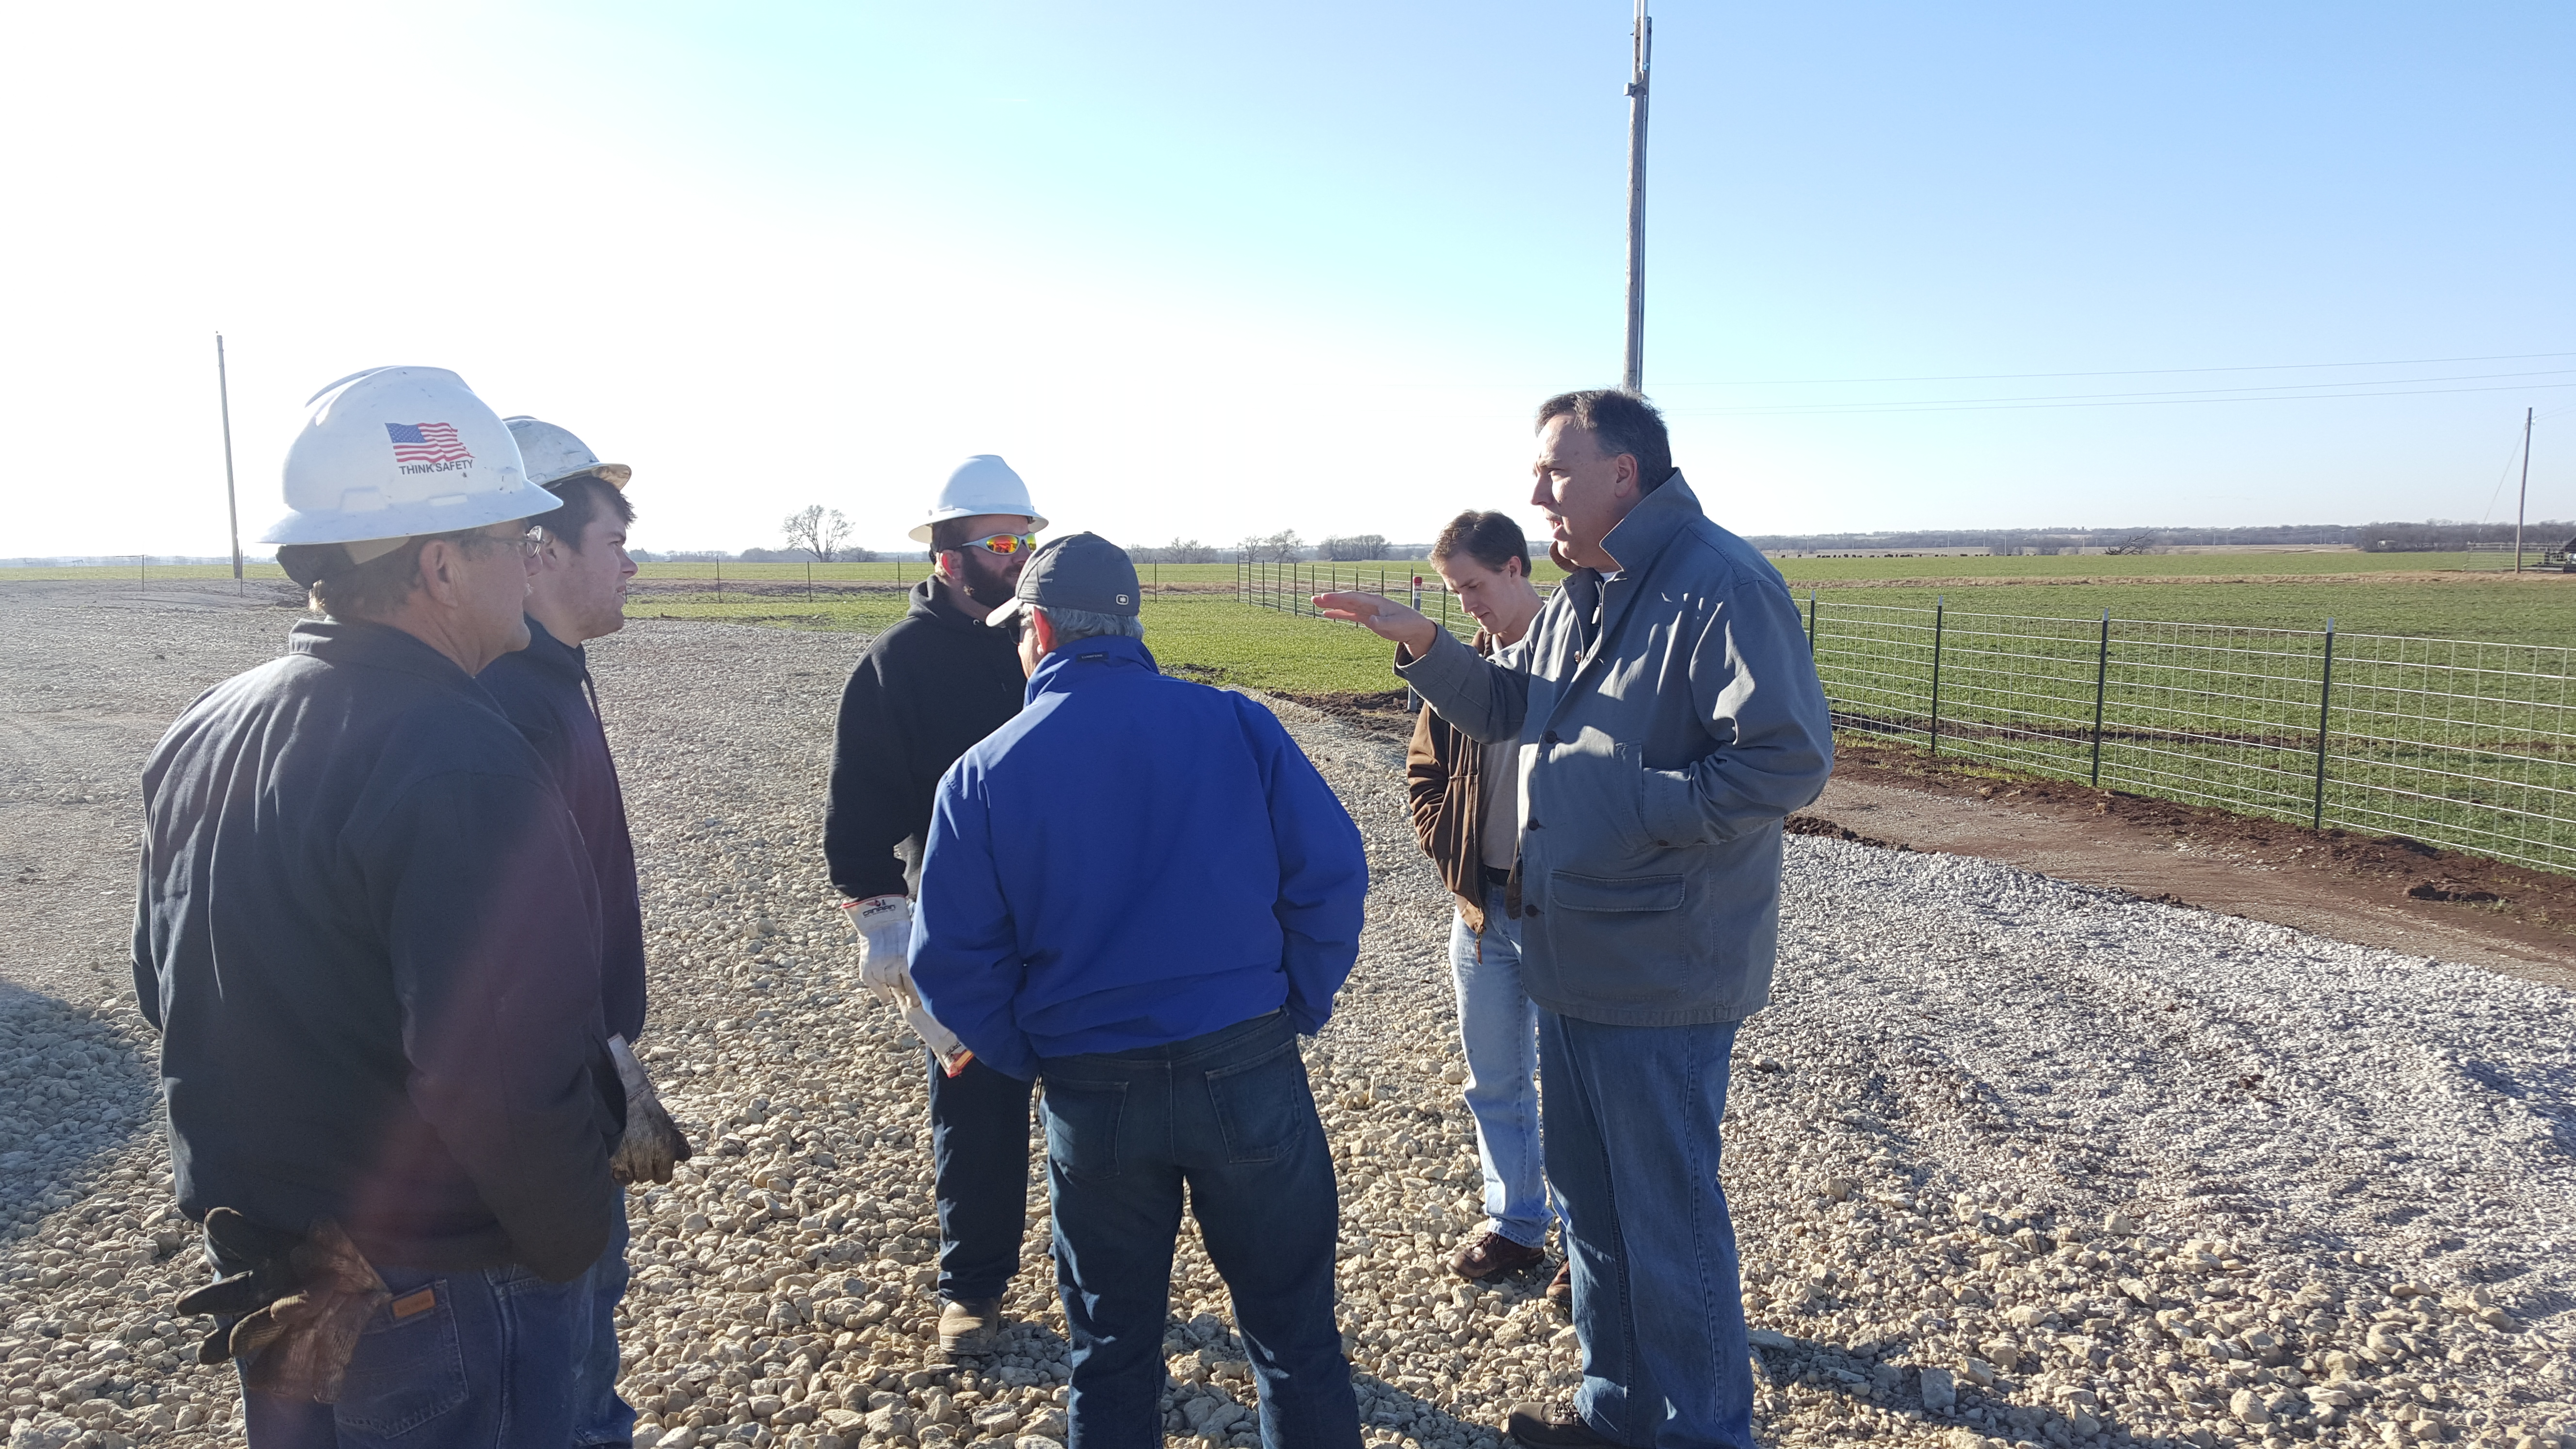
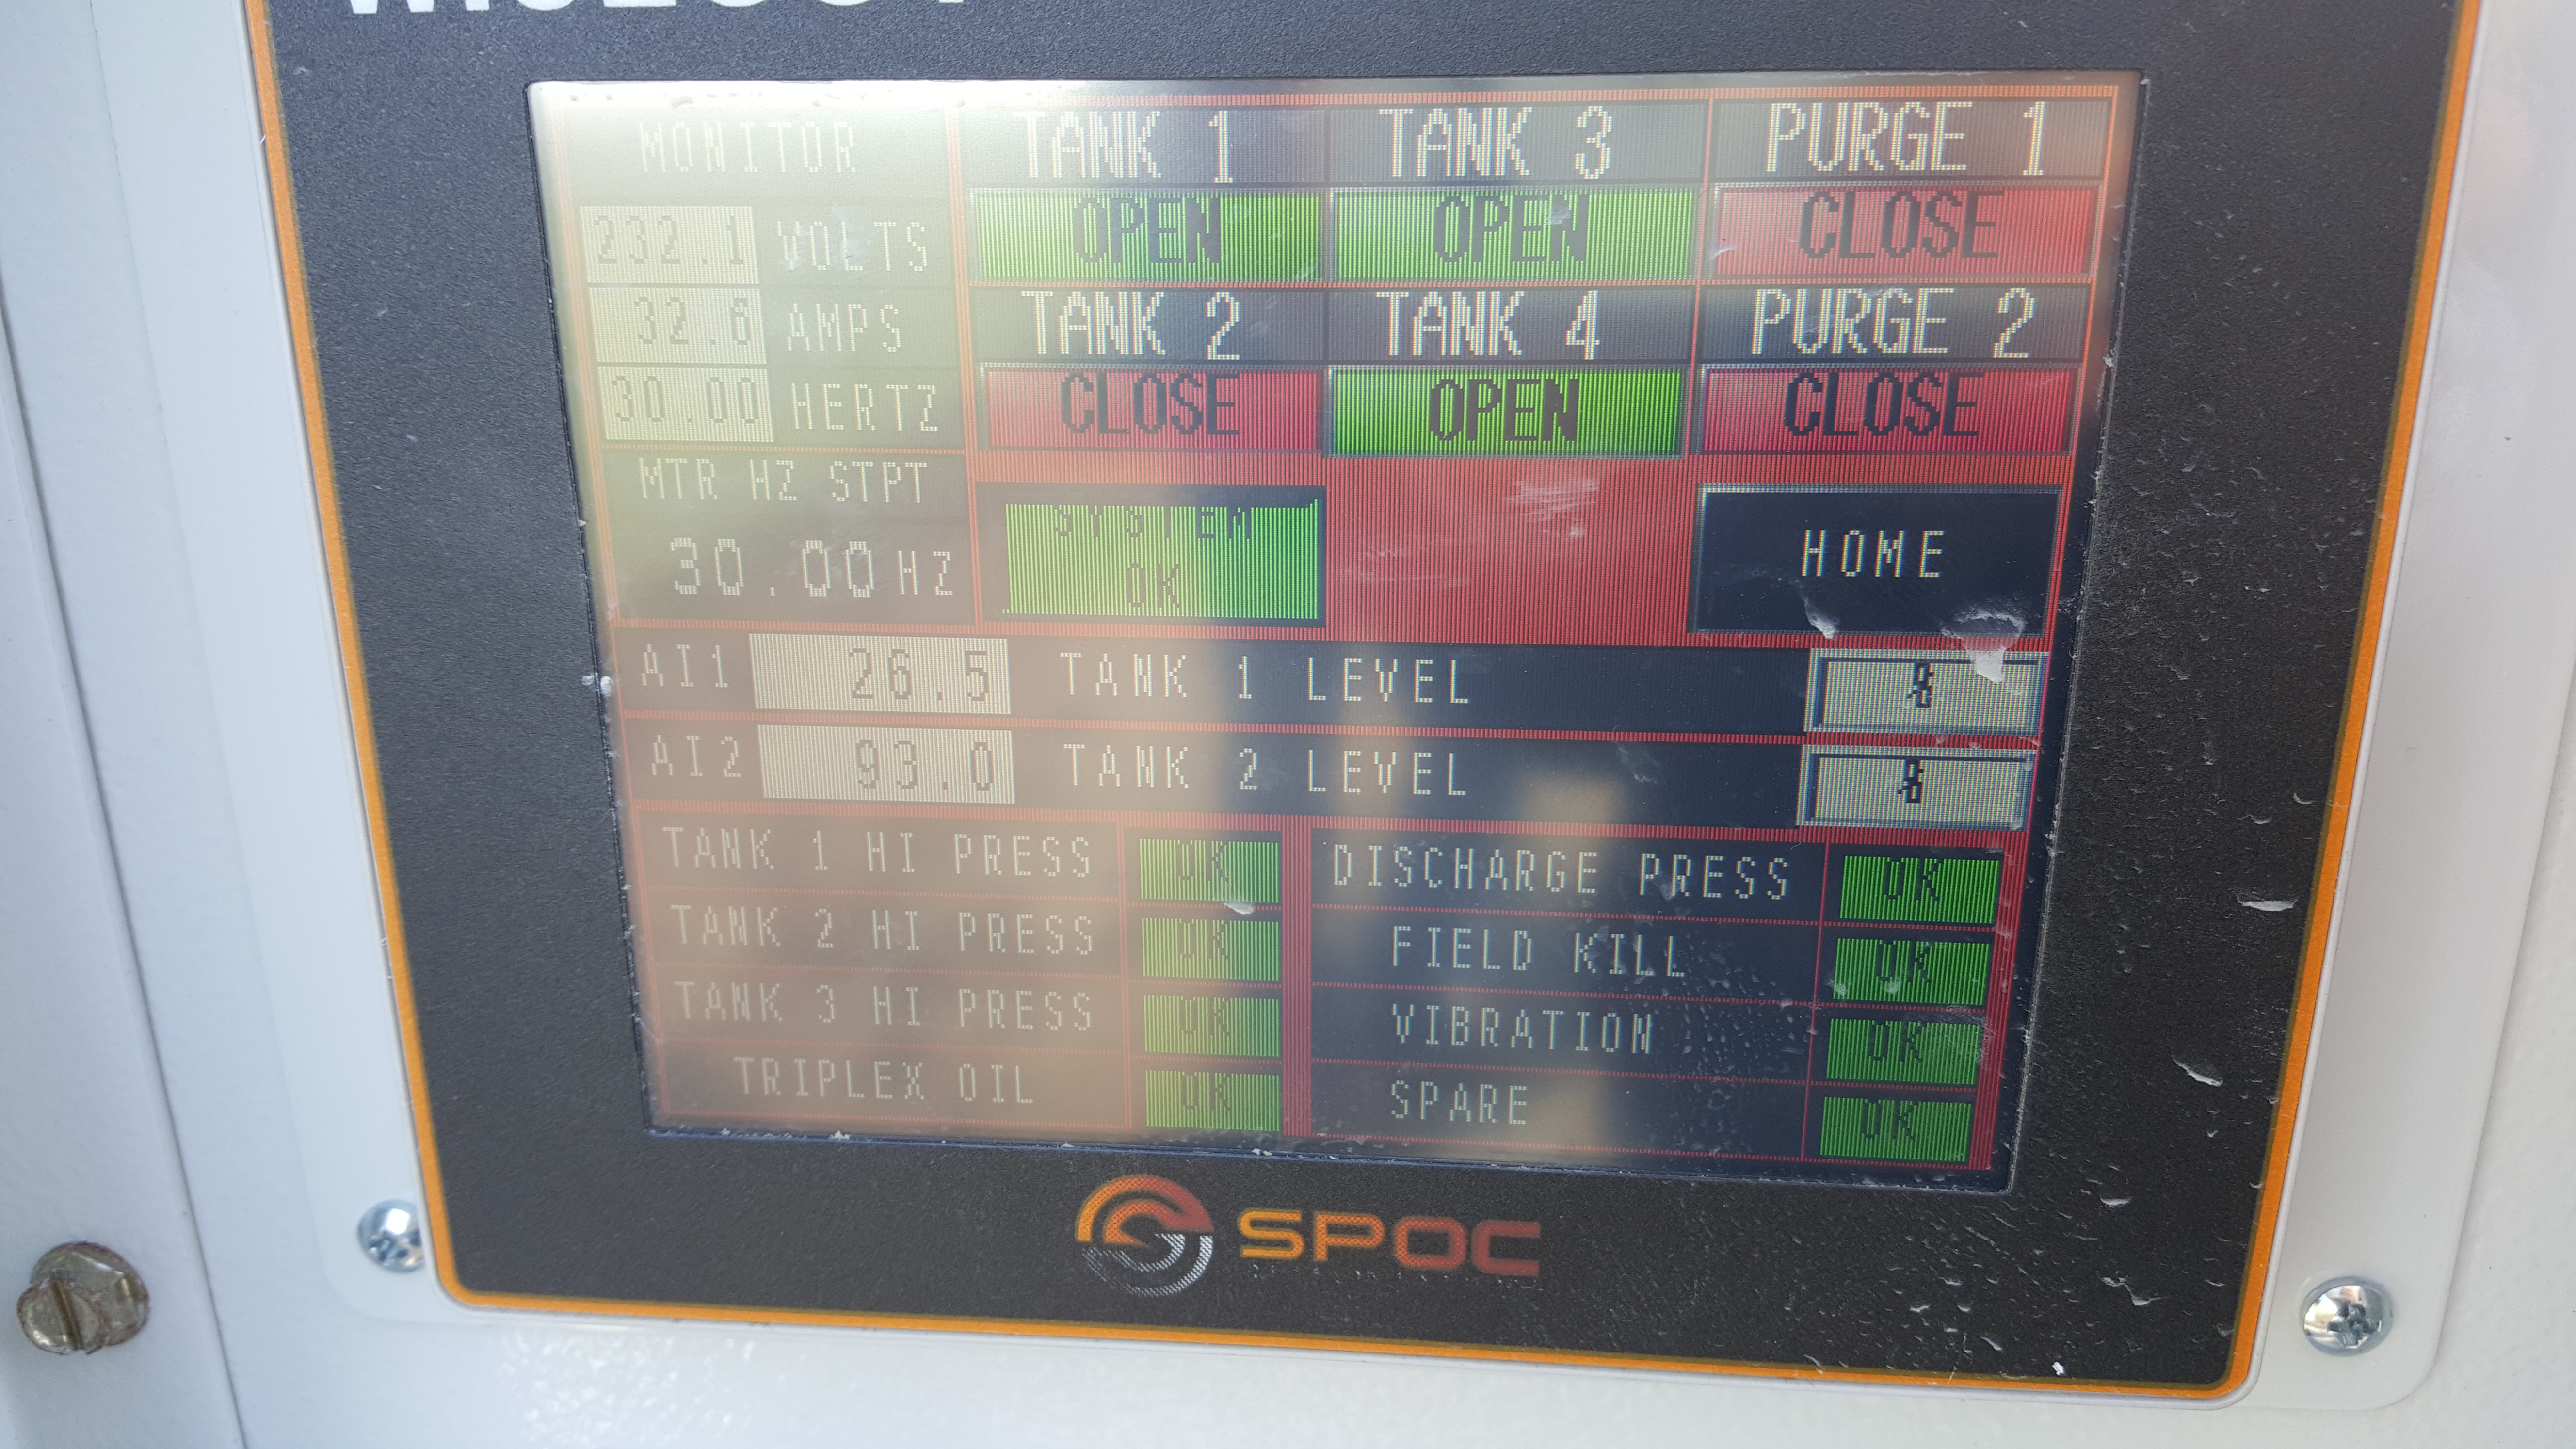
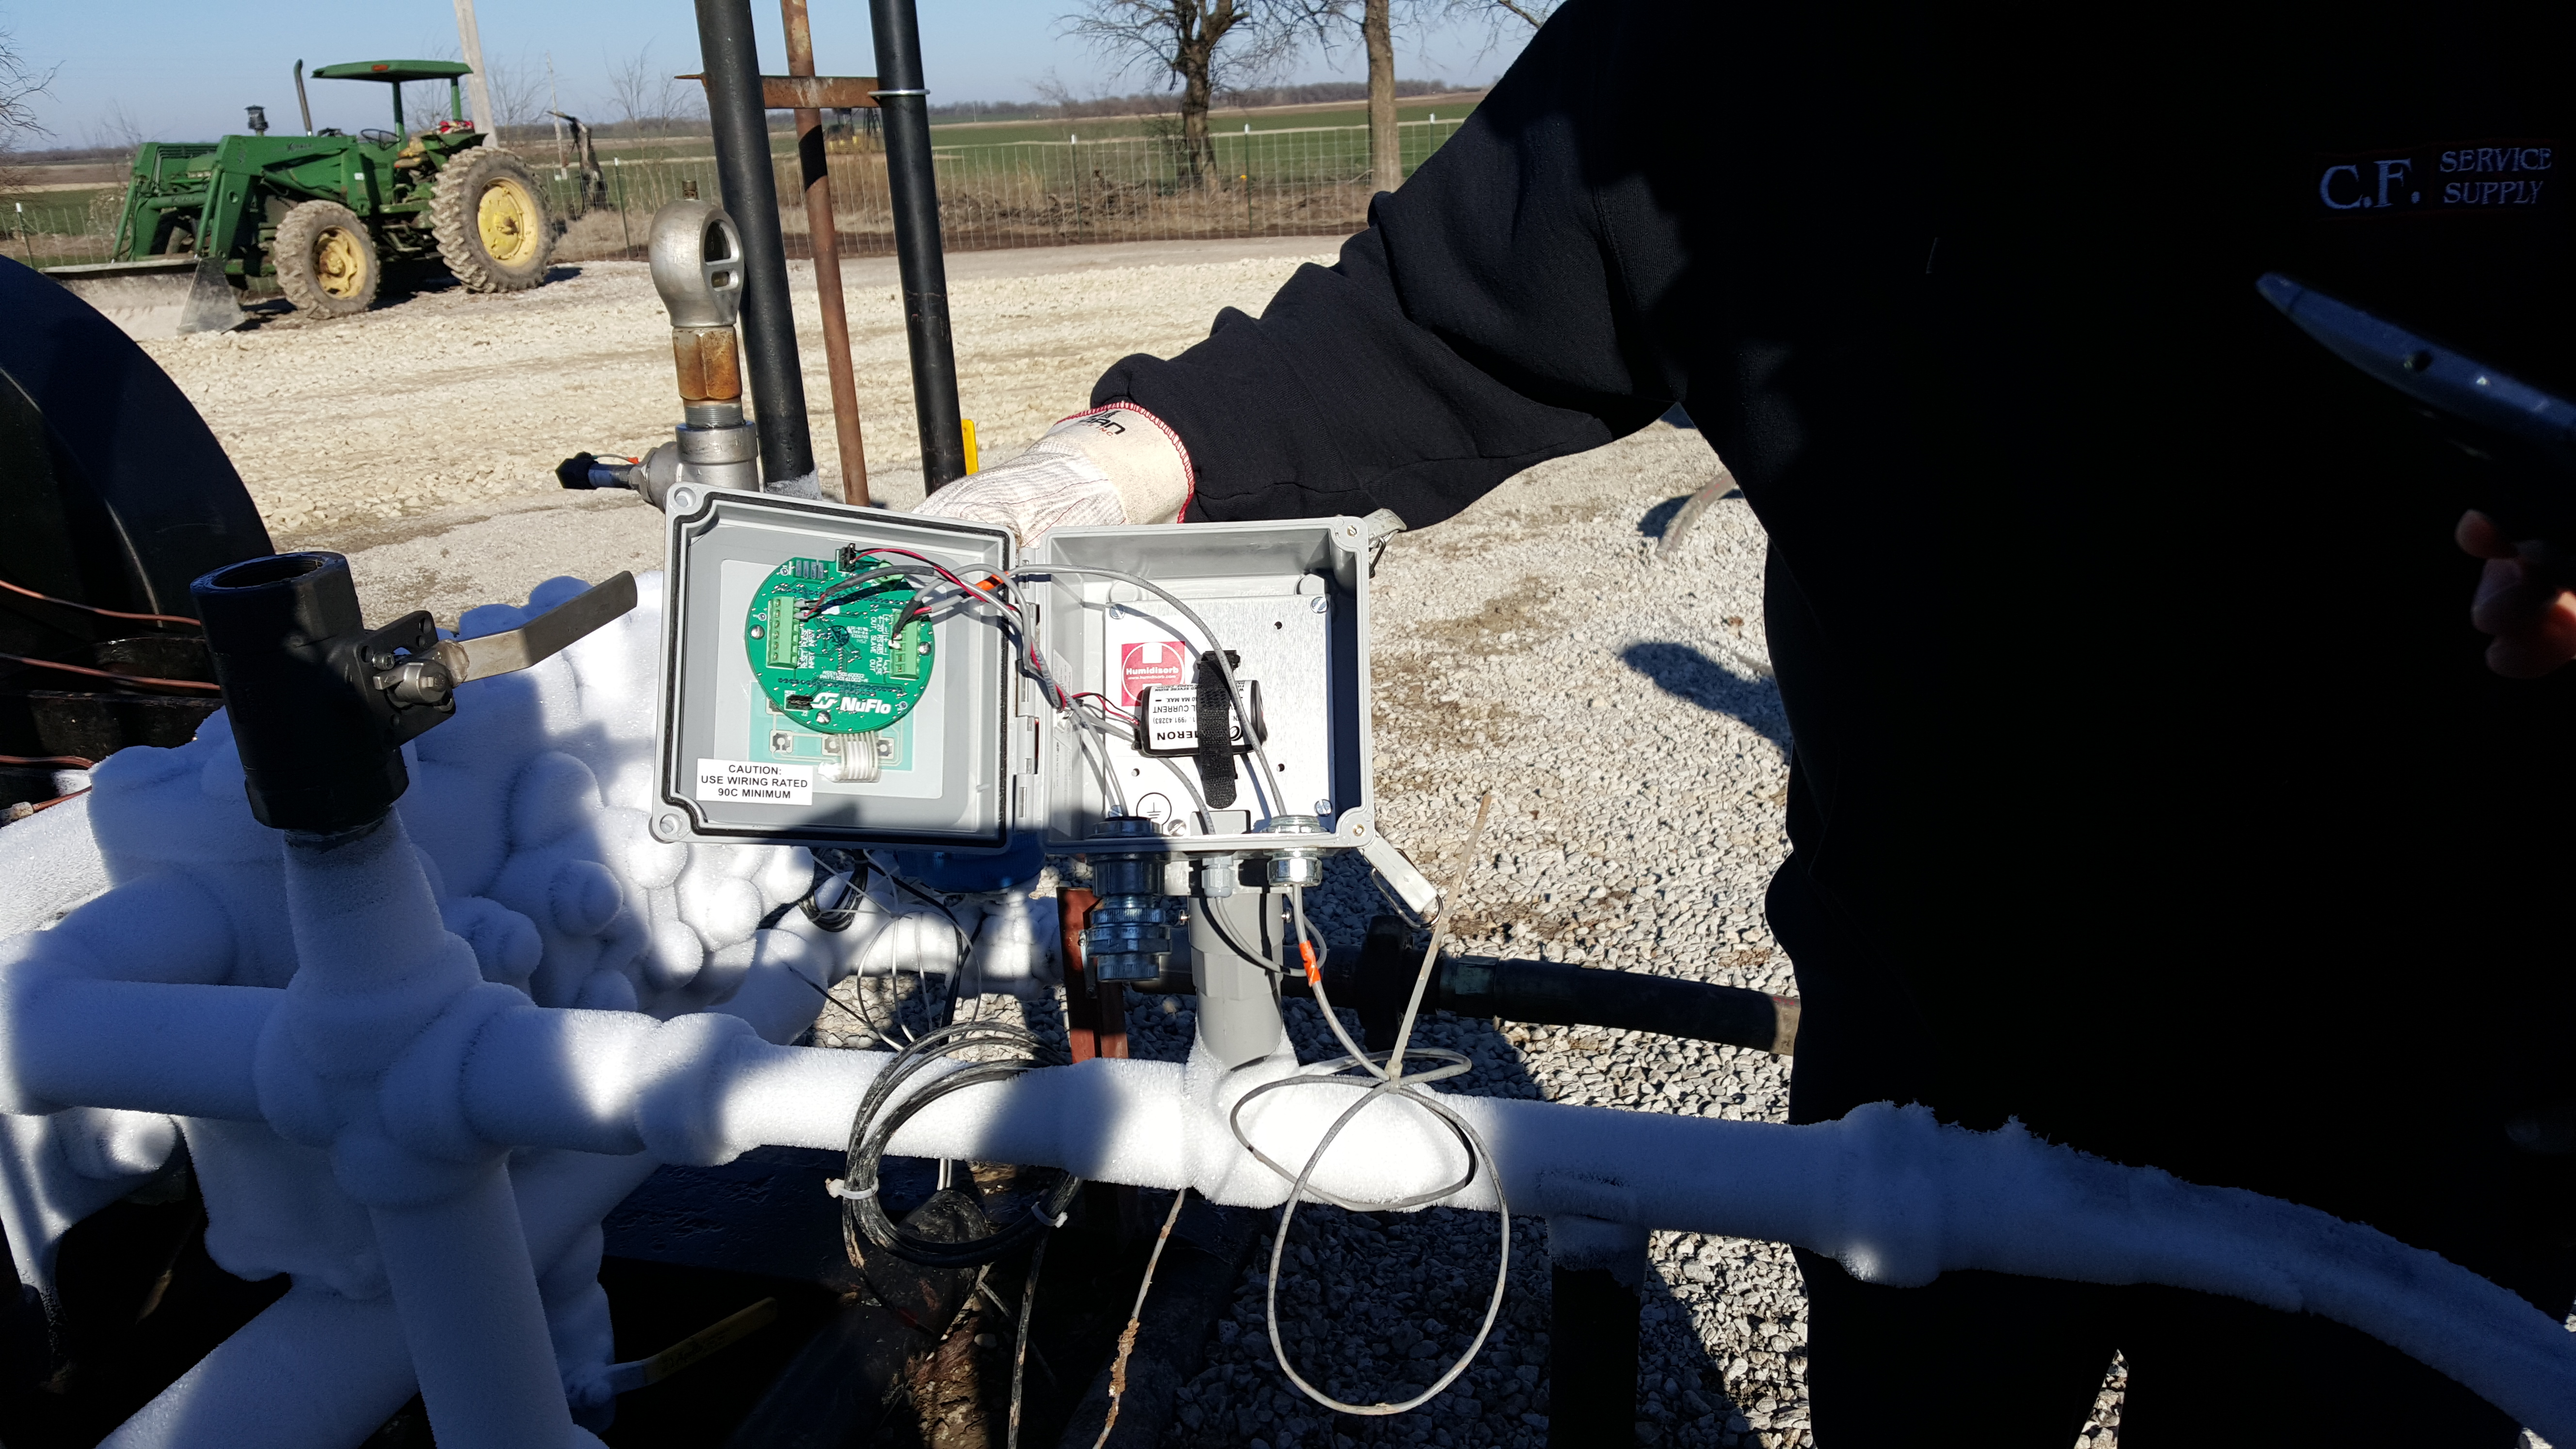
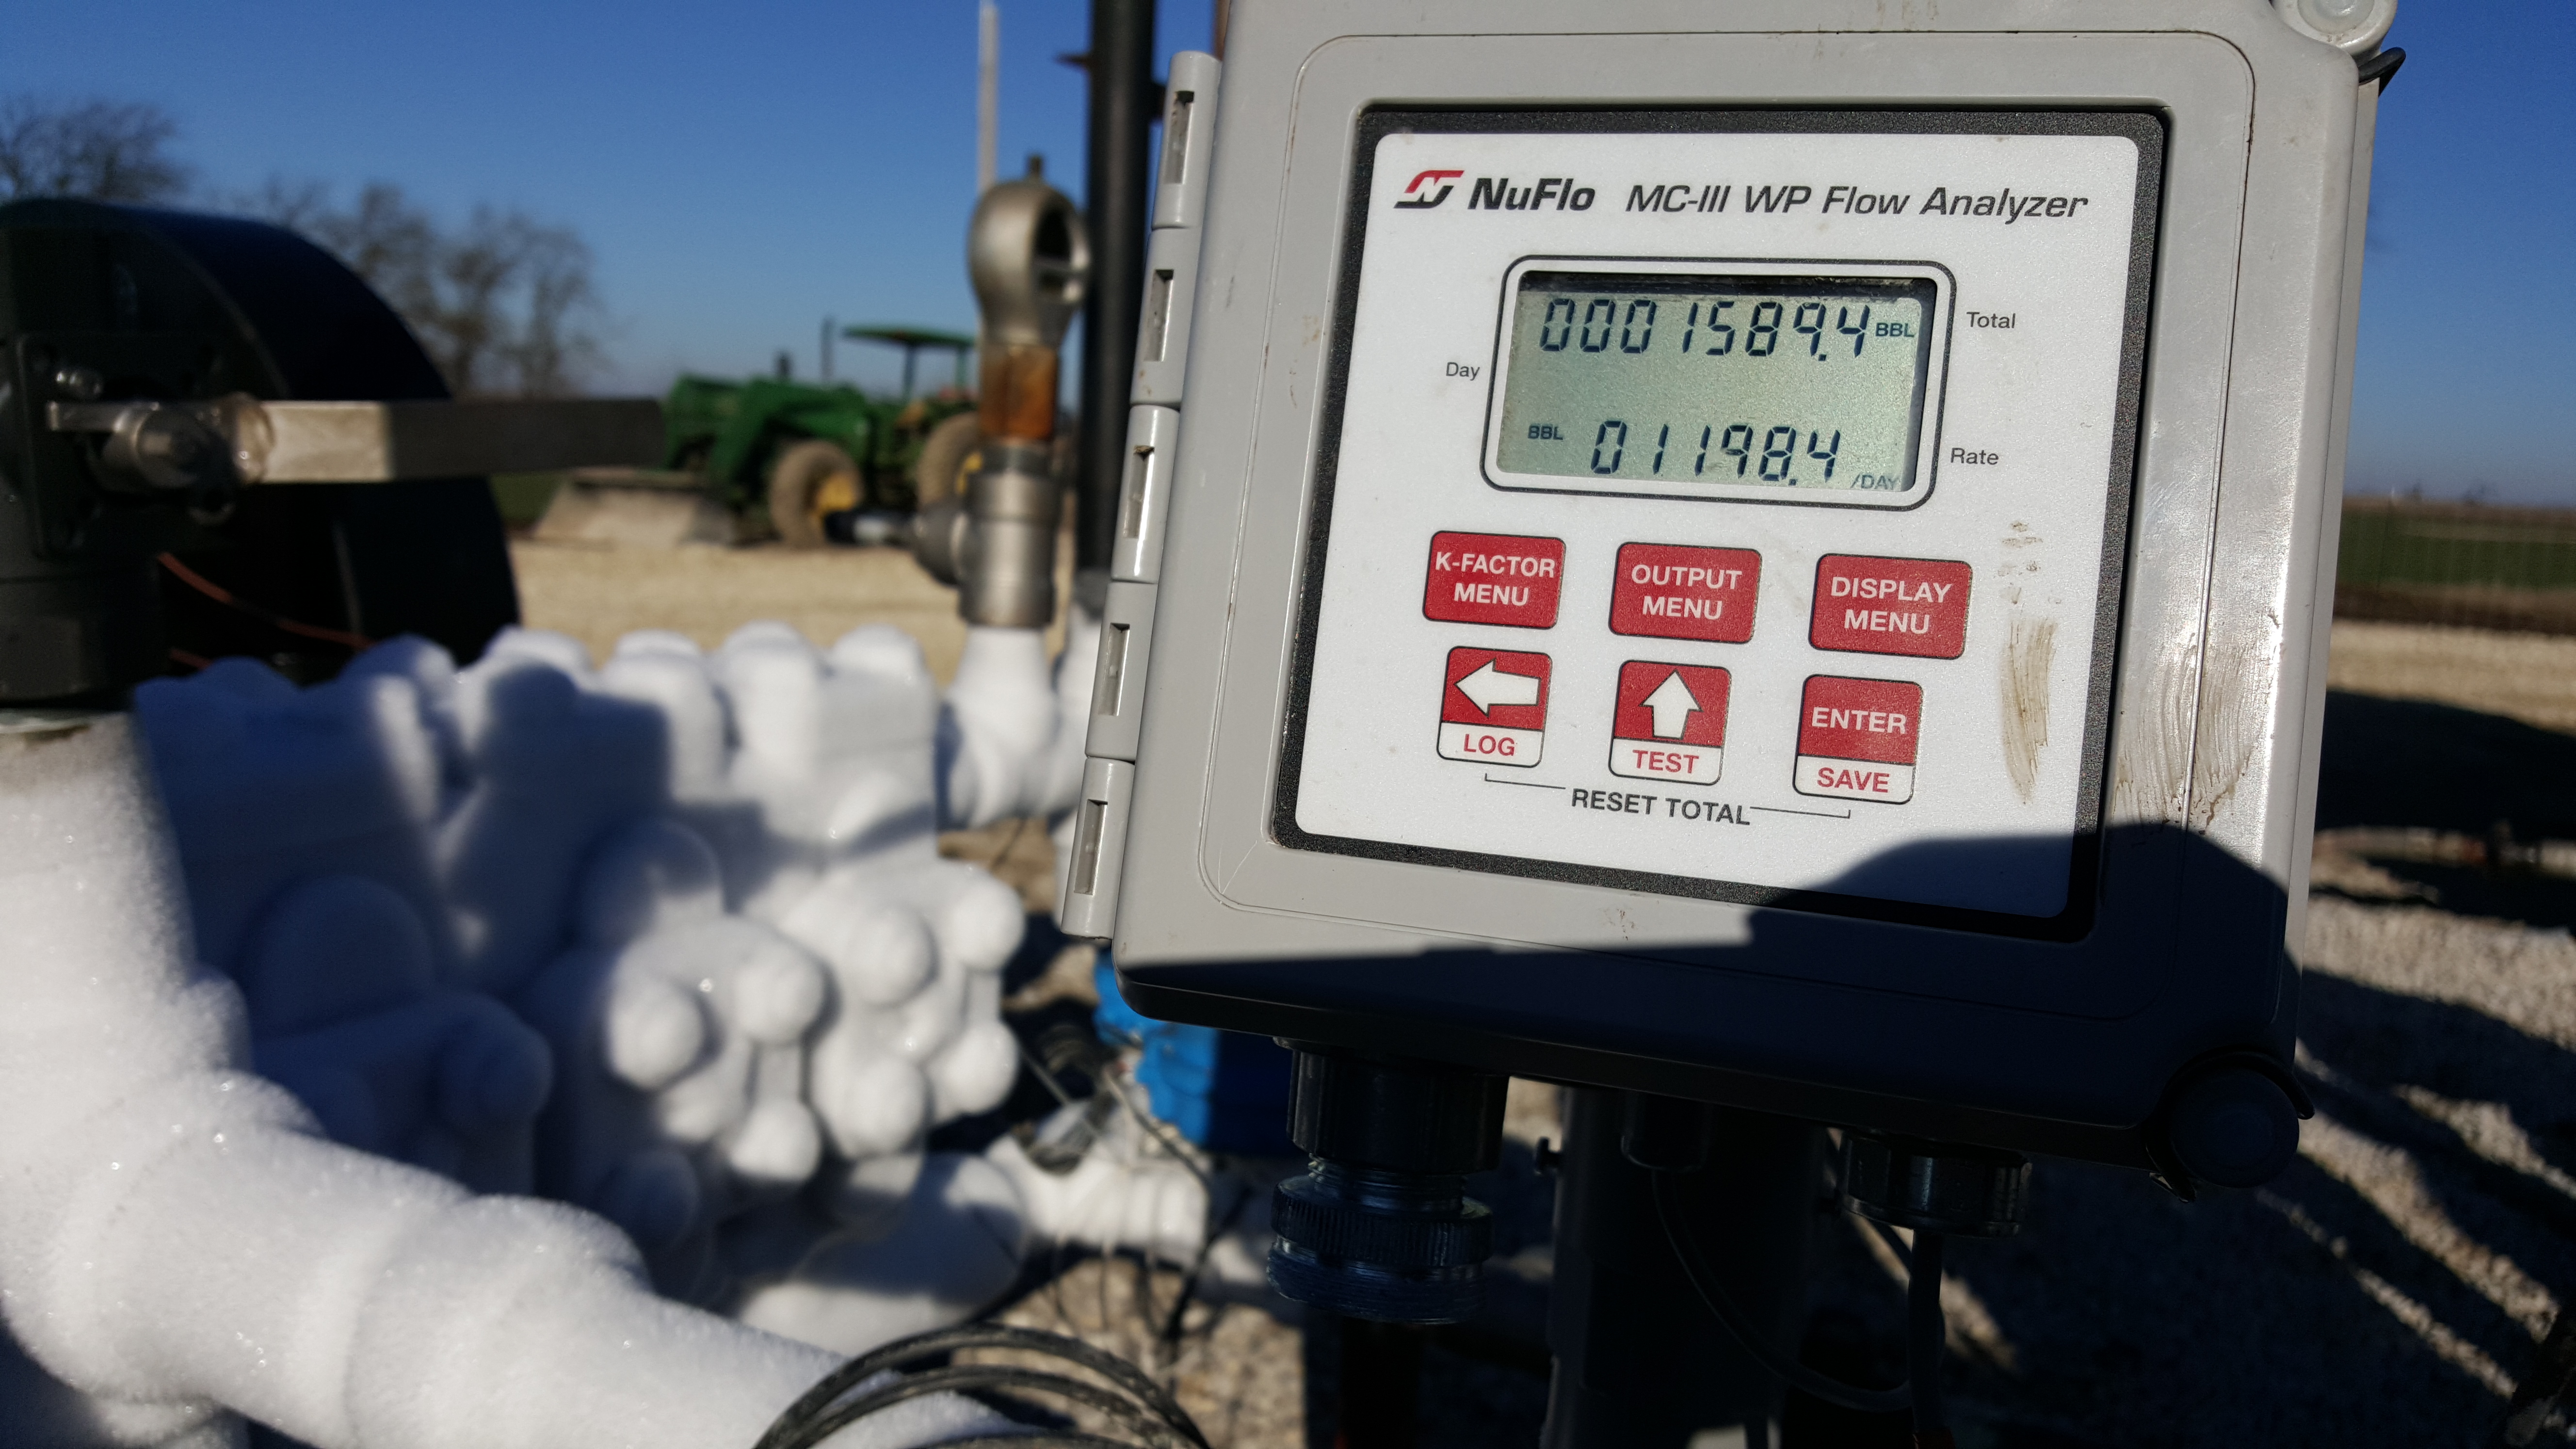
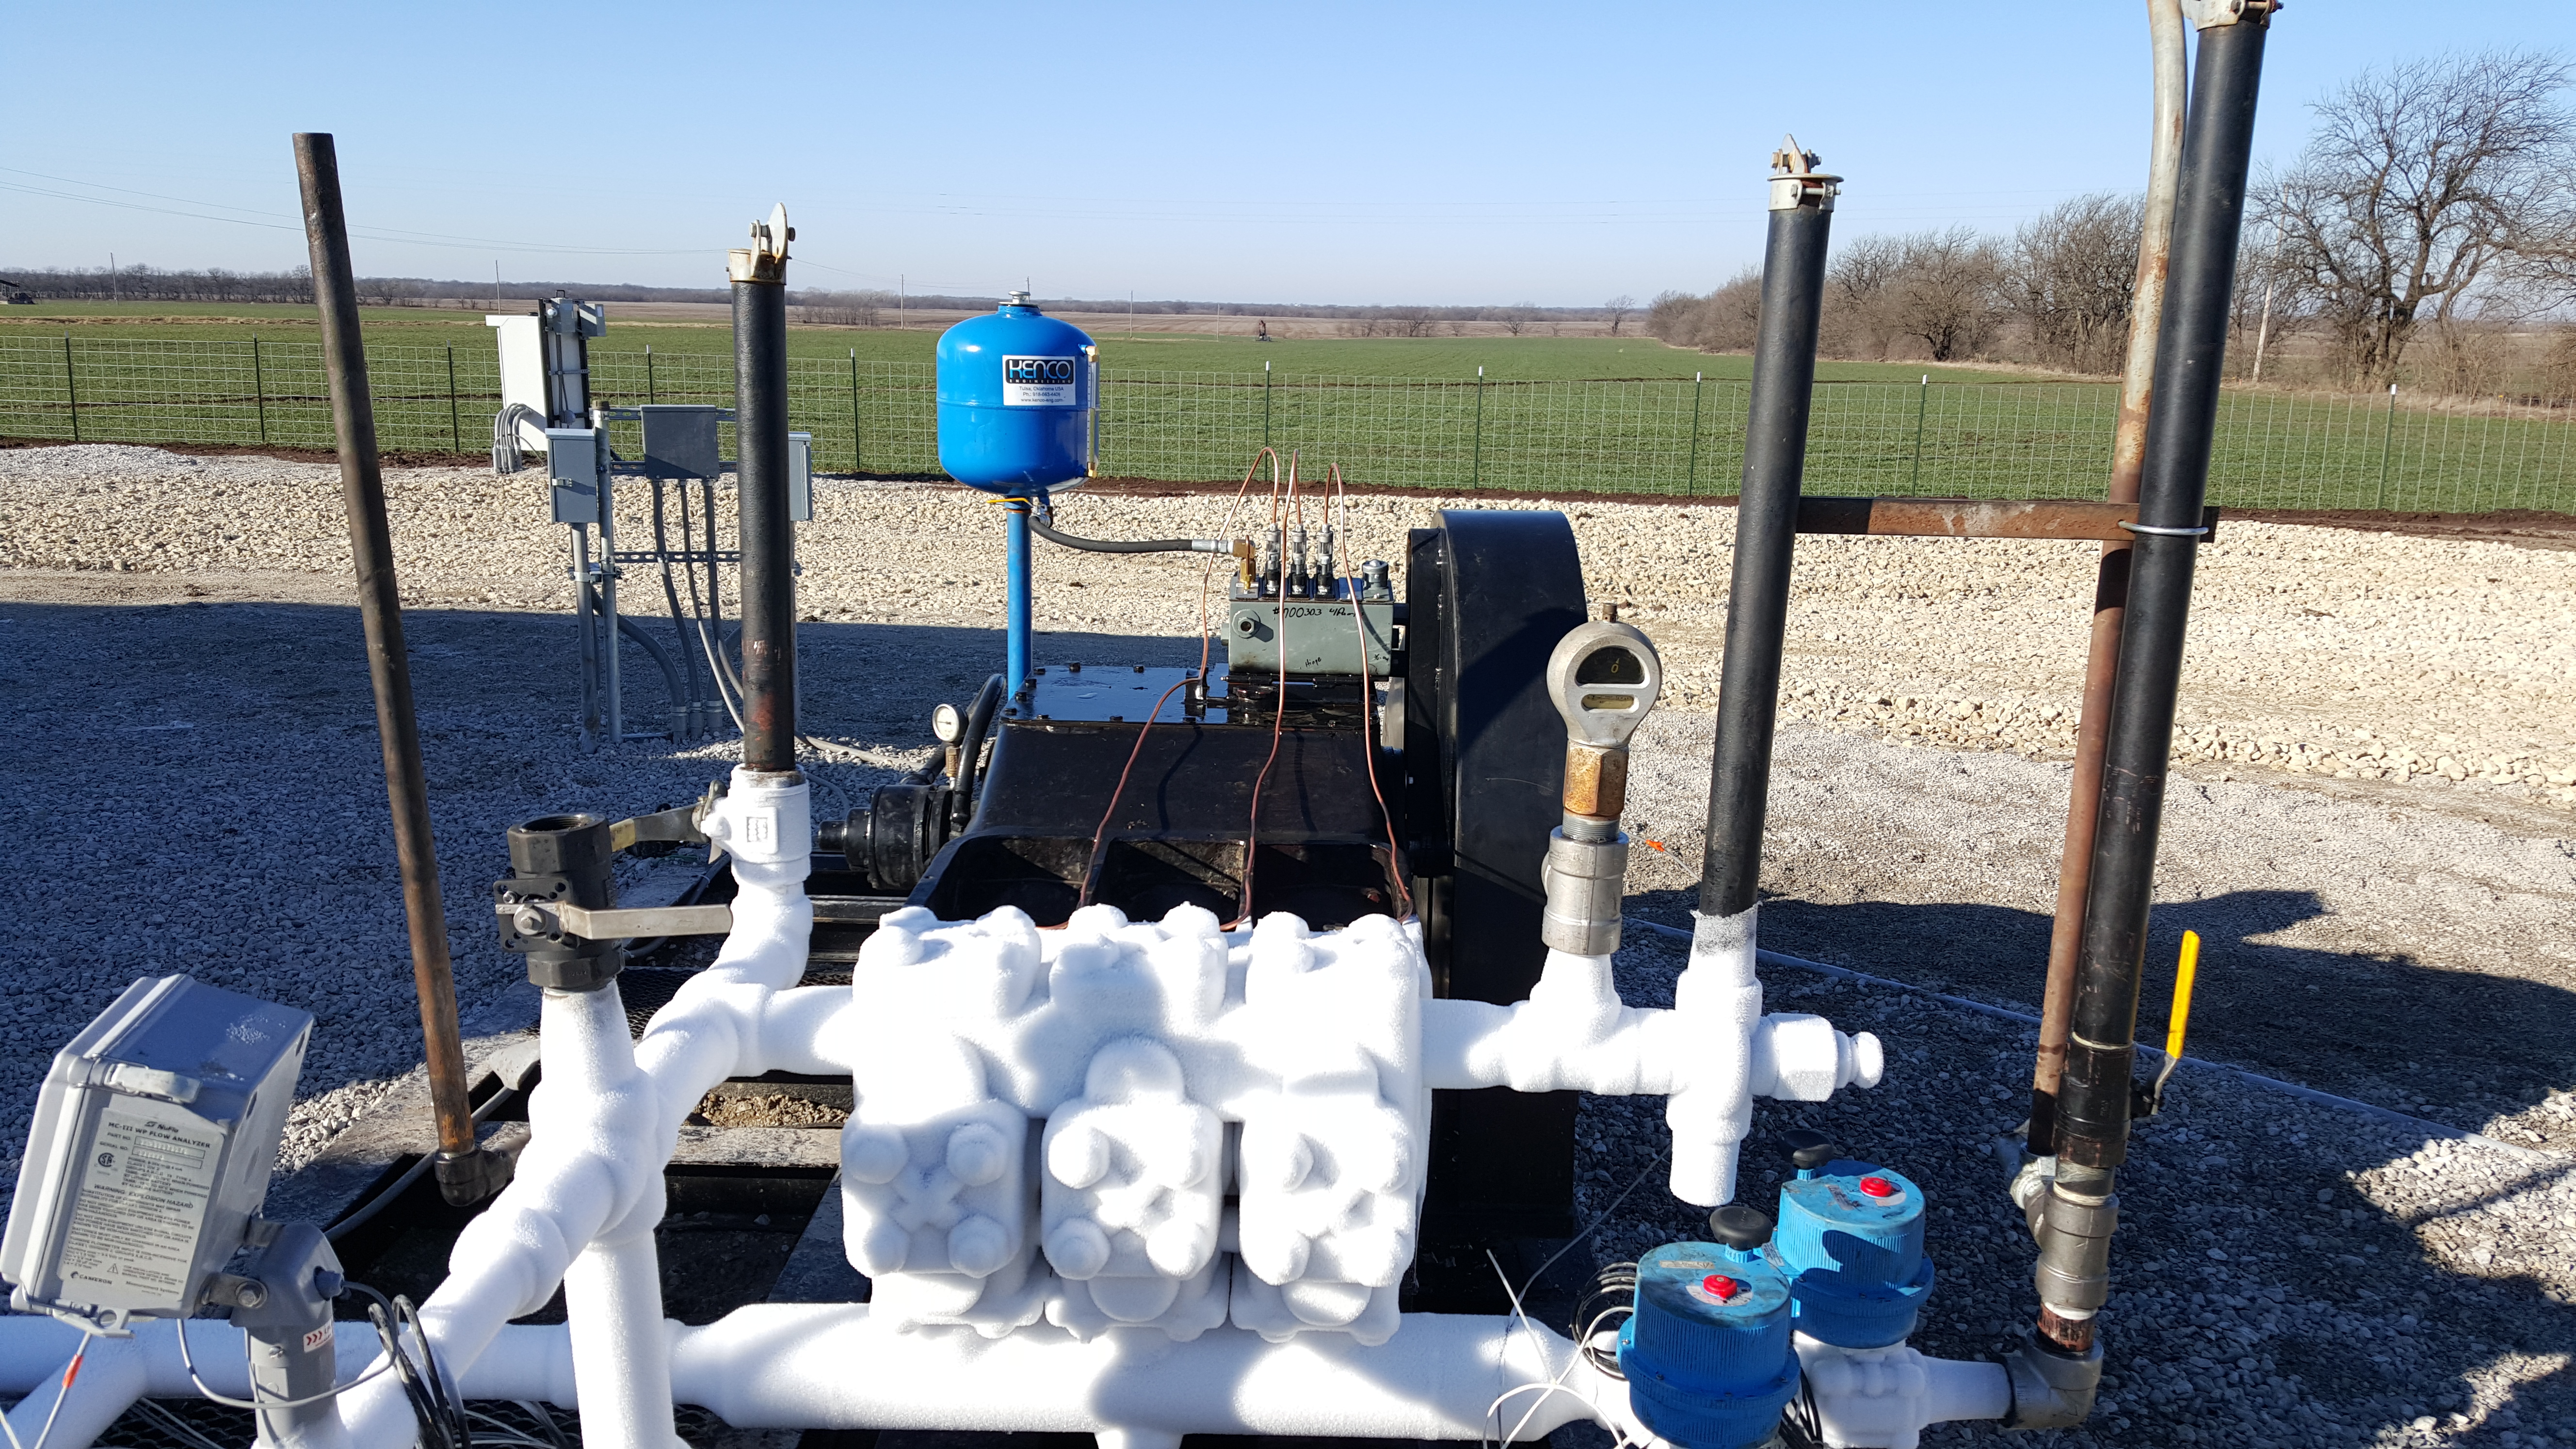
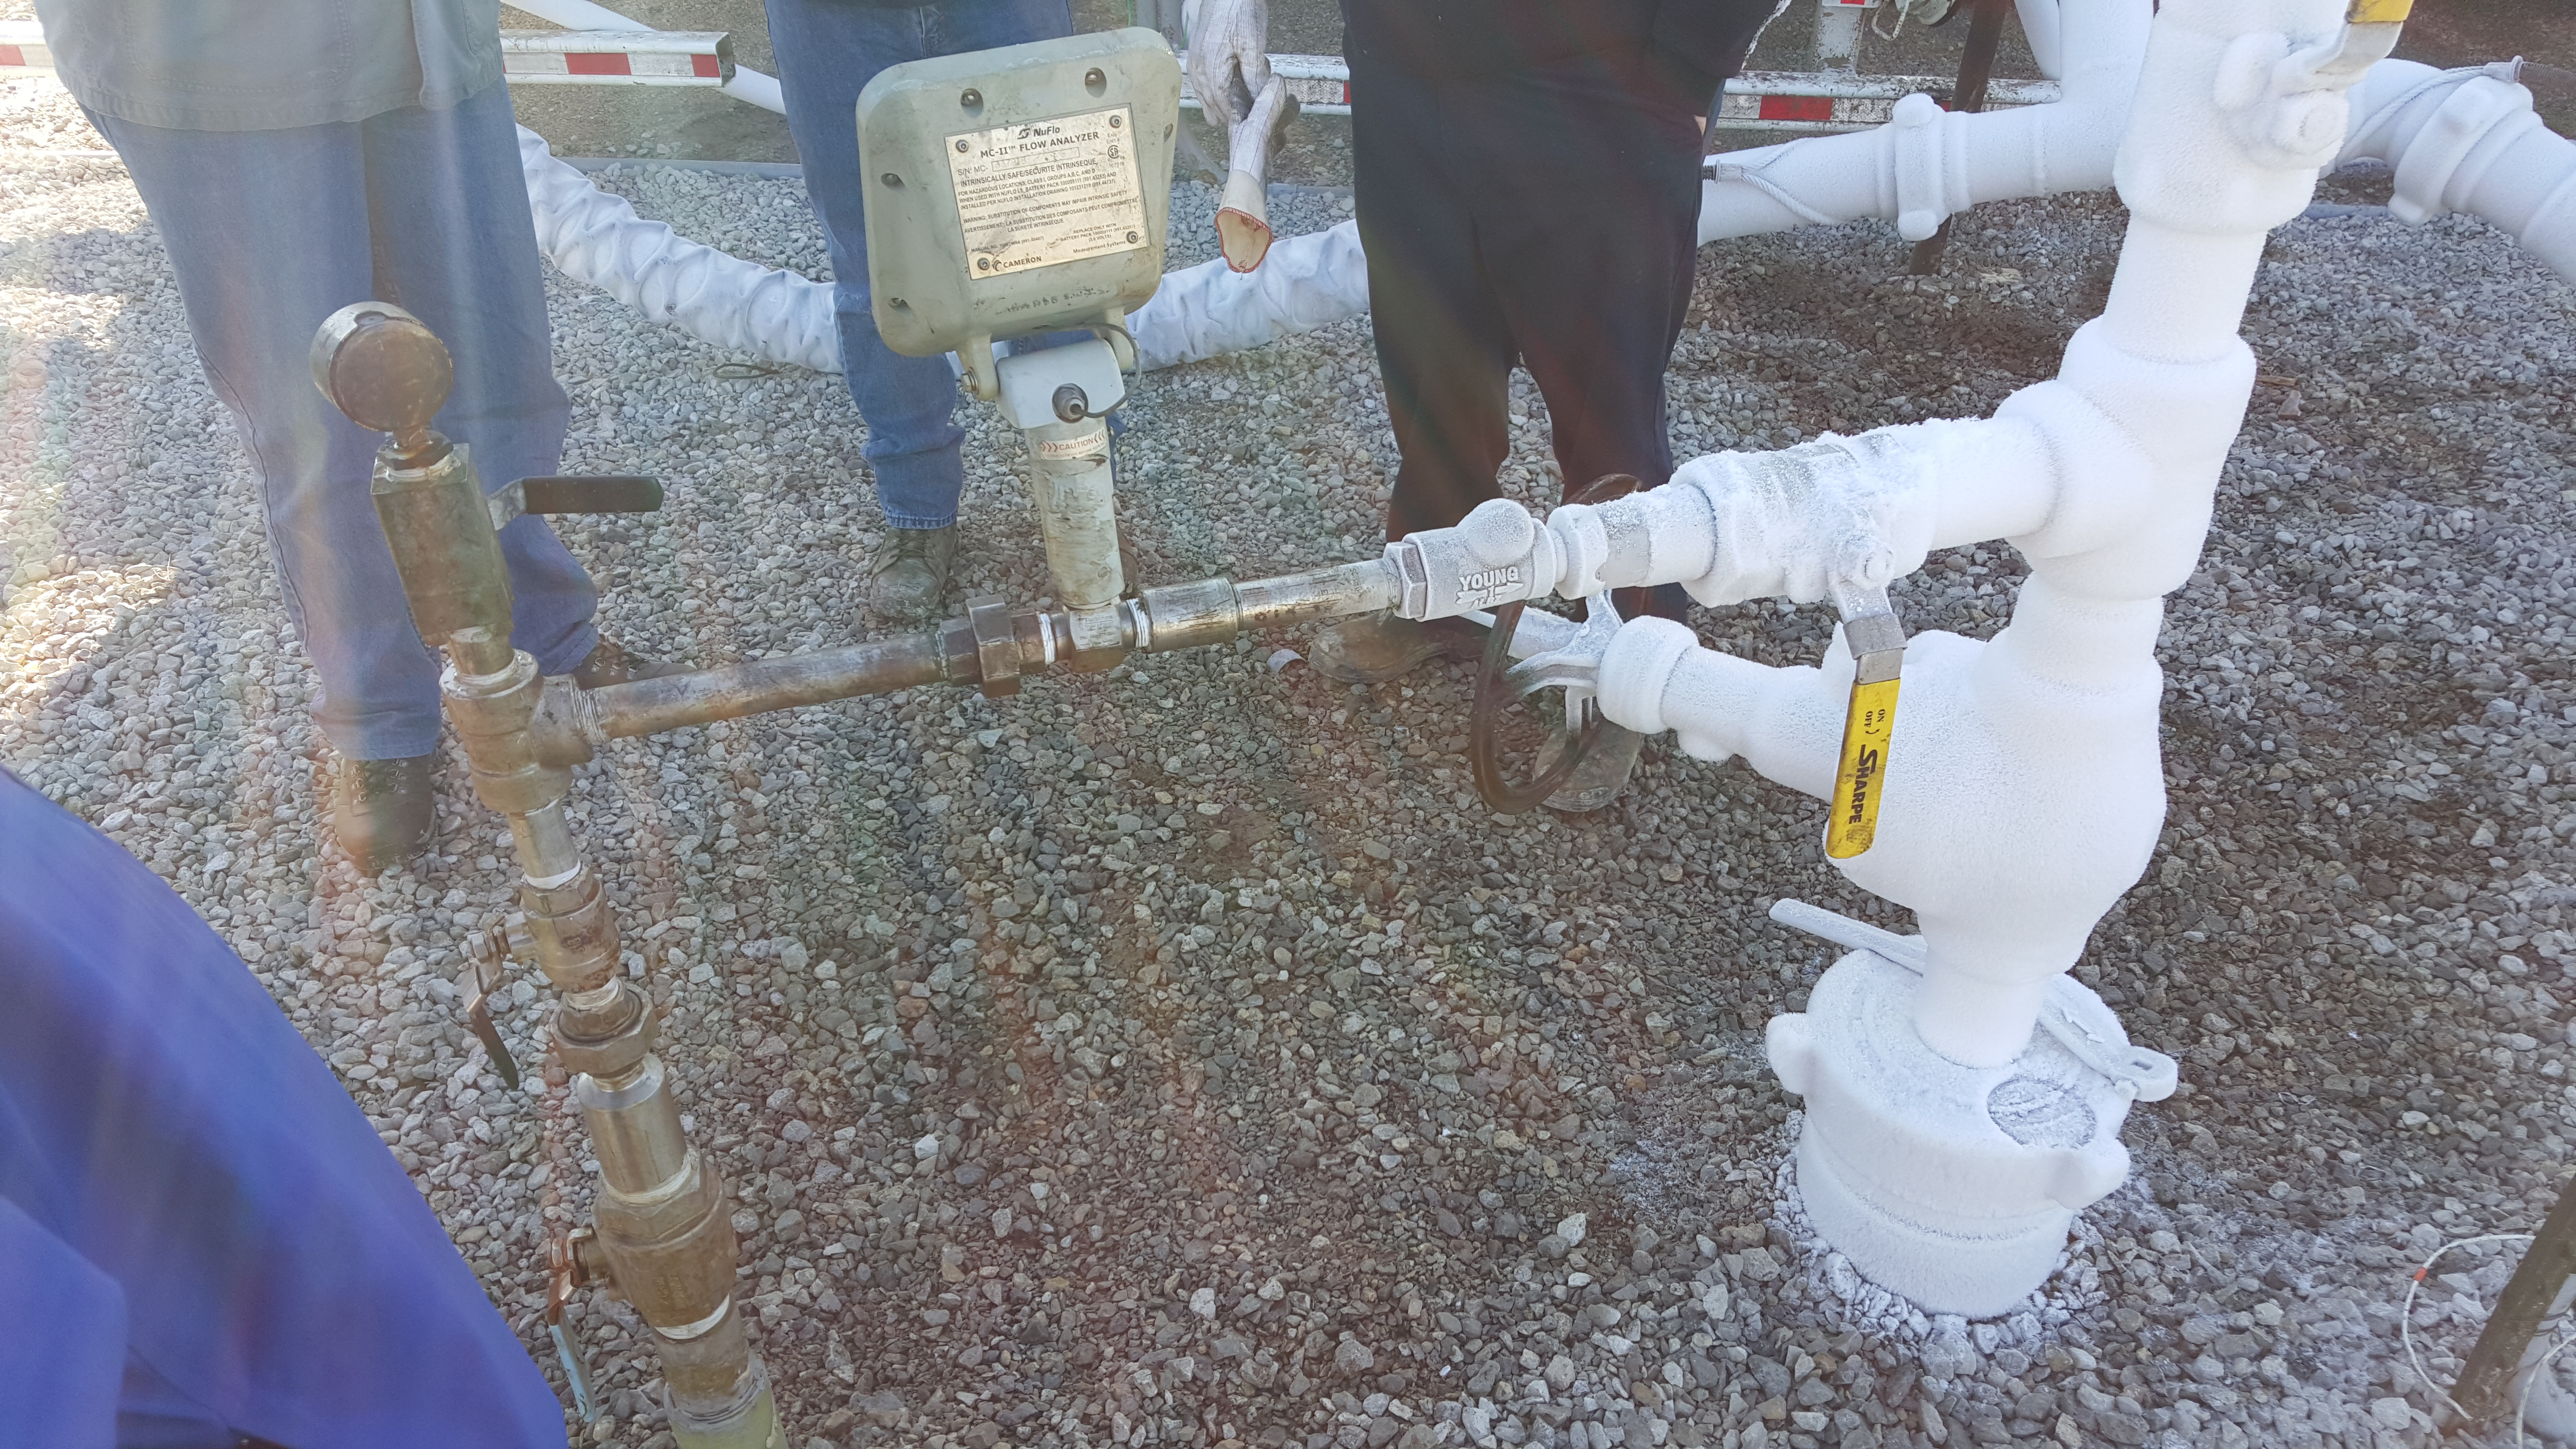
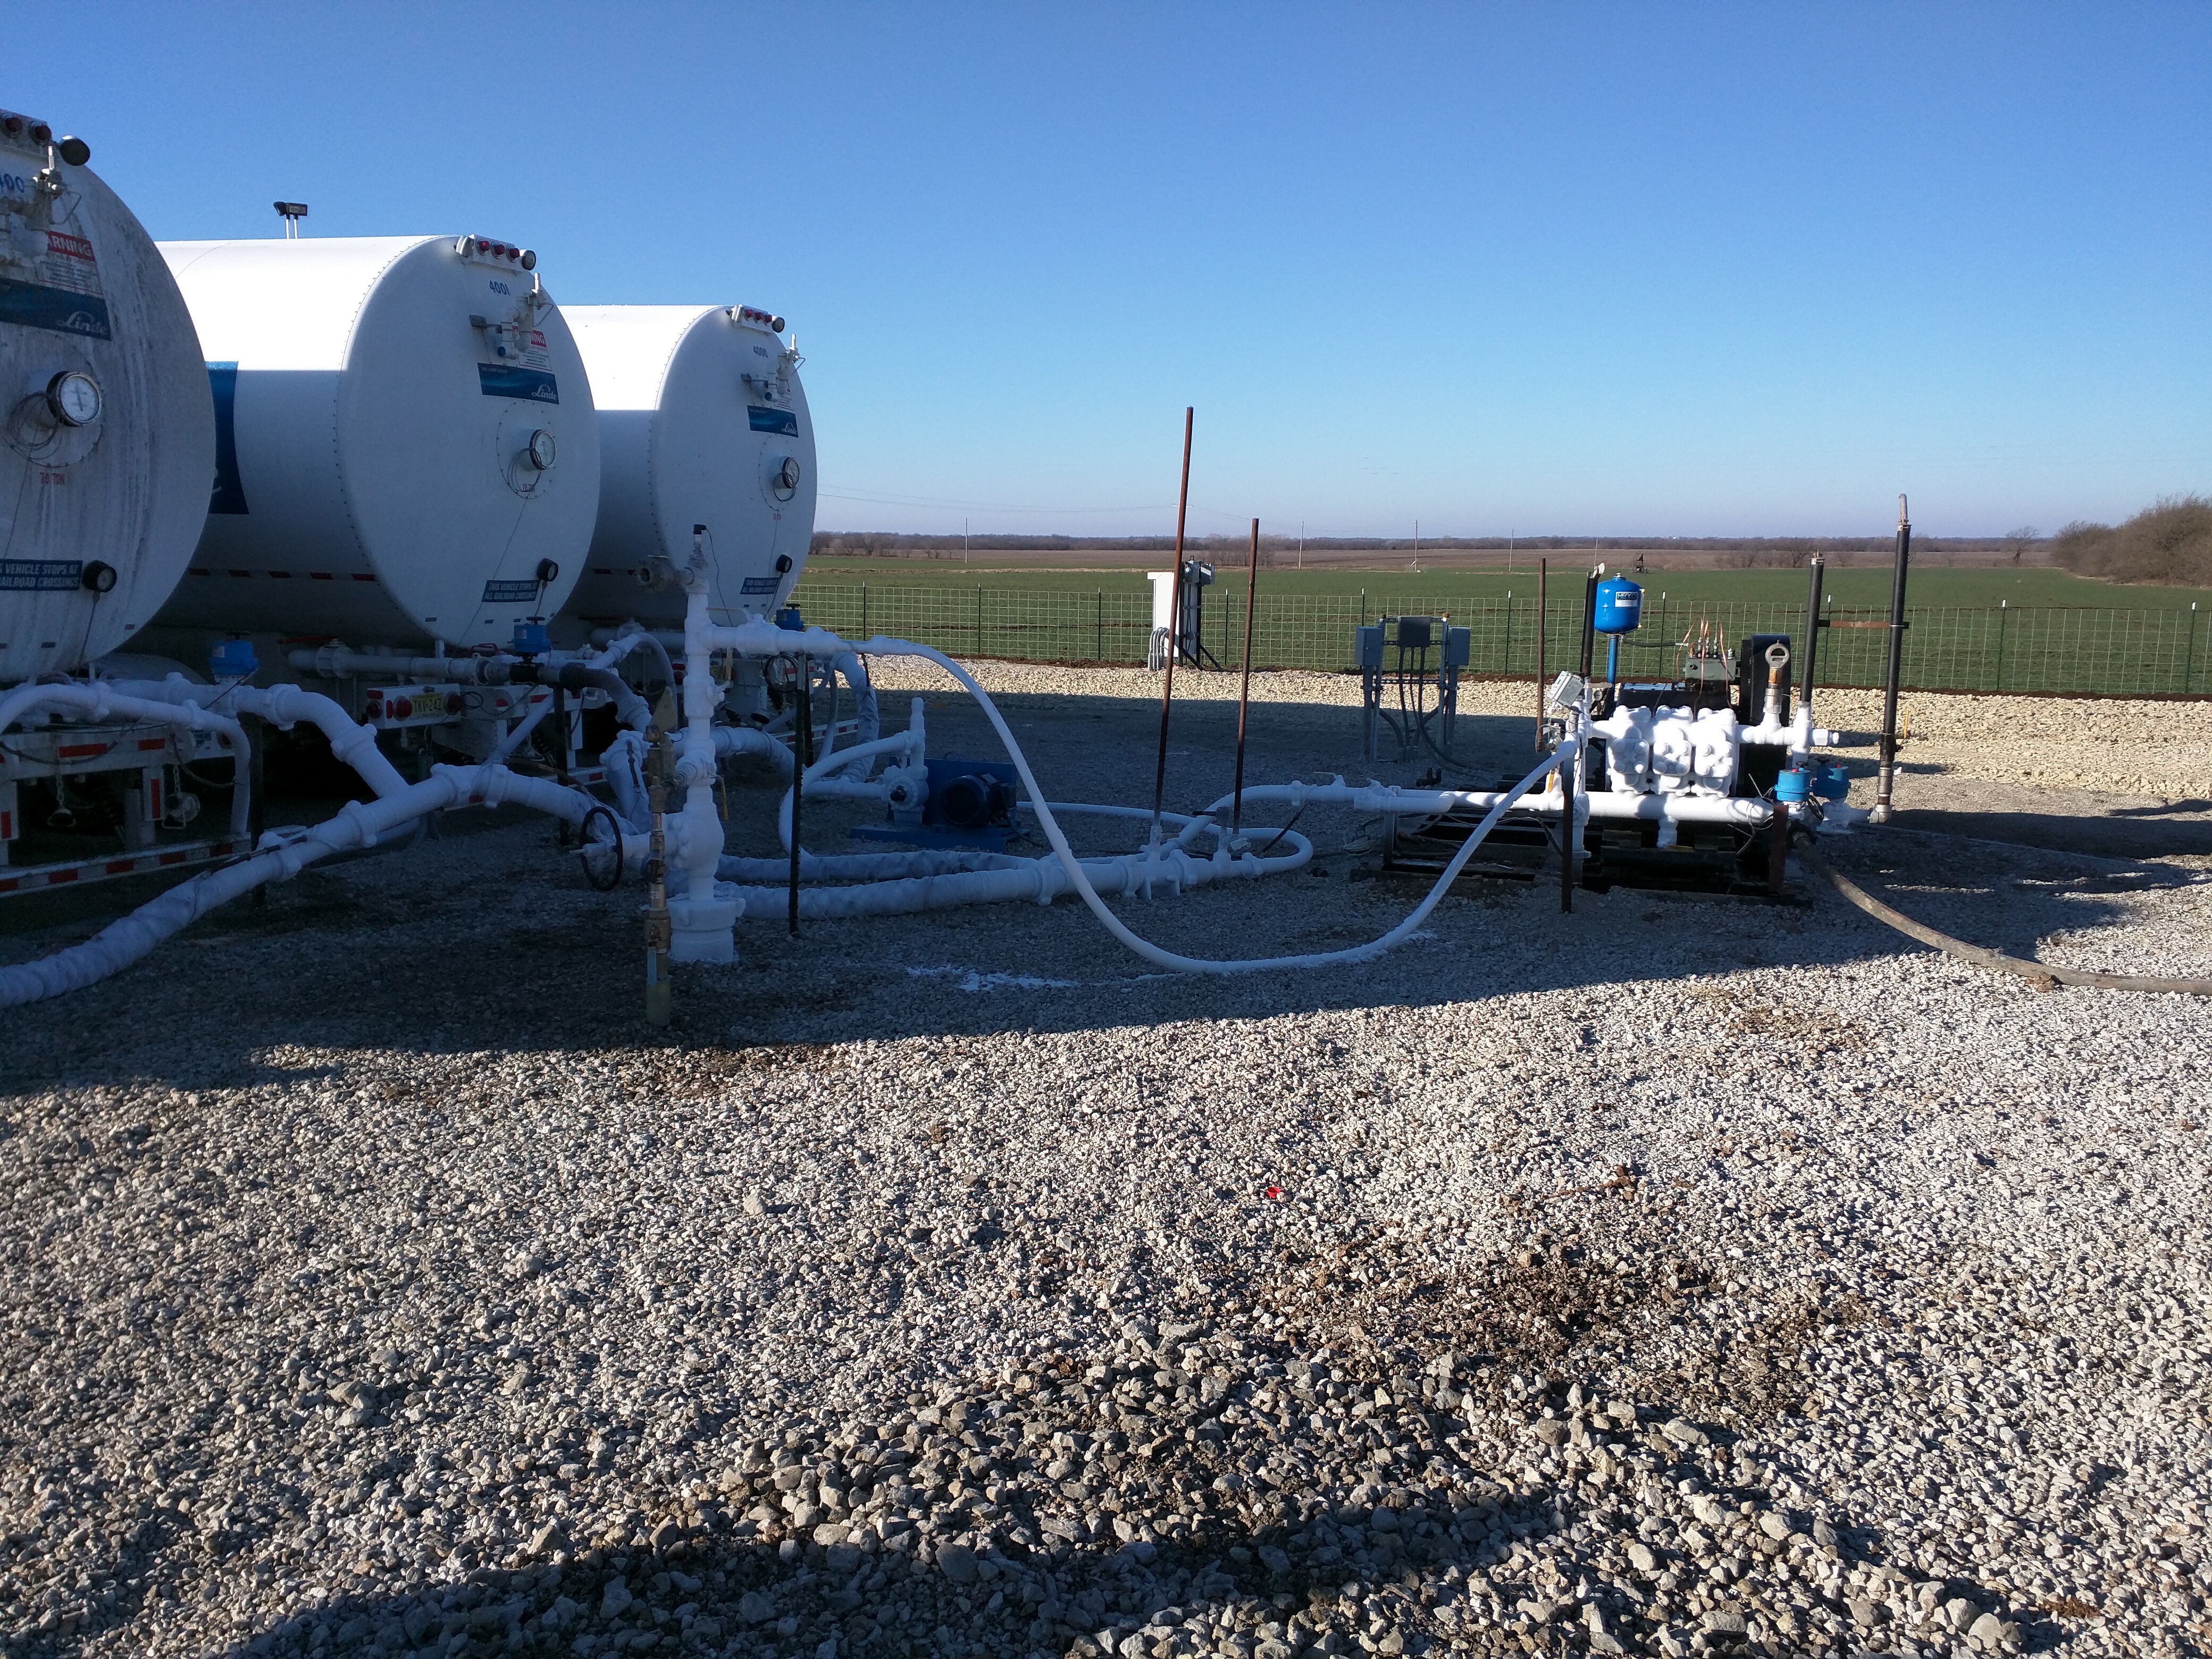
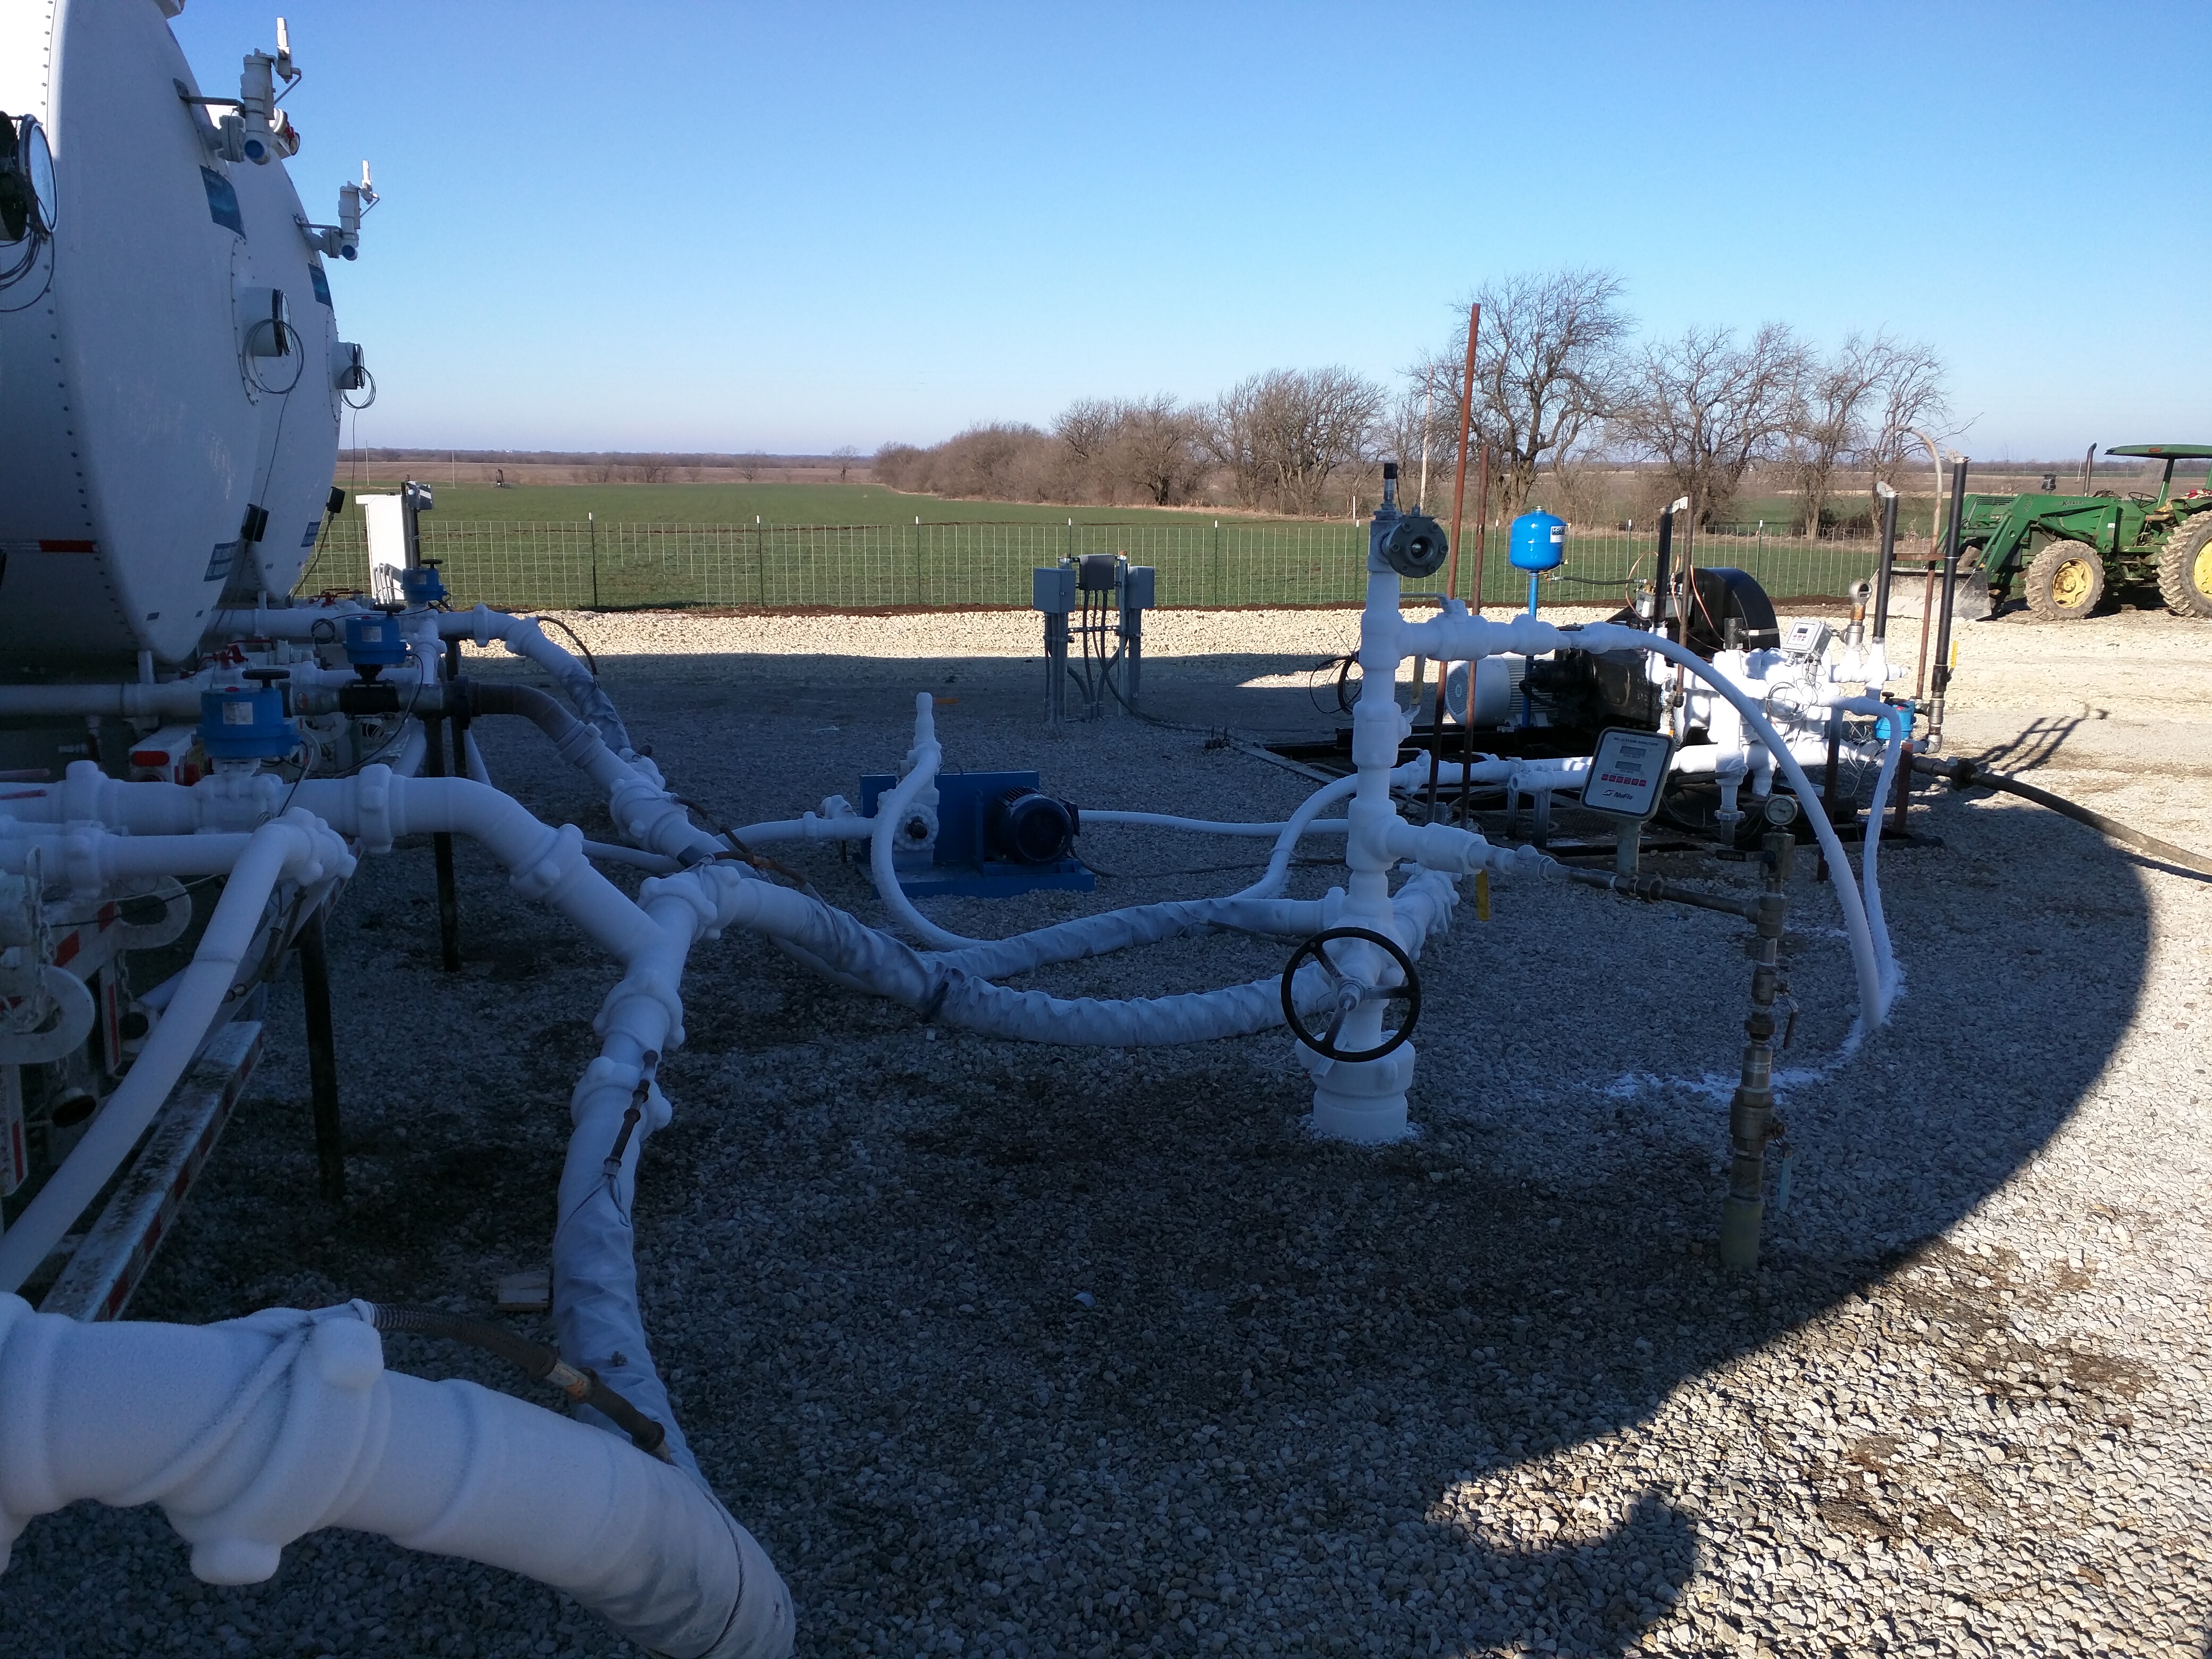
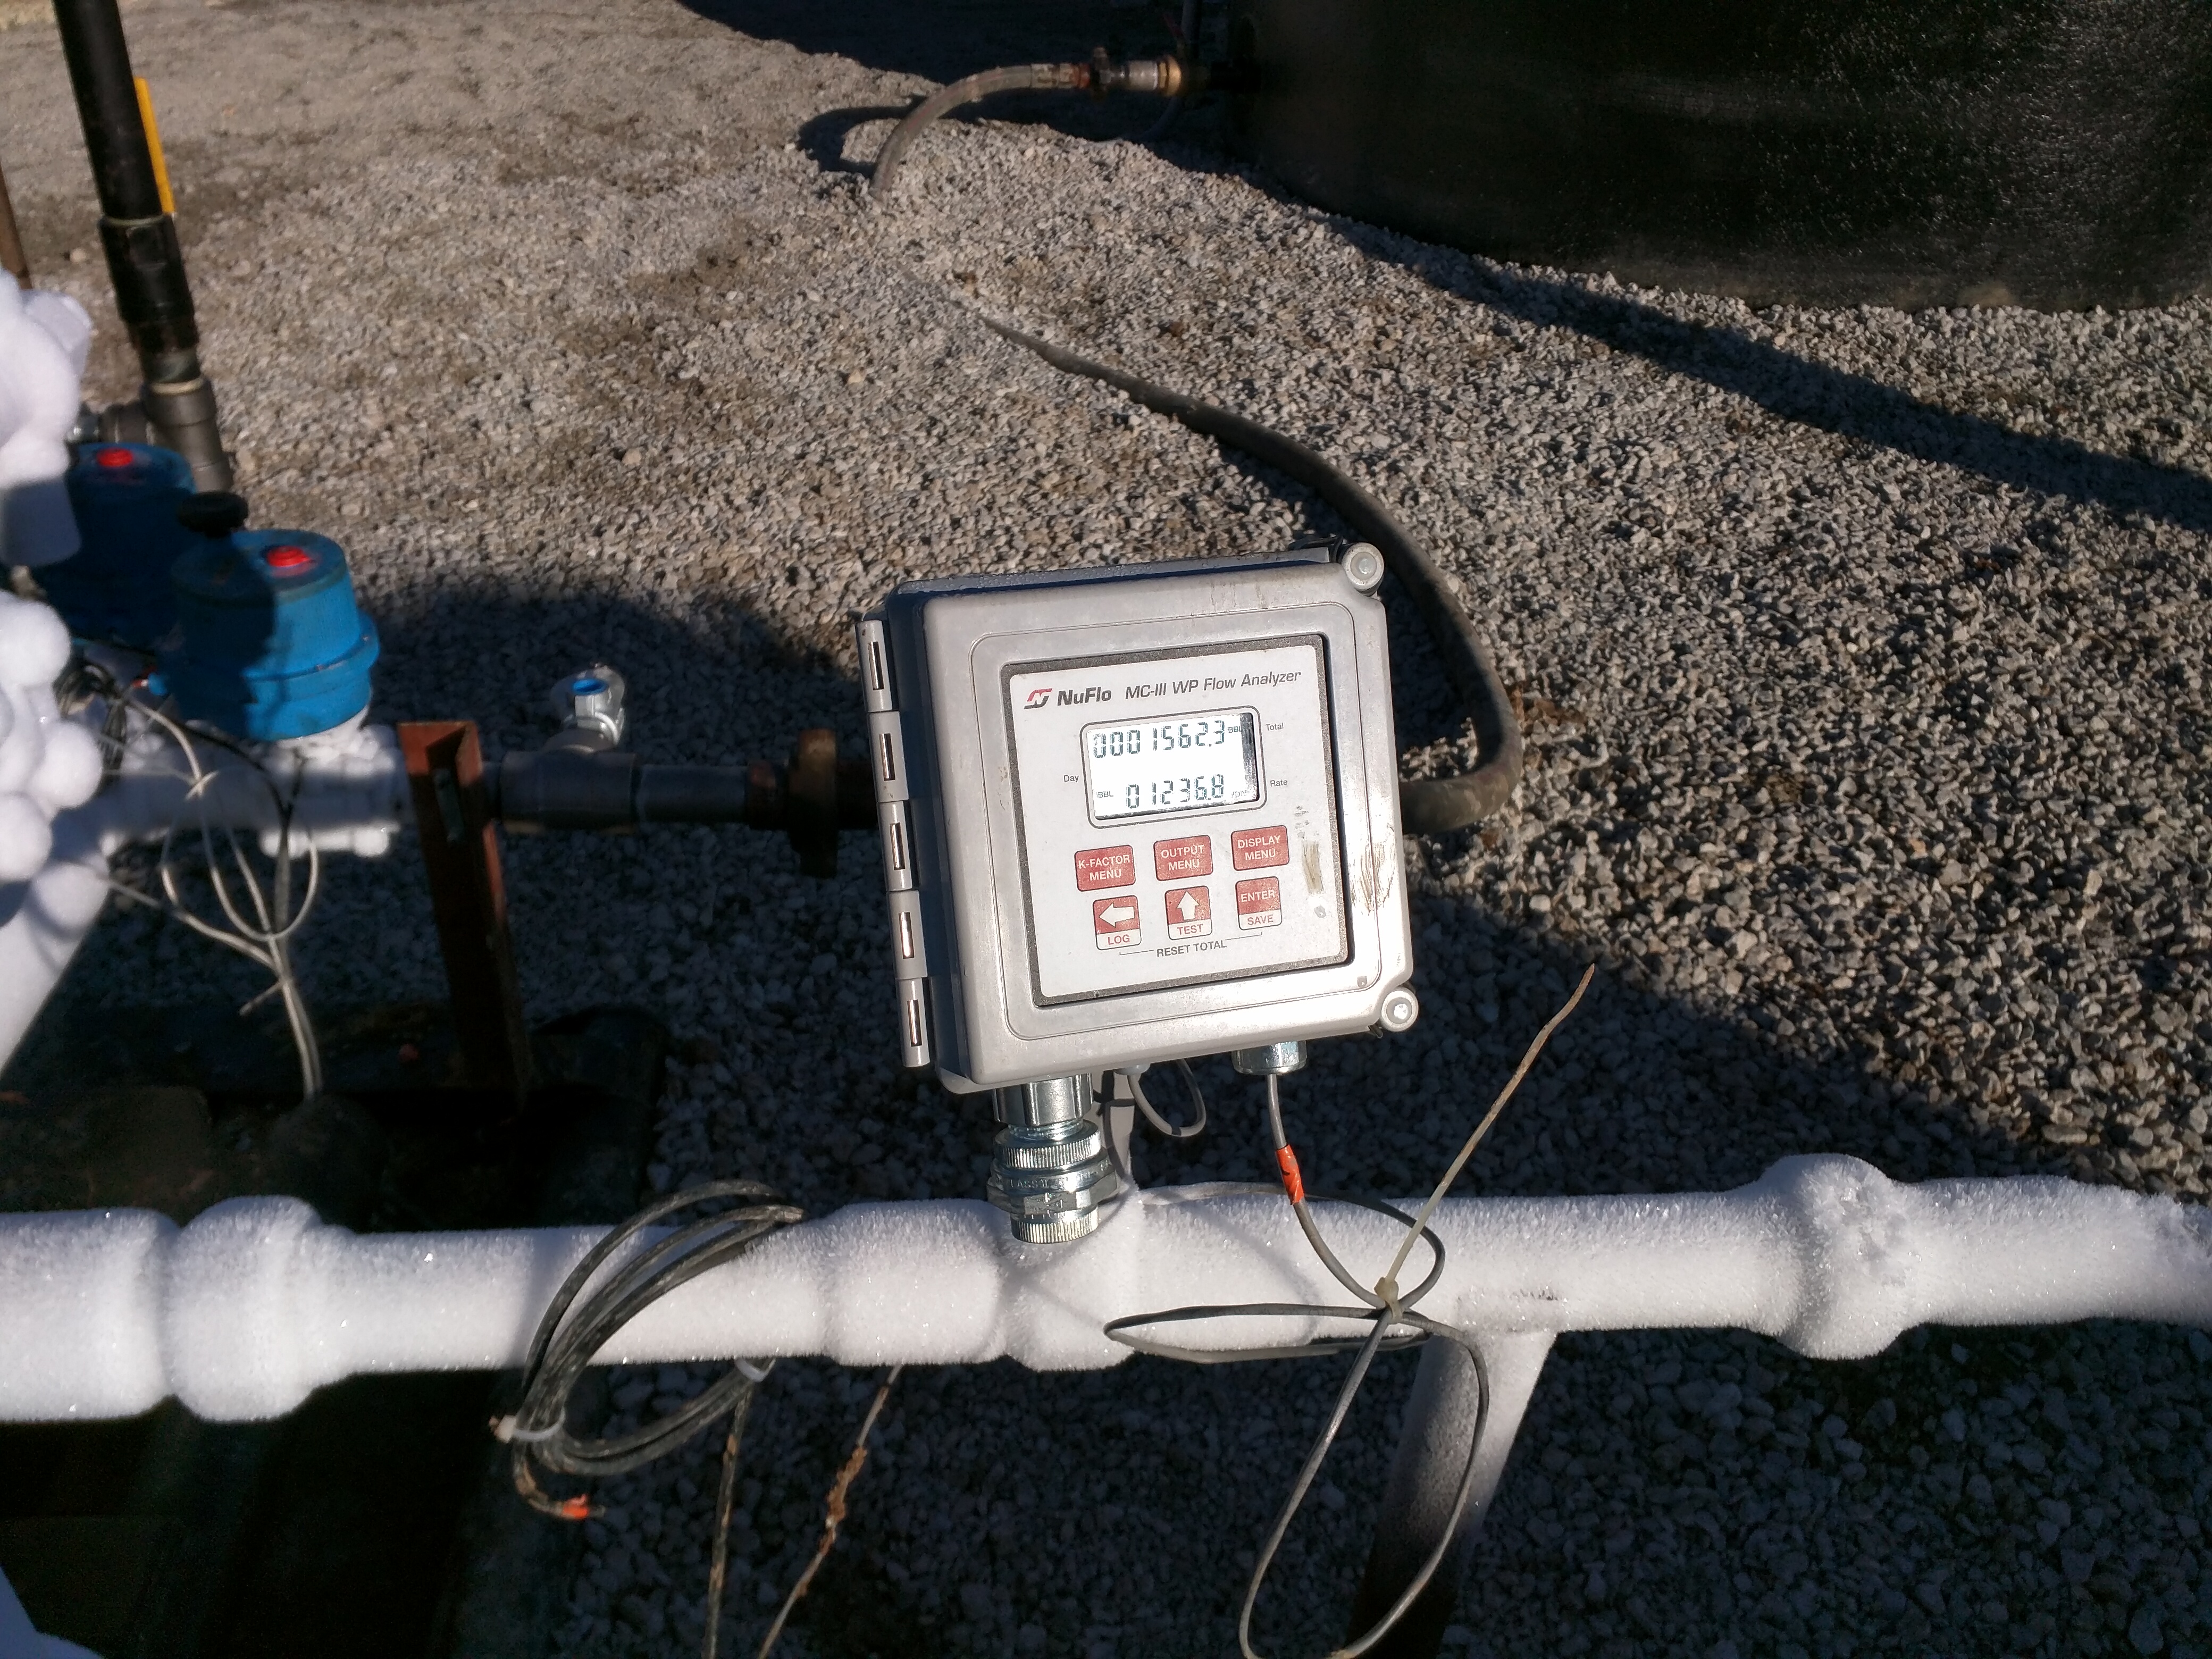
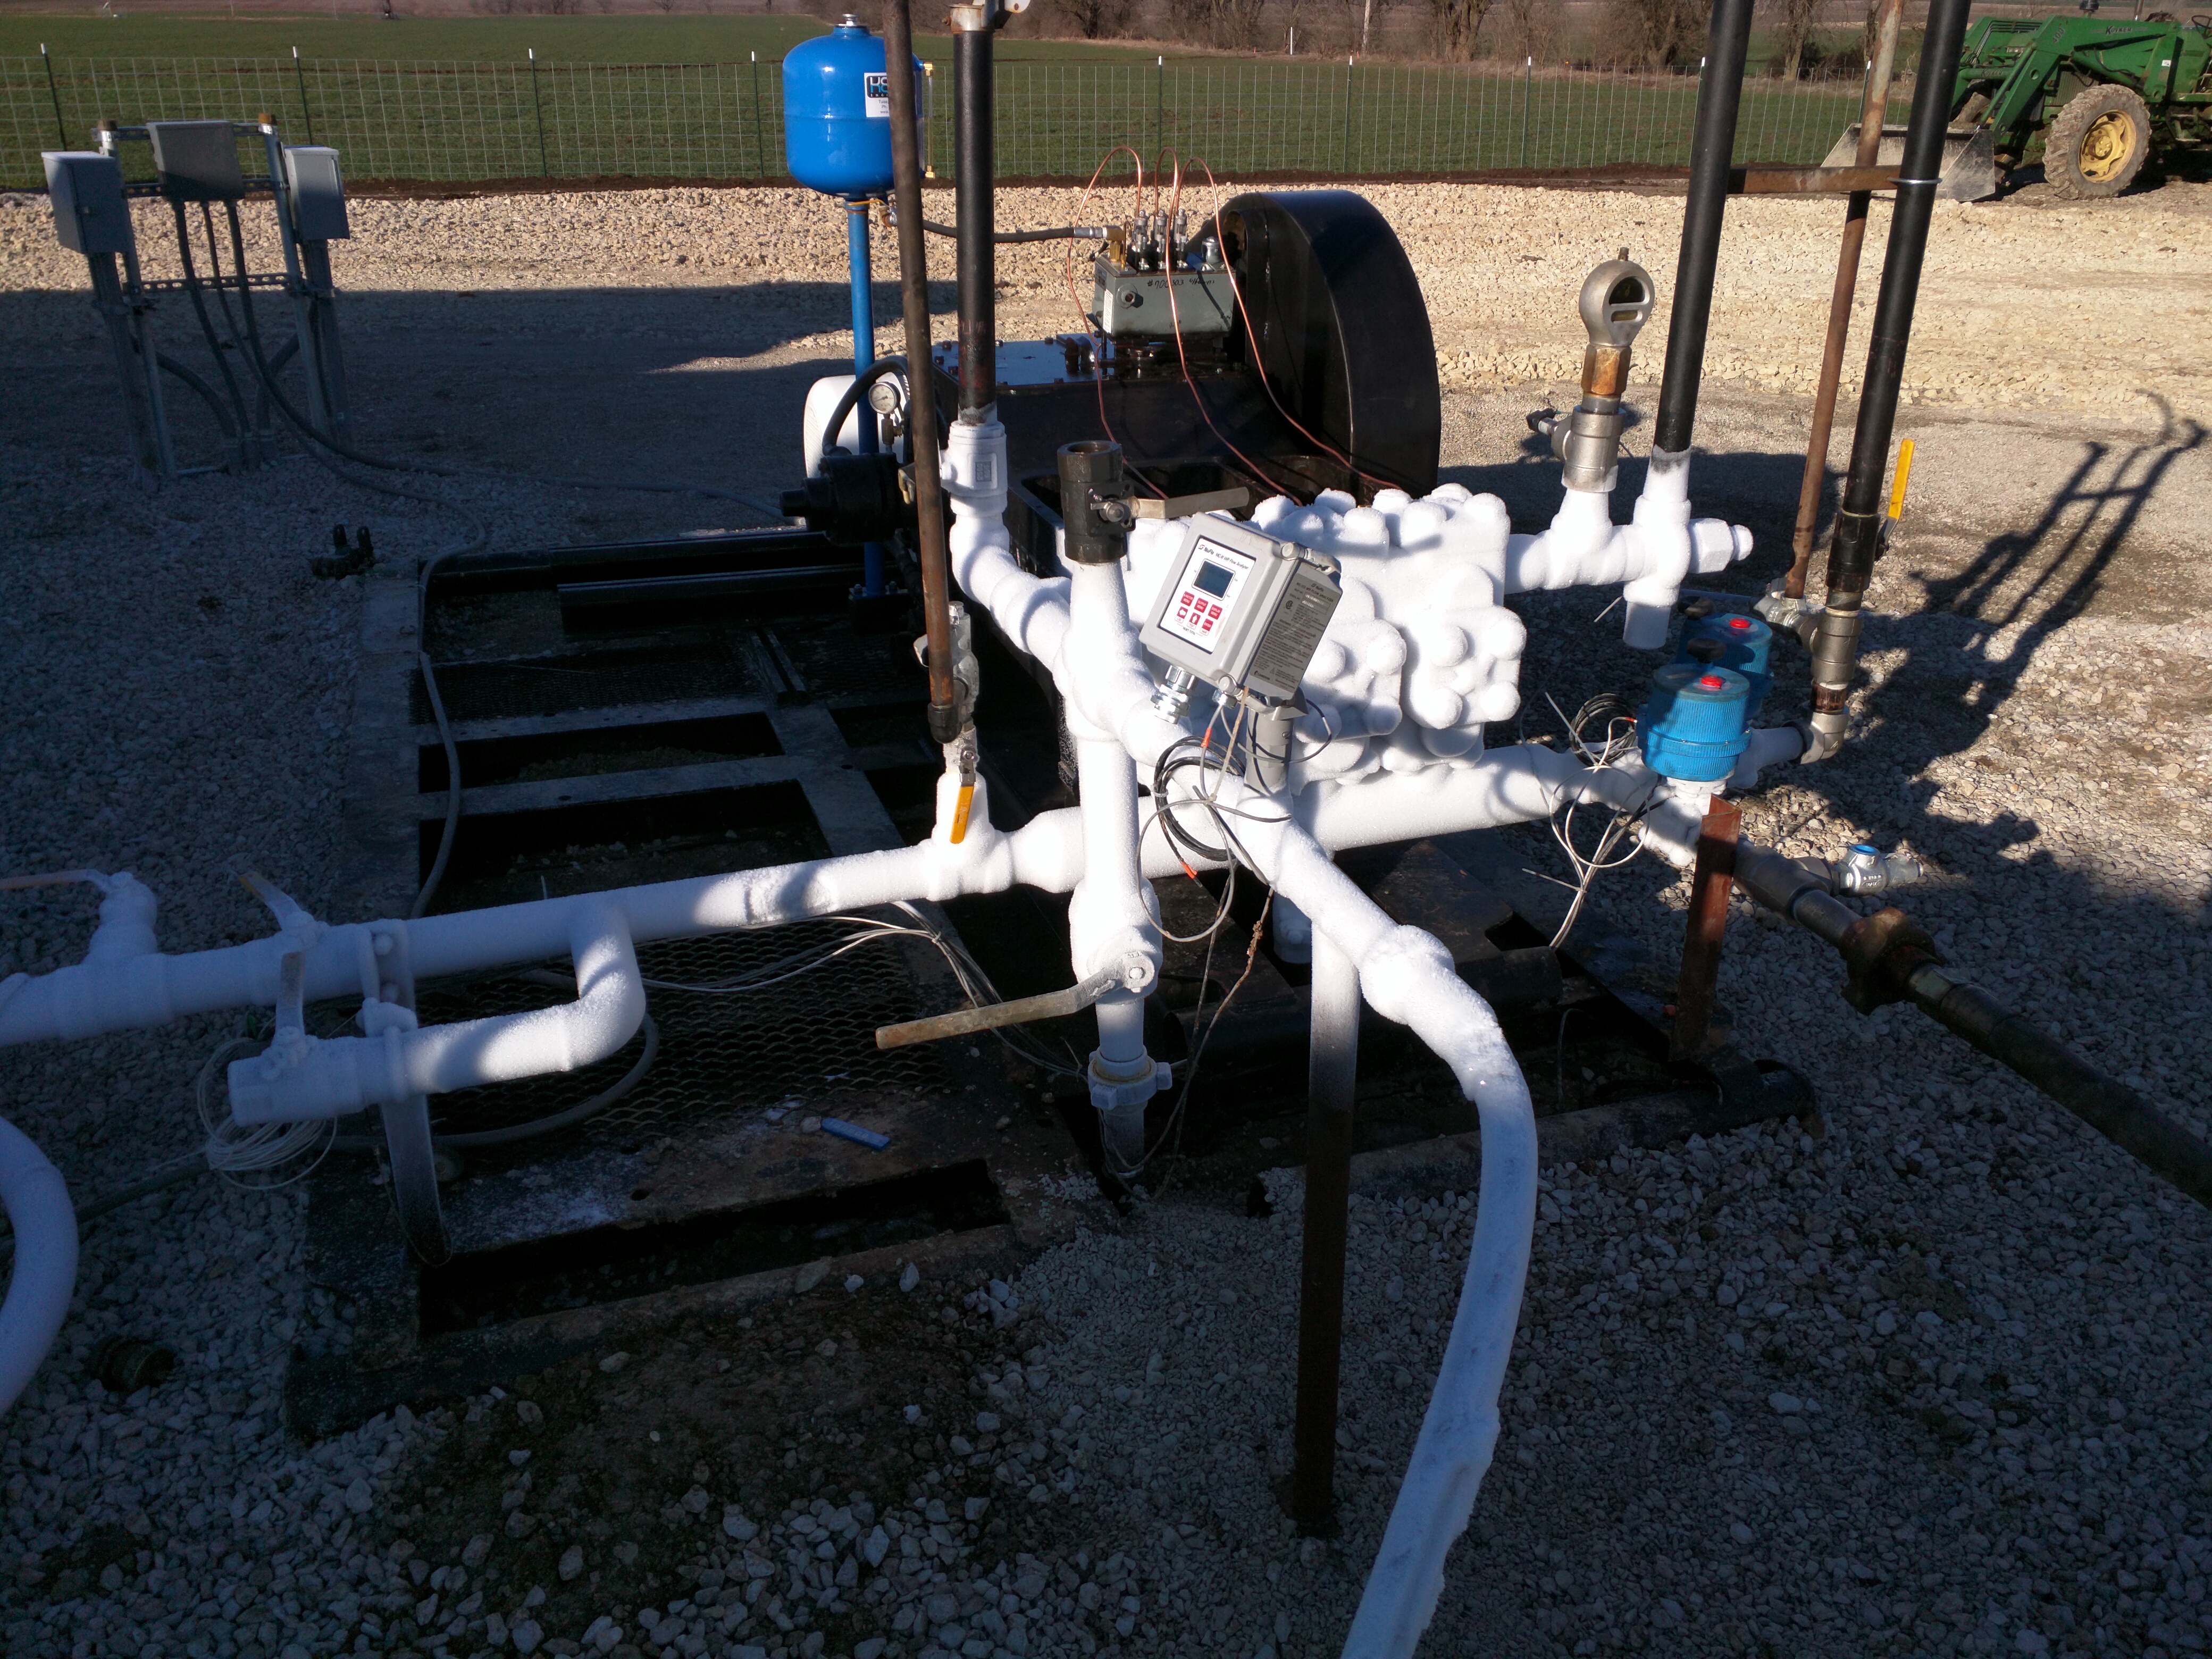
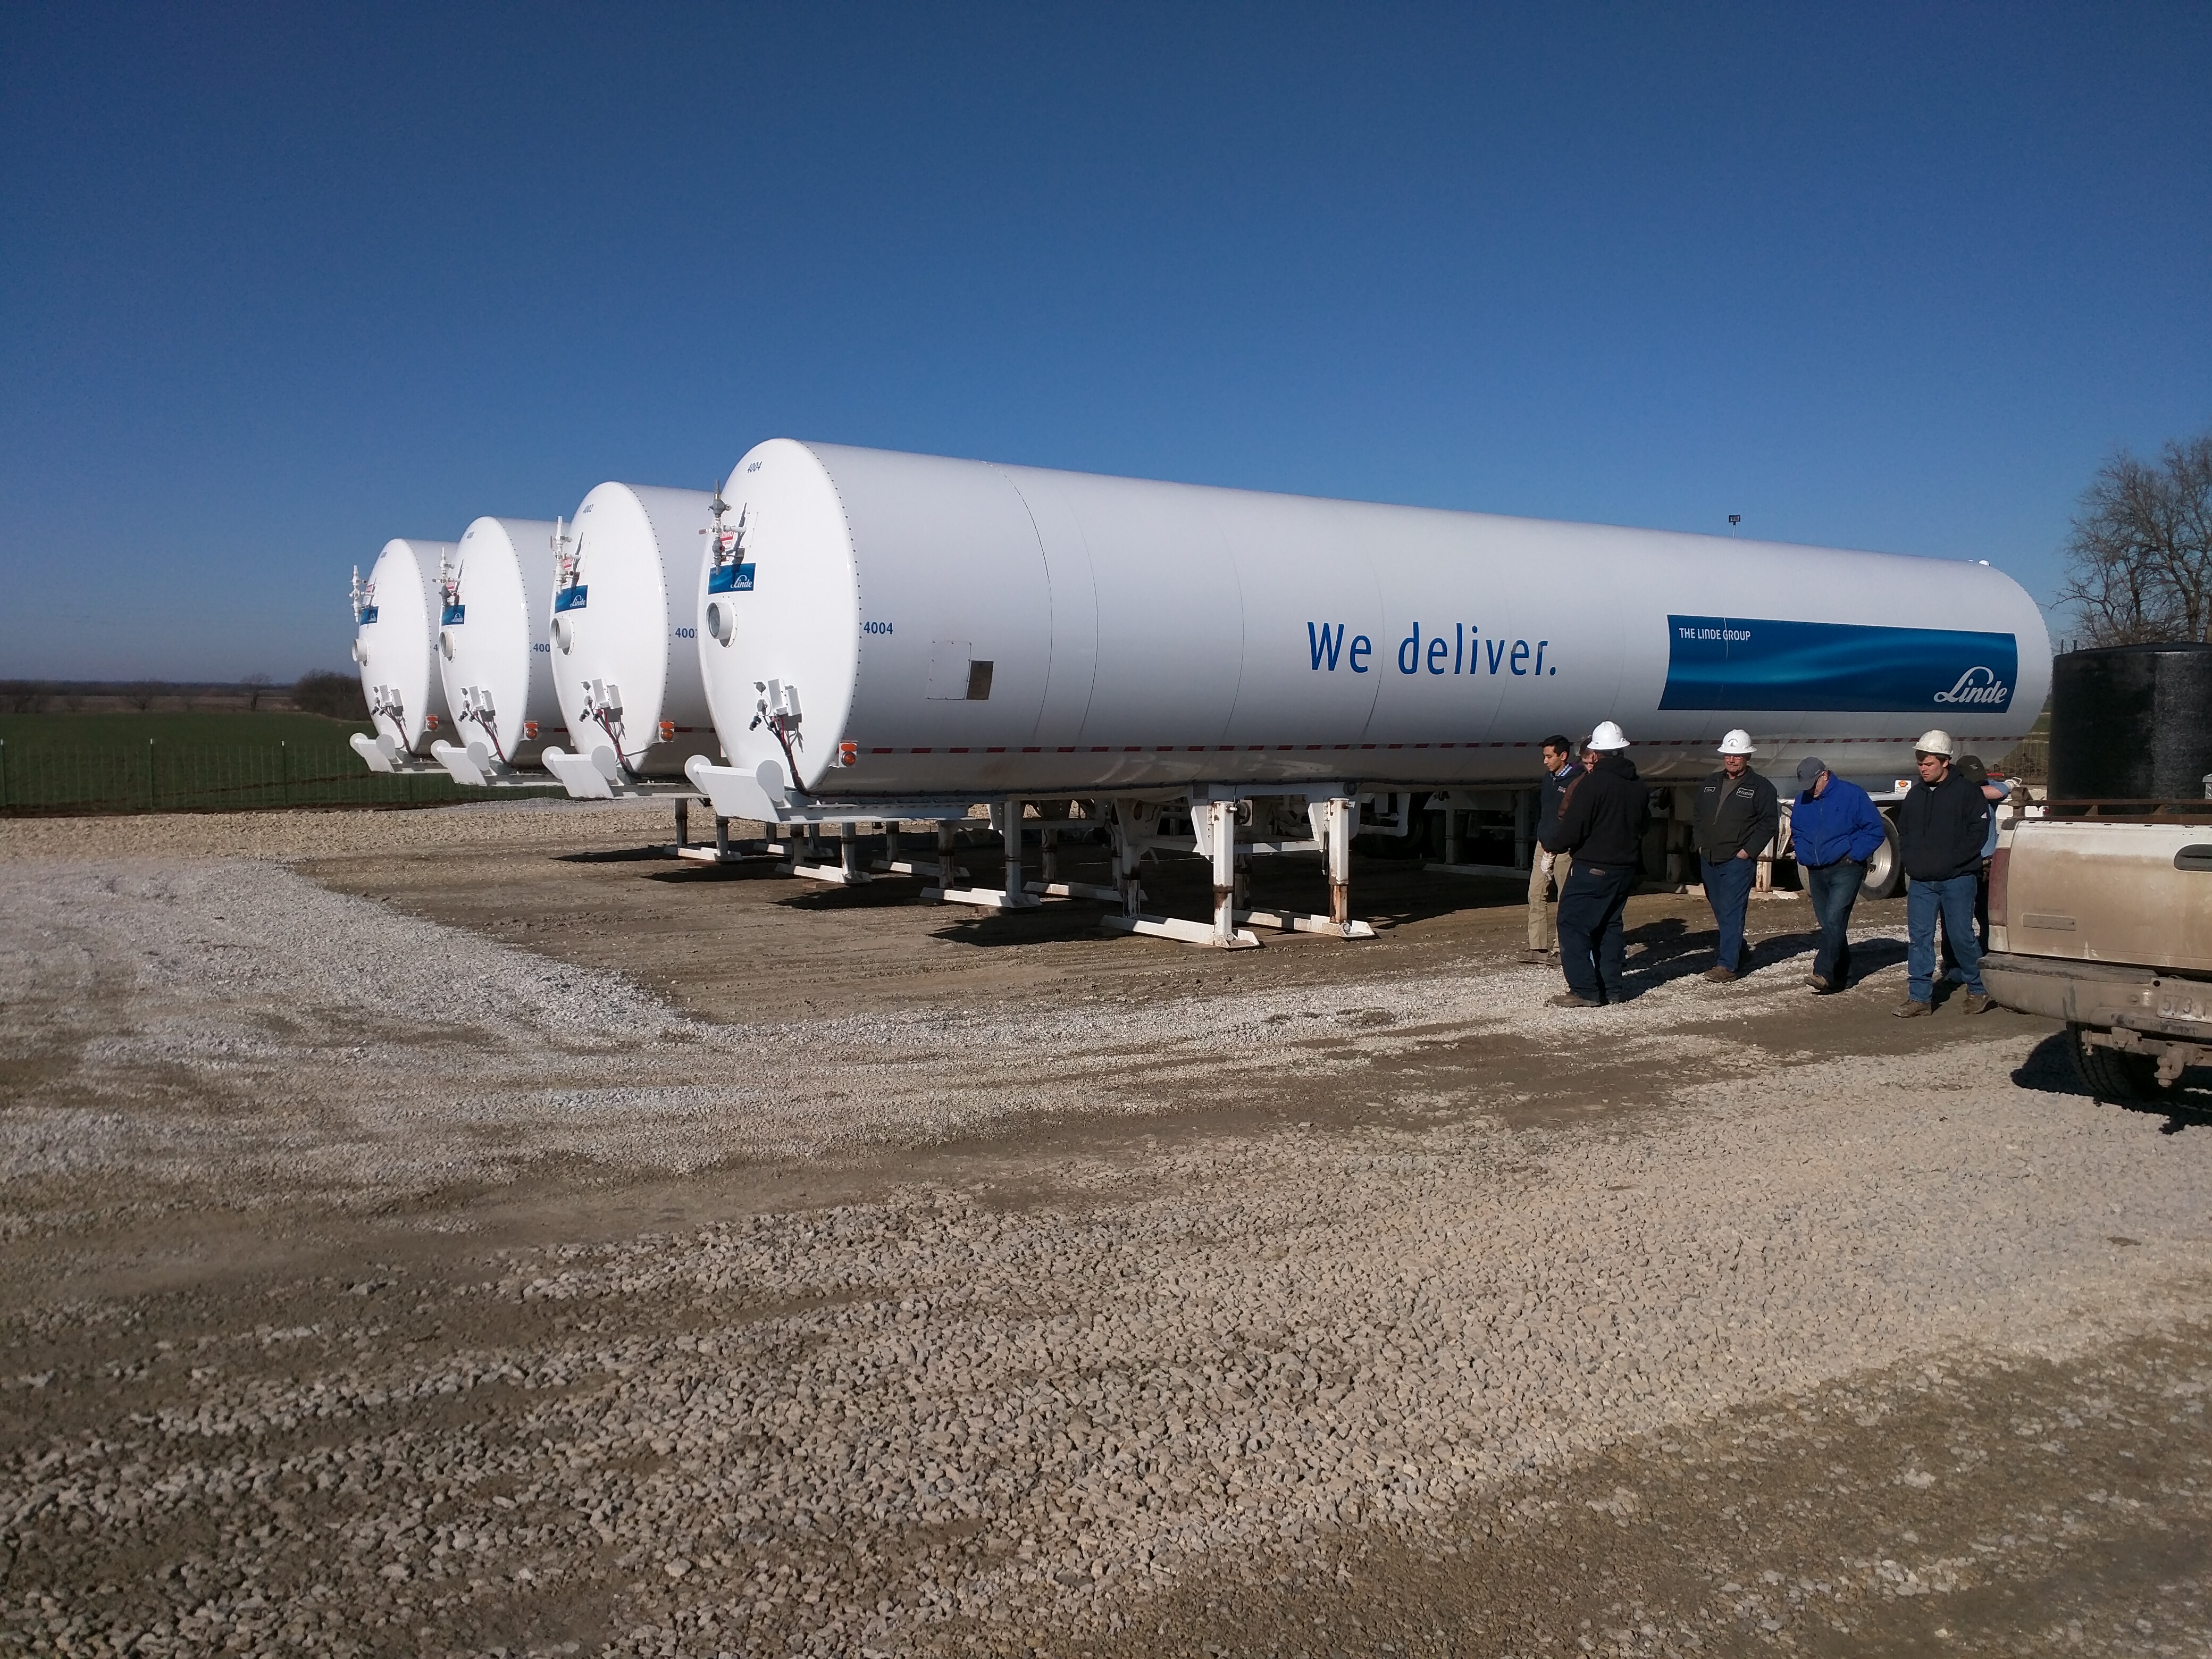
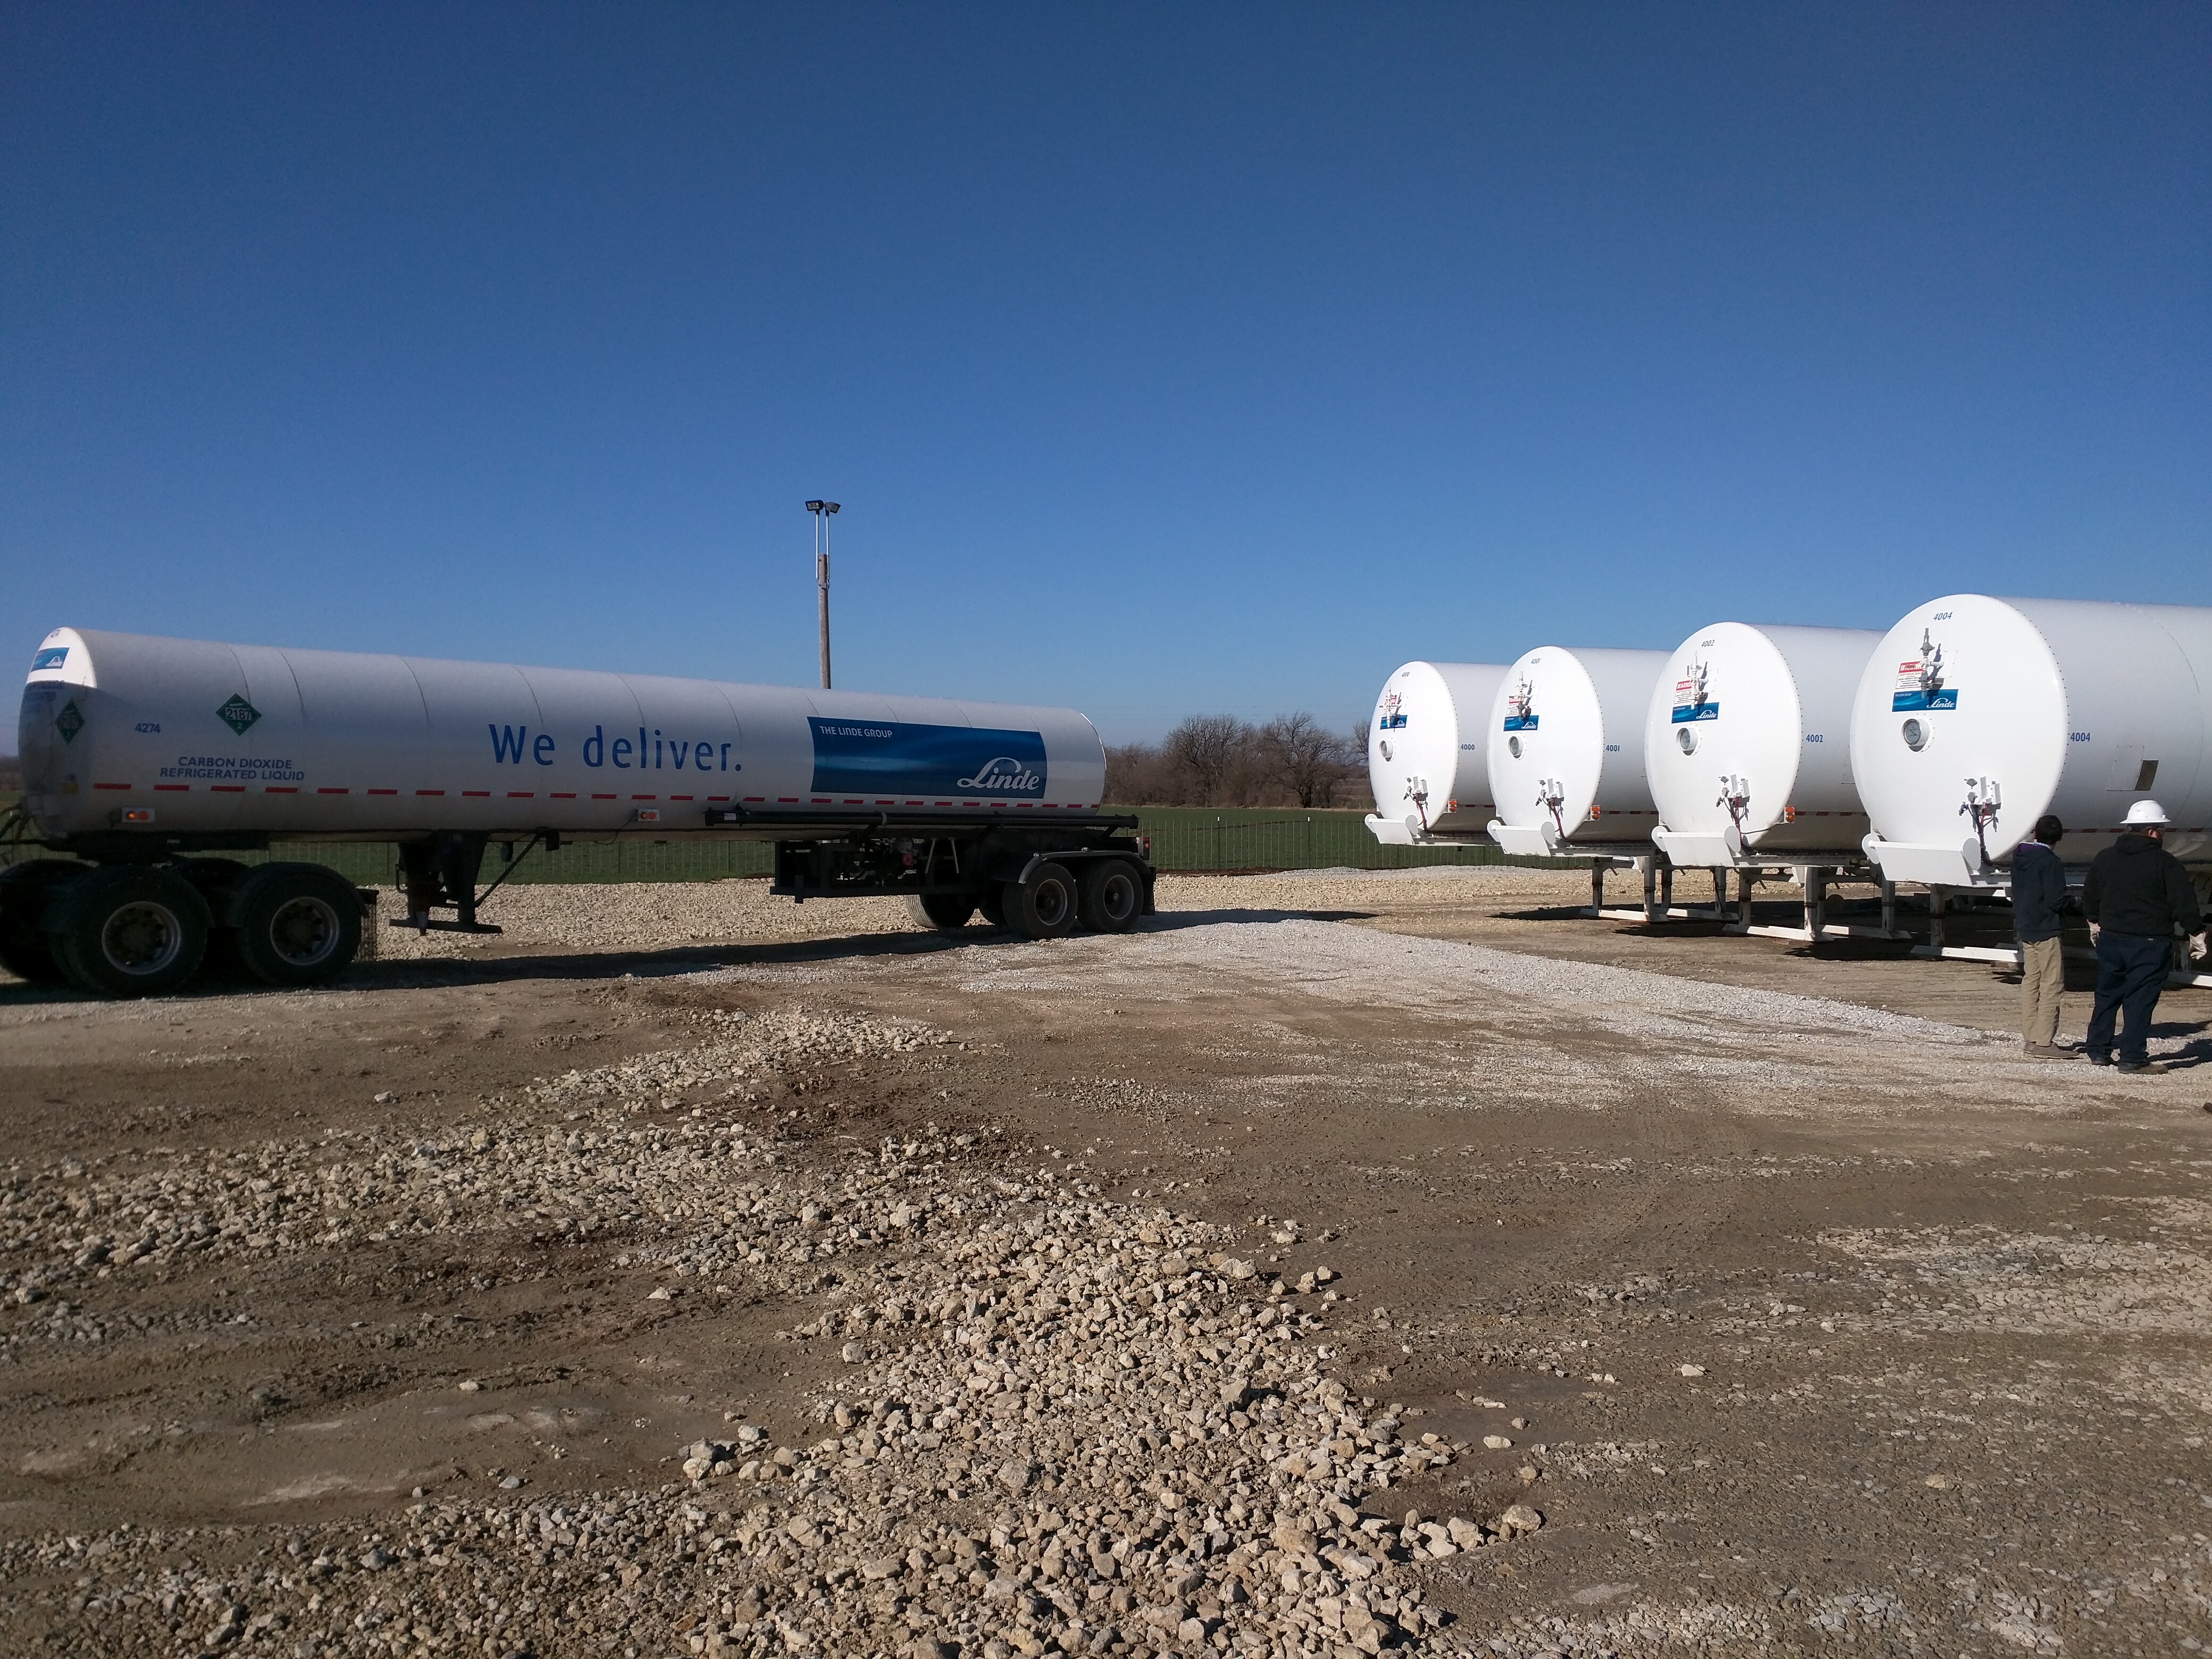
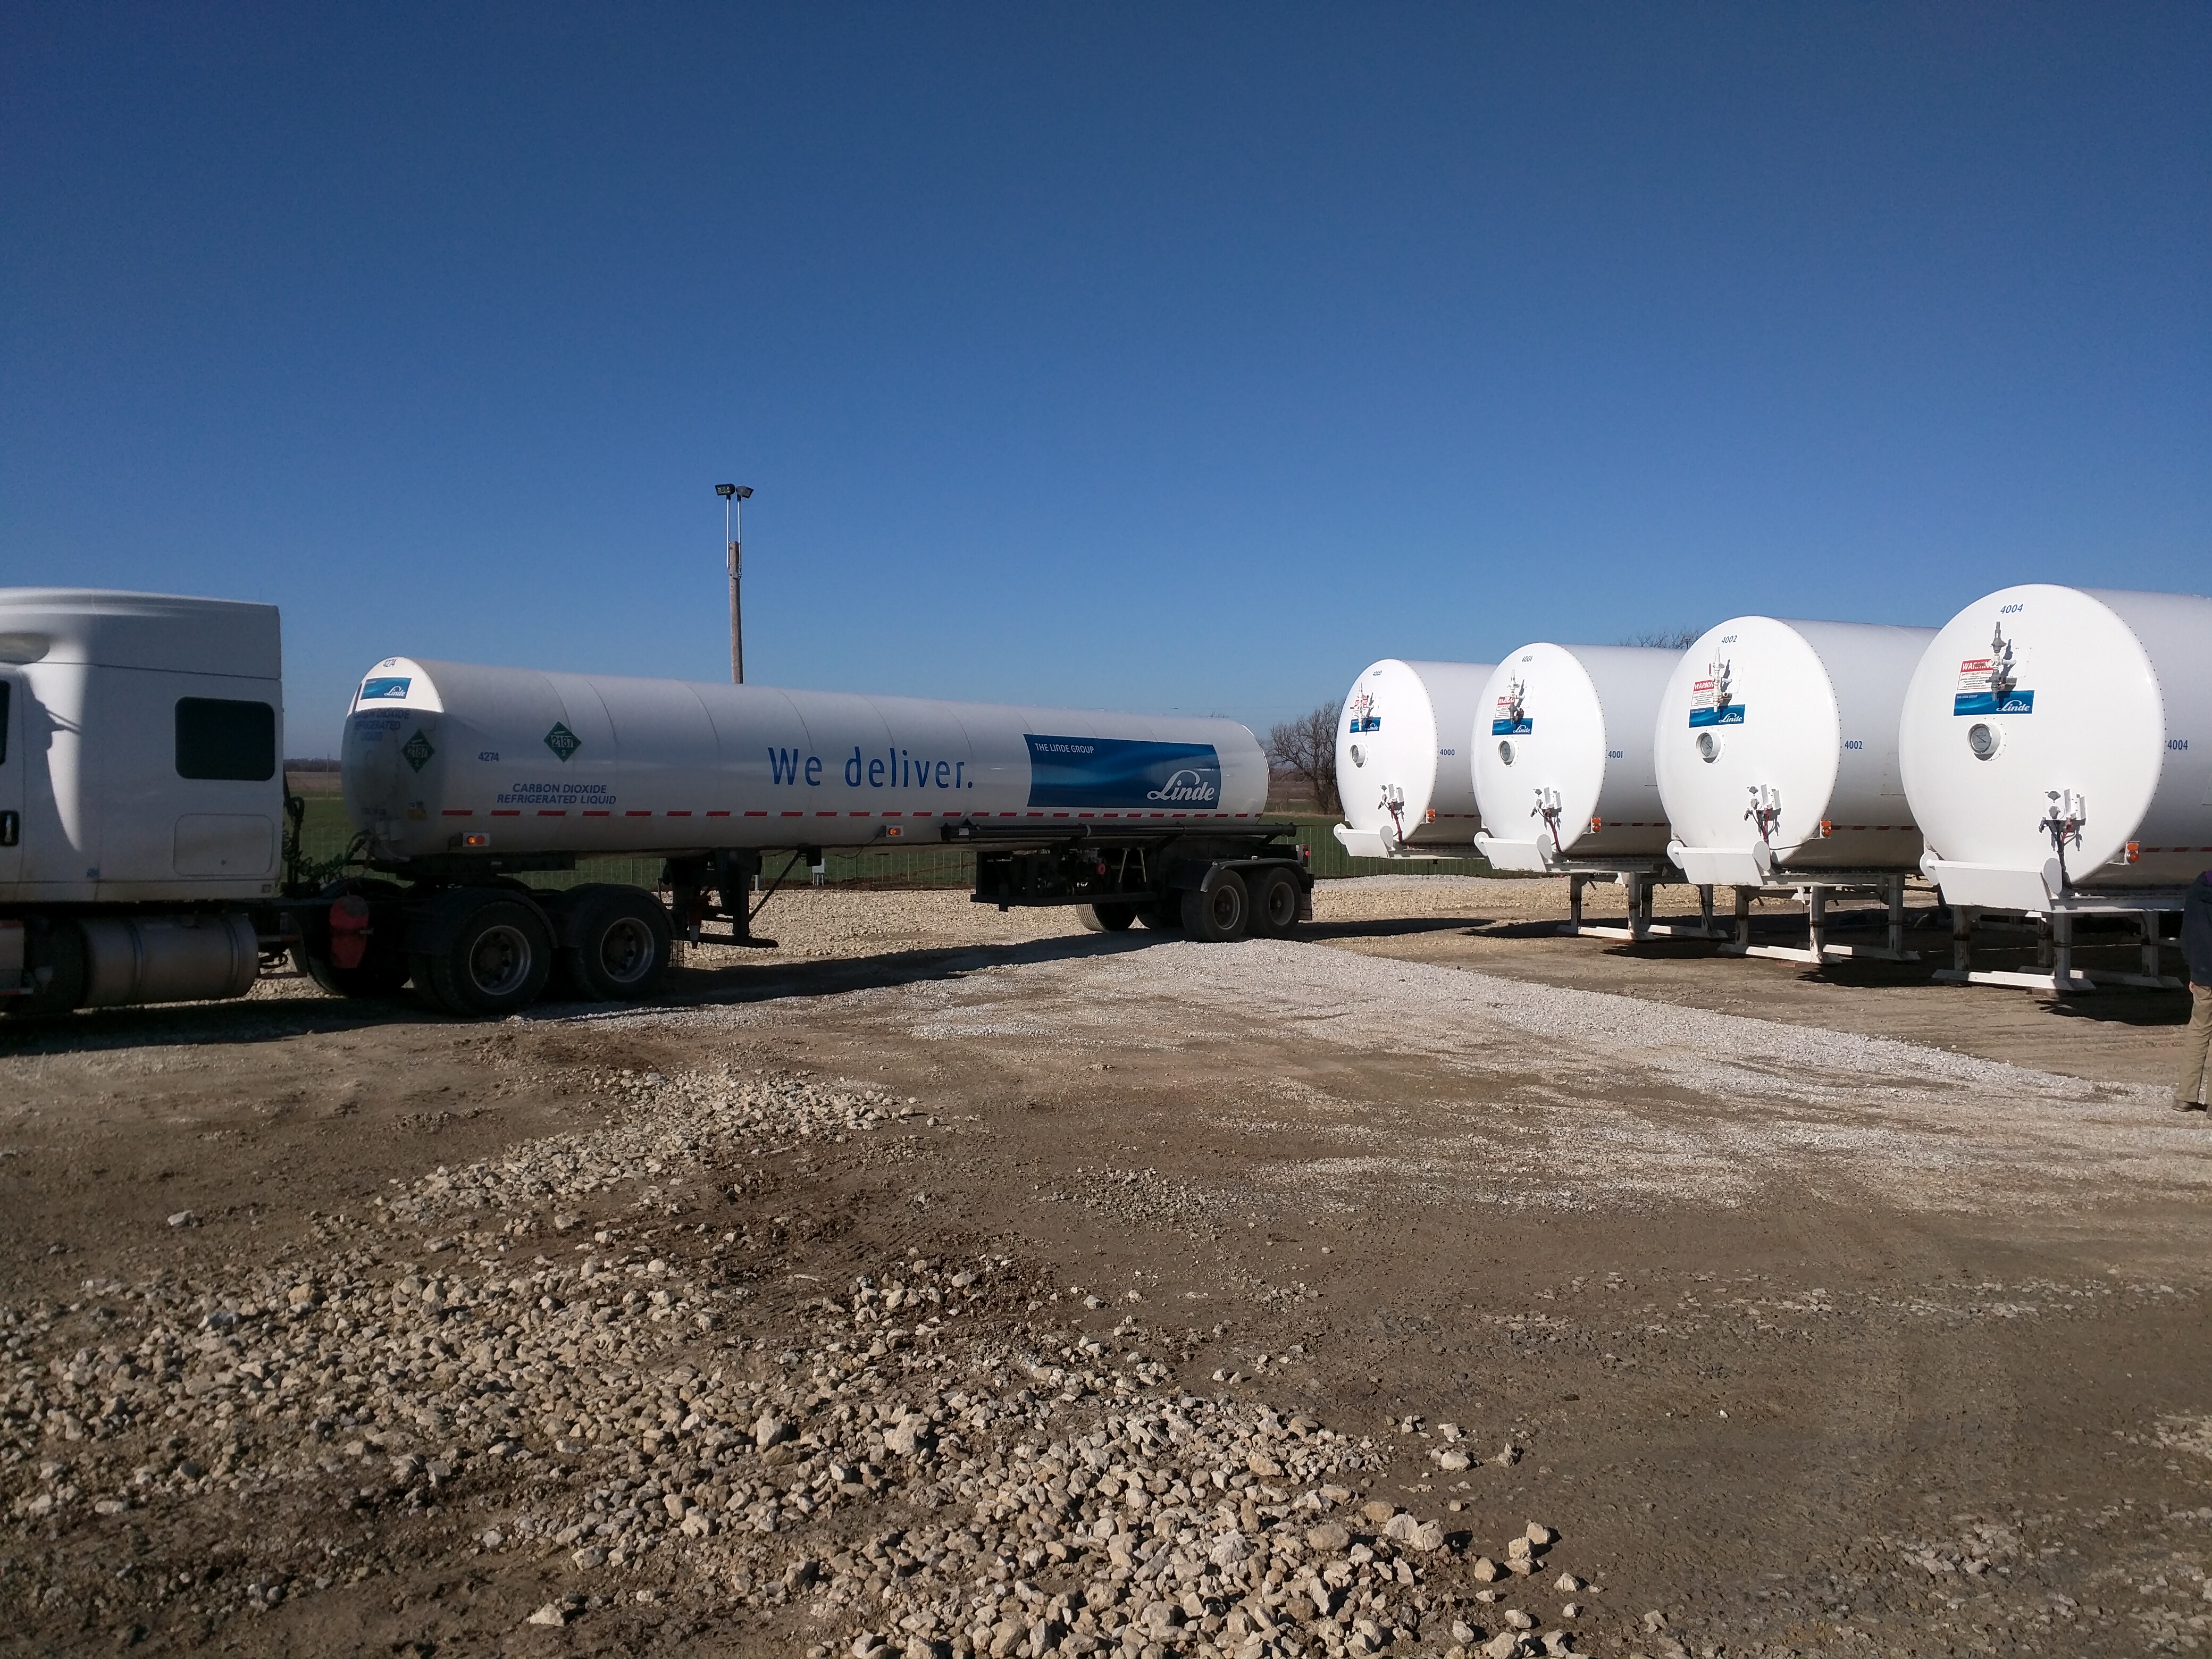
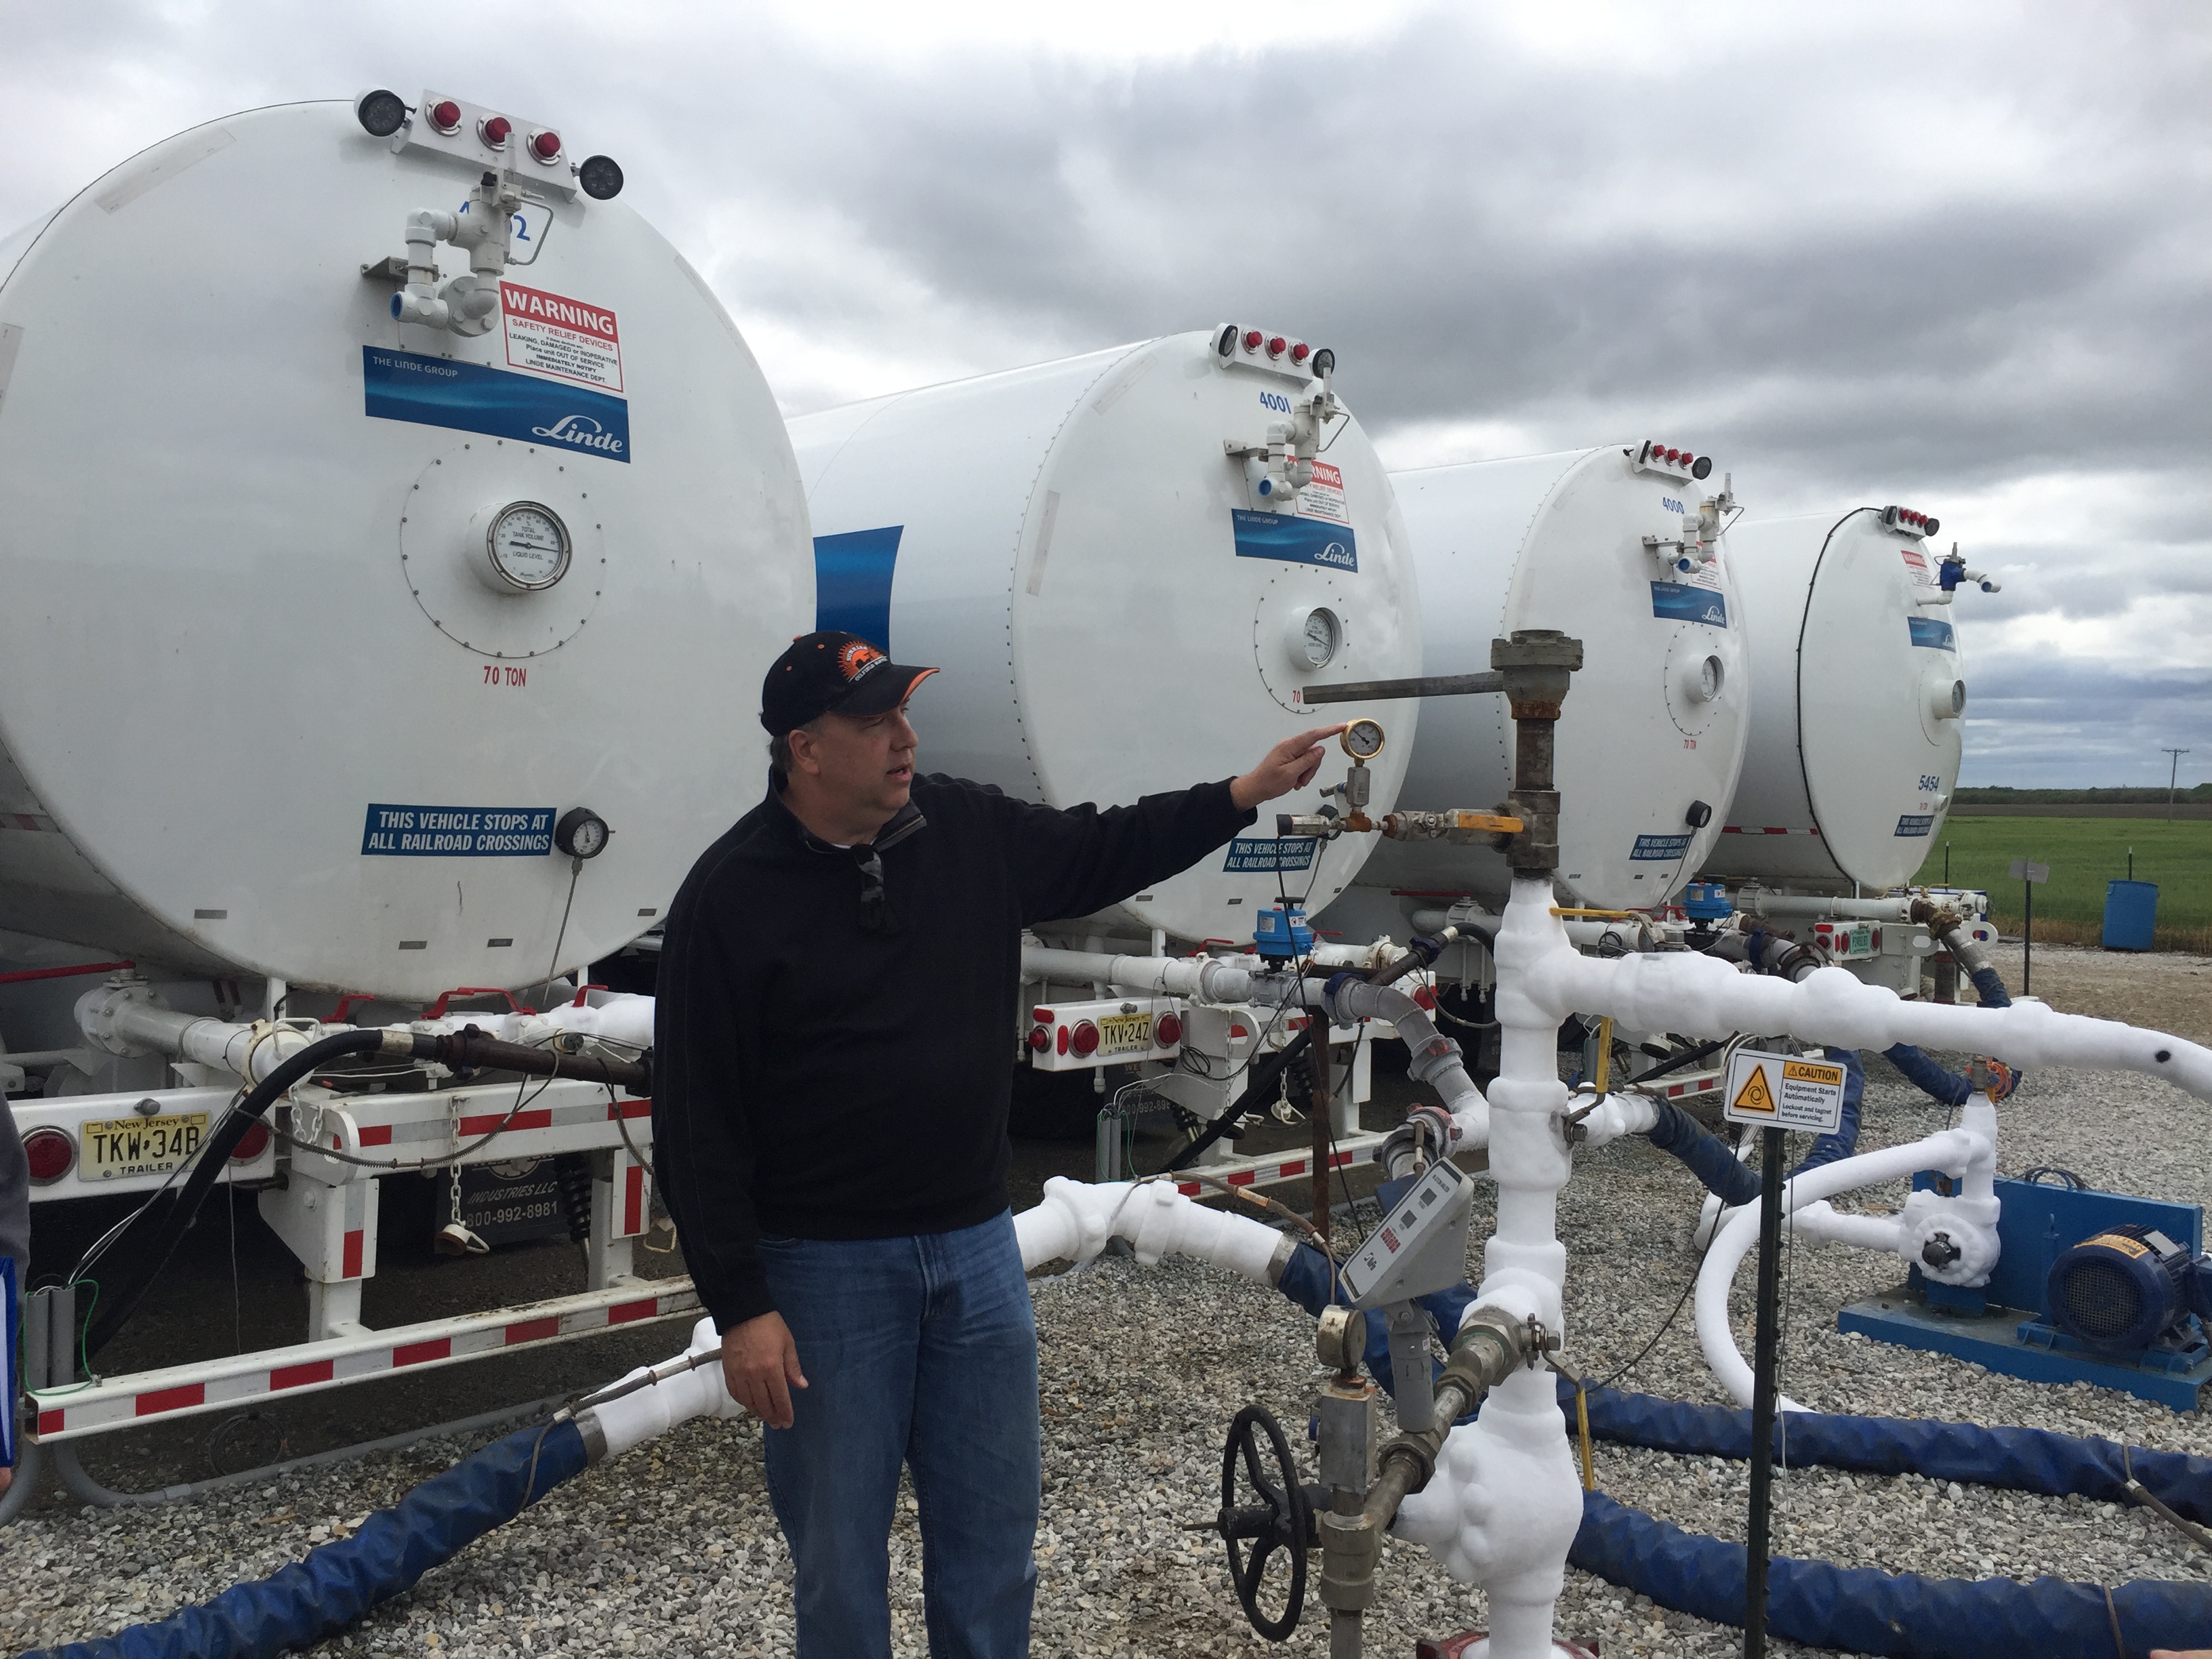
Dana Wreath walks through the journey of CO2 as it travels from one of the six on-site storage tanks down to the Mississippian reservoir through the KGS 2-32 well head. Throughout this process, he stops to note a number of gauges and meters that have been installed to monitor temperature, pressure, and other important data that will be used to evaluate the CO2 injection.

Adam Beren gives closing remarks to the group, reminding the students that Berexco promotes its outreach program by offering internships to many current and graduating KU Petroleum Engineering students each year.

CO2 Injection Photos

April 4, 2016

Jason Bruns and Charlie Miller with Berexco inspecting the CO2 lines at the KGS 2-32 injection well site. Note the frost on the pipelines due to the cold temperature of the CO2.

Inspecting the CO2 lines at the KGS 2-32 injection well site.

Testing the pressure bleed-off valves for CO2 lines.

Testing the pressure bleed-off valves.

Next test of the bleed-off valve for high pressure CO2, which is offset from the well site for safety precautions.

Next test of the bleed-off valve for high pressure CO2

View of the Spoc control panel system that regulates pressures and injection rates of the CO2 injection well. All data is recorded and transmitted digitally over cellular networks to a shared database for real-time monitoring purposes.

View of the Spoc control panel system that regulates pressures and injection rates of the CO2 injection well.

Field crew taking readings for CO2 percent composition of vented gas at Wellington Unit #61.

Field crew taking readings for CO2 percent composition of vented gas at Wellington Unit #61.

Example of CO2% composition analyzer. Vented gas was reading approximately 100% CO2 at well #61.

Example of CO2% composition analyzer.

Jason Bruns conducting an oil cut measurement at wellington unit #61. The sharp increase in oil cut is believed to be due to the ongoing CO2-EOR injection.

Conducting an oil cut measurement at wellington unit #61.

Berexco field crew conducting a fluid level measurement test with an echometer at wellington unit #61. Measurements are recorded biweekly to monitor pressure fluctuations and changes in the Mississippian formation, which is the target producing reservoir in the CO2-EOR flood.

Berexco field crew conducting a fluid level measurement test with an echometer at wellington unit #61.

Output from the echometer, which is used to determine fluid levels in each well.

Output from the echometer, which is used to determine fluid levels in each well.

Dana Wreath speaks with a CO2 delivery truck driver. The driver explained the process he follows when transferring CO2 to one of the 5 storage tanks on-site. Each delivery takes approximately 30 minutes, with trucks arriving periodically throughout the day.

Driver explained the process he follows when transferring CO2 to one of the 5 storage tanks on-site.

Dana Wreath introduces one of two tank batteries that collected produced fluids from Wellington Field wells. The yellow gas separator column collects and measures volumes of produced CO2 along with any natural gas.

One of two tank batteries that collected produced fluids from Wellington Field wells.

Brent Campbell (left) demonstrates his procedure for sampling and filtering the produced brines from each of the key wells involved in the CO2-EOR flood. Measurements including pH, alkalinity, and TDS are taken in the field with probes to be compared with laboratory results at a later time. Approximately 17 wells and 2 stock tanks are being analyzed for geochemical data.

Procedure for sampling and filtering the produced brines from each of the key wells involved in the CO2-EOR flood.

The team observes measurements being taken at unit #35.

Team observes measurements being taken at unit #35.

% CO2 composition reading of vented gas.

%CO2 composition reading of vented gas.

Jason Bruns and Brett Blazer with Berexco explain the methodology to determine oil cut at unit #35. Here, Jason shows that only a film of oil is present in the sample, indicating little to no oil production. This is consistent with the low concentration of CO2 that was detected for the well.

Explaining the methodology to determine oil cut at unit #35.

28.54) Dana Wreath and KGS staff stand around the future site of the Arbuckle CO2 injection well. This activity is currently awaiting approval of a EPA Class VI permit application that was submitted June 2014.

Future site of the Arbuckle CO2 injection well.

Berexco crew resumes injection in unit #55 per guidance from engineers to enhance the CO2-EOR flood. Field pressures are highly controlled throughout Wellington Field due to Berexco's ability to adjust production and injection rates as necessary to enhance the CO2 flood.

Berexco crew resumes injection in unit #55 per guidance from engineers to enhance the CO2-EOR flood.

CO2 Injection Photos

March 17, 2016

These photos were taken in March 2016. The photos are of the new East Nelson tank battery, gas separator, and meter that were installed in Wellington Field to account for the enhanced oil production and to monitor produced gases from the CO2 injection.

New tanks for production from CO2 injection project

New tanks for production from CO2 injection project

New meter for monitoring CO2 injection

New meter for monitoring CO2 injection

CO2 Injection Photos

Jan. 13, 2016

These photos were taken on January 13th, 2016 at the site of the ongoing Mississippian CO2-EOR injection near Wellington, Kansas. As of January 13th, approximately 1,600 barrels of CO2 were injected into the Mississippian well.

Dana Wreath, V.P. of Berexco, addressing field crew from Berexco and Linde about the intended injection. The SW corner of the yard shown in the photo will be used to house 2 more portables provided by Linde. If existing storage tanks are full, these will be used as overflow for additional deliveries. The CO2 supply is coming primarily from Enid and Woodward, OK.

Dana Wreath, V.P. of Berexco, addressing field crew from Berexco and Linde about the intended injection.

CO2 transfer pump from Linde delivery truck to on-site storage tanks.

CO2 transfer pump from Linde delivery truck to on-site storage tanks.

North side of the facility area. Shows plenty of space for trucks to move in and out.

North side of the facility area. Shows plenty of space for trucks to move in and out.

Photo of the main control screen of the Spoc controller for the CO2 injection monitoring. All monitoring data will be web accessible to the crew to evaluate the operation in real time.

Photo of the main control screen of the Spoc controller for the CO2 injection monitoring.

Internal components of the CO2 meter. On bottom left there's a cylindrical silver metal data port where all data can be accessed, downloaded, and saved. Hookup involves a common cable for data transfer with usb cable on other end.

Internal components of the CO2 meter.

NuFlo meter display for CO2 injected at KGS 2-32. This image shows about a 10 truck per day rate (1 truck is ~110-120 bbls liquid volume).

NuFlo meter display for CO2 injected at KGS 2-32.

Picture of the triplex pump system. Includes a round high pressure analog gauge right on the pump to display tubing pressure. Gray unit on top with copper wires is to lubricate the pump.

Picture of the triplex pump system.

Silver line coming out of ground on left is the water line coming out of the well. The water line is shut off in this photo. Water flood water line has max pressure of only around 400 psi. Have separate metering for water and CO2. Water is available from a separate tank for emergencies to inject water down the well at high pressure (water can be injected with the triplex pump at ~2500 psi).

Silver line coming out of ground on left is the water line coming out of the well.

Back of a Linde storage tank. Electronic control valves that are operated by the controller (in blue). Circular gauge shows the liquid percentage that the tank is full.

Back of a Linde storage tank.

Shows overall injection and monitoring setup: 3 of 4 storage tanks, pump, etc. Spoc control panel in back by the fence.

Shows overall injection and monitoring setup: 3 of 4 storage tanks, pump, etc.

Another view of setup. At wellhead, the master shutoff valve, white CO2 line at top right, high pressure ball valve if need to hook a truck up. Pressure transducer at top of pole (gray circular device). Blue device on ground in the center is the charge pump--cannot exceed more than ~350 psi (takes liquid out of storage tanks and pumps to the triplex pump, where it is then sent down the well).

Another view of setup. At wellhead, the master shutoff valve, white CO2 line at top right, high pressure ball valve if need to hook a truck up.

Another picture of the CO2 flow meter.

Another picture of the CO2 flow meter.

Another view of same setup.

Another view of same setup.

Centrifugal pump.

Centrifugal pump.

Photo of Jason Bruns, field operations with Berexco, looking at back of storage tanks. Operations do not require hearing safety equipment or specialized gear.

Photo of Jason Bruns, field operations with Berexco, looking at back of storage tanks.

Little black labels on tanks--distinguish between vapor and liquid CO2. Tied into the storage tanks either at top or bottom. Can optionally pull liquid or vapor from tanks. When drivers arrive, they can clearly see which tanks are lowest liquid levels. If any individual tank gets below 10% liquid, the blue control valve closes.

Little black labels on tanks--distinguish between vapor and liquid CO2.

Shows 4 Linde storage tanks, injection trucks are behind them.

Shows 4 Linde storage tanks, injection trucks are behind them.

Shows a delivery truck from Woodward, OK, backing up to the left storage tank.

Shows a delivery truck from Woodward, OK, backing up to the left storage tank.

Shows a delivery truck from Woodward, OK, backing up to the left storage tank.

There is a small centrifugal pump under the center of the truck that pumps it to the tank. Any gas in the lines is vented out until liquid is present, then pumps out. Tanks have a liquid level on the front and back. Tanks are higher on the loading side so the liquid runs down to side we pump from. The levels are about 10-15% different depending on the side where the meter is being read.

A Linde driver uses two hoses to connect to the CO2 storage tank. One for liquid and one for vapor return.

CO2 Arrival

Dec. 18, 2015

Photos show the delivery of the first CO2 storage tank from Linde (the primary CO2 supplier) that arrived at the KGS 2-32 CO2-EOR Mississippian injection well on December 18, 2015. We expect to start injecting CO2 in early January 2016.

First delivery of CO2 for Wellington KGS Well 2-32

First delivery of CO2 for Wellington KGS Well 2-32

About...

South-central Kansas CO2 Project is a DOE-funded project of the Kansas Geological Survey. More ...

Topics...