![]()
Prev Page--General Geology || Next Page--Utilization
Ground Water
Principles of Occurrence
The following discussion of the occurrence of ground water has been adapted from Meinzer (1923) and the reader is referred to his report for a more detailed discussion. A general discussion of the principles of ground-water occurrence with special reference to Kansas has been presented by Moore and others (1940).
Hydrologic Properties of Water-Bearing Materials
The rocks that make up the crust of the earth generally are not solid but have many openings, called voids or interstices, which may contain air, natural gas, oil, or water. The many kinds of rocks differ greatly in the number, size, shape, and arrangement of their interstices; therefore, the occurrence of water in any region is determined by the geology of the region.
The interstices or voids in rocks range in size from microscopic openings to the huge caverns found in some limestones. The porosity of a rock is expressed quantitatively as the percentage of the total volume of the rock that is occupied by interstices or that is not occupied by solid rock material. Uncemented deposits of gravel having a uniform grain size have greater porosity than deposits made up of a mixture of sand, clay, and gravel, in which the smaller particles occupy space between adjacent large particles. Relatively soluble rock such as limestone, though originally dense, may become cavernous as a result of the removal of part of its substance through the solvent action of percolating water. Hard, brittle rock may acquire large interstices through fracturing that results from shrinkage or deformation of the rocks or through other agencies.
The permeability of a rock is its capacity for transmitting water under pressure and is measured by the rate at which the rock will transmit water through a given cross section under a given difference of head per unit of distance. The permeability of water-bearing material generally is expressed as a coefficient of permeability, which is commonly defined by the U.S. Geological Survey as the number of gallons of water per day at a temperature of 60 deg. F that will be conducted through each mile of the water-bearing bed under investigation, measured at right angles to the direction of flow, for each foot of thickness of the bed and for each foot per mile of hydraulic gradient. The quantity of water that will percolate through a given cross section of water-bearing material under a known hydraulic gradient is directly proportional to the coefficient of permeability. Thus, to compute the quantity of water that will percolate into or out of a given area the permeability must be determined.
Coefficients of permeability have a wide range in value. Clay and silt, which are fine grained, may have moderate porosity but only slight permeability; a coarse-grained sand may have less porosity but much greater permeability, i.e., a greater ability to transmit water. Coefficients of permeability of less than 100 gallons per day per square foot are regarded as low, coefficients of 100 to 1,000 are medium, and those of more than 1,000 are high.
The coefficient of transmissibility is equal to the field coefficient of permeability (same as the coefficient defined above, except that it is for the prevailing temperature of the ground water) multiplied by the saturated thickness of the aquifer (water-bearing material) in feet. The coefficient of transmissibility and the coefficient of permeability are discussed further in the section on aquifer tests.
The specific yield of a rock or soil is the ratio of (1) the volume of water it will yield by gravity after being saturated to (2) its own volume. This ratio is stated as a percentage. The specific retention of a rock is the ratio of (1) the volume of water it will retain against the pull of gravity after being saturated to (2) its own volume.
Classification of Subsurface Water
The permeable rocks that lie below a certain level are generally saturated with water under hydrostatic pressure, and such rocks are said to be in the zone of saturation (Fig. 4). The zone of saturation ordinarily extends down to a depth much greater than is reached by modern drilling methods. The term ground water is used to designate that part of the subsurface water within the zone of saturation. The upper surface of the zone of saturation, where not formed by an impermeable body, is called the water table. In most places there is only one zone of saturation, but in certain localities the water may be hindered in its downward course by an impermeable or nearly impermeable bed to such an extent that it forms an upper zone of saturation, or perched water body, which is not associated with the lower zone of saturation.
Figure 4--Diagram showing divisions of subsurface water (after O.E. Meinzer).
Subsurface water above the water table is in the zone of aeration, which ordinarily consists of three parts: the belt of soil water, the intermediate belt, and the capillary fringe.
Soil water, which is water held by molecular attraction, lies just below the land surface and extends down to the maximum depth to which evaporation and plant action are effective. The soil water is not available to wells but is of the utmost importance to agriculture. Before any water can percolate downward to the water table through this belt, the amount of water present must exceed that which will be held by adhesion. The thickness of the belt of soil water is determined by the texture of the rock or soil and by the character of the vegetation.
The intermediate belt, which lies between the belt of soil water and the capillary fringe, is thick where the depth to the water table is great but may be absent where the water table is at or near the land surface. In this belt the interstices in the rocks contain some water held by molecular attraction but also may contain appreciable quantities of water that is moving downward from the belt of soil moisture to the water table.
The capillary fringe lies directly above the water table and contains water held above the zone of saturation by capillary force. The water in the capillary fringe is not available to wells, which must be deepened to the zone of saturation before water will enter them. The capillary fringe may be very thin in coarse-grained sediments, in which capillary action is negligible, or it may be several feet thick in fine-grained sediments.
The Water Table and Movement of Ground Water
Shape and Slope
The water table has been defined as the upper surface of the zone of saturation. The water table is not a static, level surface; generally it is a sloping surface having many irregularities and constantly changing. The irregularities are caused chiefly by local differences in geology and topography, and the fluctuations are due to gain or loss of water within the zone of saturation.
The generalized shape of the water table in Sumner County is shown in Plate 2 by contour lines. All points along a contour line have the same altitude, and the shape and slope of the water table are shown by the lines as the land surface is shown by topographic contours. Water moves downslope in a direction at right angles to the contour lines. The movement is very slow because of the frictional resistance offered by the small interstices through which the water must pass. The shape of the water table in Sumner County conforms in general to the land surface, but relief is much more subdued. In areas where conditions are suitable for rapid recharge, water may percolate down to the water table faster than it can spread laterally, thus a mound or ridge is formed in the water table. Conversely, if water is withdrawn from the zone of saturation faster than it can flow in laterally, the water is lowered locally, and a cone or trough is formed. The permeability of the water-bearing material has a significant effect upon the slope of the water table. To produce a given rate of flow, the slope of the water table must be much steeper in a fine-grained deposit having slight permeability than in a coarse-grained permeable deposit.
The slope of the water table in Sumner County ranges from considerably less than 10 feet per mile in the extremely permeable alluvium of Arkansas River to at least 40 feet per mile in the relatively impermeable Wellington Formation and Ninnescah Shale. Ground water in general moves toward the major streams. The water-table contours in Plate 2 are much more generalized in the areas where the Wellington Formation or the Ninnescah Shale is the chief aquifer, because fewer wells were inventoried in these areas. In the area west of Conway Springs the water table is in a sense perched, in that the water accumulates in the permeable sand and gravel faster than it can percolate downward through the relatively impermeable Ninnescah Shale. The underlying Ninnescah Shale, however, probably is completely saturated.
Fluctuations in Water Level
In general, the water table rises when the rate of recharge exceeds the rate of discharge and declines when the rate of discharge exceeds the rate of recharge. Changes in the water level in wells indicate fluctuations of the water table, and thus indicate whether the groundwater reservoir is being depleted or replenished.
An observation-well program was started in the Arkansas River valley near Mulvane in 1954; water-level measurements in these wells are shown in Table 4. Hydrographs showing fluctuations in several of the wells are given in Figures 5 and 6. T. Max Reitz has made periodic measurements in his irrigation well 31-2E-20acc since 1935, and fluctuations in water level in this well are shown in Figure 7 and Table 5.
Figure 5--Hydrographs showing fluctuations of water level in five wells in Mulvane area.
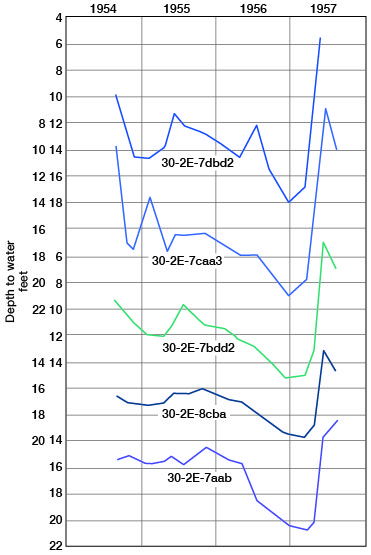
Figure 6--Hydrographs showing fluctuations of water level in three wells in Mulvane area, and monthly precipitation and cumulative departure from normal precipitation at Wichita.
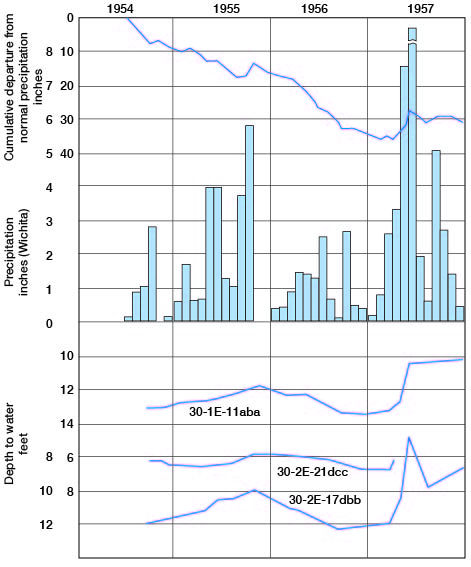
Figure 7--Hydrograph showing fluctuations of water level in well 31-2E-20acc.
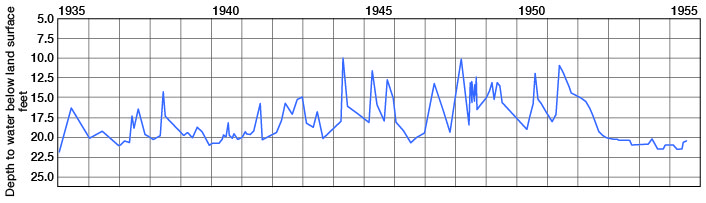
Table 5--Water levels in irrigation well 31-2E-20acc
| Date | Depth to water, feet |
Date | Depth to water, feet |
Date | Depth to water, feet |
|---|---|---|---|---|---|
| 1/1/1935 | 22.00 | 10/1/1940 | 19.50 | 3/1/1948 | 10.00 |
| 6/1/1935 | 16.00 | 11/15/1940 | 20.15 | 4/25/1948 | 16.00 |
| 12/1/1940 | 20.15 | 5/25/1948 | 18.33 | ||
| 1/1/1936 | 20.00 | 6/25/1948 | 13.00 | ||
| 6/1/1936 | 19.00 | 1/1/1941 | 19.83 | 7/14/1948 | 15.50 |
| 2/1/1941 | 19.15 | 7/30/1948 | 13.00 | ||
| 1/1/1937 | 20.90 | 3/1/1941 | 19.50 | 8/10/1948 | 15.00 |
| 2/1/1937 | 20.75 | 4/1/1941 | 19.50 | 8/20/1948 | 12.50 |
| 3/1/1937 | 20.15 | 5/1/1941 | 19.33 | 9/13/1948 | 16.50 |
| 4/1/1937 | 20.42 | 6/1/1941 | 19.00 | ||
| 5/1/1937 | 20.50 | 7/1/1941 | 17.25 | 1/1/1949 | 15.00 |
| 6/1/1937 | 17.00 | 8/1/1941 | 15.66 | 3/1/1949 | 13.00 |
| 7/1/1937 | 19.00 | 10/1/1941 | 20.08 | 4/1/1949 | 15.00 |
| 8/1/1937 | 16.00 | 5/20/1949 | 13.00 | ||
| 9/1/1937 | 17.00 | 3/1/1942 | 19.33 | 6/15/1949 | 13.50 |
| 10/1/1937 | 18.00 | 5/1/1942 | 17.50 | 7/1/1949 | 15.50 |
| 11/1/1937 | 19.33 | 6/1/1942 | 15.50 | ||
| 12/1/1937 | 19.50 | 7/1/1942 | 16.00 | 5/1/50 | 19.00 |
| 9/1/1942 | 17.00 | 7/1/50 | 15.50 | ||
| 1/1/1938 | 20.00 | 11/1/1942 | 15.00 | 8/1/50 | 12.00 |
| 2/1/1938 | 20.08 | 9/1/50 | 15.00 | ||
| 3/1/1938 | 19.92 | 1/1/1943 | 15.00 | 11/1/50 | 16.00 |
| 4/1/1938 | 20.08 | 2/1/1943 | 18.15 | ||
| 5/1/1938 | 19.58 | 4/1/1943 | 18.33 | 3/1/1951 | 18.00 |
| 6/1/1938 | 14.00 | 5/1/1943 | 18.66 | 4/15/1951 | 17.00 |
| 7/1/1938 | 17.25 | 6/15/1943 | 16.50 | 5/17/1951 | 11.00 |
| 8/1/1938 | 17.50 | 8/1/1943 | 19.00 | 7/8/1951 | 12.00 |
| 9/1/1938 | 18.00 | 9/1/1943 | 20.00 | 8/3/1951 | 13.00 |
| 10/1/1938 | 18.25 | 10/1/1951 | 14.50 | ||
| 11/1/1938 | 18.50 | 3/20/1944 | 18.00 | ||
| 12/1/1938 | 18.75 | 4/10/1944 | 16.00 | 1/1/1952 | 15.00 |
| 4/22/1944 | 10.00 | 3/1/1952 | 15.00 | ||
| 1/1/1939 | 19.25 | 6/1/1944 | 16.00 | 5/1/1952 | 16.00 |
| 2/1/1939 | 19.50 | 7/1/1952 | 18.00 | ||
| 3/1/1939 | 19.42 | 3/1/1945 | 18.00 | 10/1/1952 | 20.00 |
| 4/1/1939 | 19.33 | 4/15/1945 | 11.50 | ||
| 5/1/1939 | 19.50 | 6/1/1945 | 15.50 | 6/15/1953 | 20.50 |
| 6/1/1939 | 19.83 | 9/4/1945 | 18.00 | 8/27/1953 | 20.50 |
| 7/1/1939 | 18.50 | 10/1/1945 | 12.50 | 10/6/1953 | 21.15 |
| 8/1/1939 | 18.66 | 12/1/1945 | 15.00 | 11/7/1953 | 21.15 |
| 9/1/1939 | 19.00 | ||||
| 10/1/1939 | 19.50 | 1/15/1946 | 18.00 | 1/1/1954 | 21.15 |
| 11/1/1939 | 20.00 | 4/1/1946 | 18.50 | 4/5/1954 | 20.92 |
| 12/1/1939 | 20.83 | 5/1/1946 | 18.83 | 6/4/1954 | 20.08 |
| 6/15/1946 | 20.15 | 7/20/1954 | 21.00 | ||
| 1/1/1940 | 20.83 | 7/15/1946 | 20.58 | 8/15/1954 | 21.50 |
| 2/1/1940 | 20.66 | 10/1/1946 | 20.00 | 10/1/1954 | 21.66 |
| 3/1/1940 | 20.66 | 11/1/1954 | 21.08 | ||
| 4/1/1940 | 20.66 | 1/1/1947 | 19.50 | 12/31/1954 | 21.08 |
| 5/1/1940 | 20.00 | 4/15/1947 | 13.00 | ||
| 6/1/1940 | 19.50 | 5/10/1947 | 14.50 | 2/1/1955 | 21.00 |
| 7/1/1940 | 19.66 | 7/1/1947 | 16.00 | 4/1/1955 | 21.50 |
| 7/10/1940 | 18.00 | 9/21/1947 | 18.00 | 5/15/1955 | 21.50 |
| 8/1/1940 | 19.50 | 10/23/1947 | 19.50 | 6/1/1955 | 20.83 |
| 9/1/1940 | 19.92 | 8/1/1955 | 20.50 |
Interpretation of fluctuations in water levels is complicated by the interrelation of several factors. Declines in water level are caused by prolonged periods of deficient rainfall, by increased transpiration of plants, by increased evaporation, by increased pumping, and by seepage into streams. Rises in the water level may be caused by increased precipitation, by decreased transpiration and evaporation, by decreased pumping, and by seepage from streams. The factors affecting the water level are discussed in further detail in the sections on recharge and discharge.
Recharge
The amount of water in storage in the zone of saturation does not remain constant but fluctuates with the precipitation and rate of withdrawal. Recharge is the addition of water to the ground-water reservoir and may be accomplished in several ways.
All ground water in Sumner County originally fell as rain or snow within the county or in adjacent areas. Water reaches the zone of saturation in Sumner County by direct recharge from local precipitation, by recharge from streams and ponds, and by subsurface movement from outside the area.
Recharge from Local Precipitation
The normal annual precipitation in Sumner County is about 31 inches, but only a small part of this amount enters the zone of saturation as recharge to the ground-water reservoir. A large part of the precipitation is evaporated or is transpired by plants, and a small part leaves the county as surface runoff.
The relation of water levels to precipitation is illustrated by the hydrographs in Figures 5, 6, and 7. The initial abrupt decline of water level in some of the Mulvane wells is caused by the beginning of pumping of the El Dorado-Augusta Water Association wells. In this area generally, water levels declined in 1954, rose sharply in 1955 in those months when the precipitation was near or above normal, and declined in 1956 when precipitation was considerably below normal. Normal or above-normal precipitation in the spring of 1957 resulted in a sharp rise in water level in most observation wells, although pumping by the El Dorado-Augusta Water Association continued at a nearly uniform rate until May 15.
Percolation from Outside Areas
The movement of ground water into Sumner County is, in general, southeastward from Harper, Kingman, and Sedgwick Counties. There may be some movement westward in the westward-dipping Permian rocks, which are exposed at the surface in the area to the east, but not many wells in Sumner County obtain water from these rocks. The amount of water entering the county by subsurface movement probably is only slightly greater than the amount that leaves the county by this means.
Seepage from Streams and Ponds
Two factors governing the amount of water seeping into the ground-water reservoir from streams and ponds are (1) the level of the water in the stream or pond relative to the level of the ground water and (2) the character of the material between the stream channel or pond and the water table.
The water-table contours show that most streams in Sumner County are effluent (Fig. 8); that is, normally the streams receive water from the ground-water reservoir. During periods of flood, the water level in the streams is higher than the level of the ground water, hence water moves from the streams into the ground-water reservoir. In areas of local heavy pumping near a stream, the water table may be lowered to such an extent that the natural flow is reversed, and water moves from the stream into the groundwater reservoir. This is especially noticeable in the Chikaskia River valley at the Caldwell municipal wells. During periods of drought when Chikaskia River ceases flowing, the yield of the municipal wells is greatly decreased; when the river begins to flow again, the yield of the wells returns to normal although there may have been no local precipitation.
Figure 8--Diagrammatic sections showing influent and effluent streams (after O.E. Meinzer).
If the material between a stream channel or pond and the water table is relatively impermeable, the rate of downward percolation may be so slow that the amount of recharge by this means is negligible. The alluvium of Bluff, Slate, Salt, and Fall Creeks is relatively impermeable, and recharge from them would be small even though the water level in the streams might be high enough to permit recharge. The alluvium of Cowskin Creek and of Ninnescah, Chikaskia, and Arkansas Rivers is fairly permeable and would permit rapid recharge. A heavy coating of algae and contaminating material on the stream floor of Arkansas River undoubtedly impedes recharge from this stream considerably. Most farm ponds in Sumner County have been constructed purposely in relatively impermeable material so that recharge from them is small.
Discharge
Ground-water discharge is the removal, by any method, of water from the zone of saturation. Ground water in Sumner County is discharged by transpiration and evaporation, by seepage into streams, by wells, and by subsurface movement into adjacent areas.
Discharge by Transpiration and Evaporation
Transpiration is the process by which water is taken into the root system of plants directly from the zone of saturation, or from the capillary fringe just above it, and discharged into the atmosphere. The depth from which plants will lift the ground water differs with plant species and type of soil. Ordinary grasses and field crops will not send their roots more than a few feet in search of water, but alfalfa, some trees, and certain desert plants draw water from much greater depths. The water table along most of the major valleys in Sumner County is within easy reach of such deep-rooting plants, and much water is discharged from the zone of saturation in this way. Groundwater can be discharged by evaporation only where the water table is within a few feet of the land surface, and in Sumner County this condition is limited chiefly to areas along streams.
That considerable ground water is discharged in Sumner County by transpiration and evaporation is illustrated by the significant rise in the water table in valley areas in the fall when vegetation becomes dormant and evaporation decreases. The rise in the water table may be several feet, although there may be no recharge from precipitation. In Sumner County the quantity of ground water discharged by evaporation and transpiration is probably greater than the amount discharged by any other means.
Discharge by Springs and Seeps
Ground water is discharged by springs and seeps at points where the water table intersects the land surface. In Sumner County springs and seeps occur in the banks of streams that are cut below the water table and at the margins of Pleistocene sand and gravel deposits that are underlain by impermeable shale. Springs are especially noticeable at the south margin of the Nebraskan deposits in the area west of Conway Springs. The amount of ground water discharged by springs and seeps in Sumner County probably ranks next in importance to the amount discharged by transpiration and evaporation.
Discharge by Wells
Most of the water used in Sumner County is derived from wells. Although wells are the most obvious means of ground-water discharge and are increasing in number, the quantity of water withdrawn by pumping is not large compared with the amount discharged by other means. The amount of ground water pumped in Sumner County could not be determined accurately, but figures based on reported pumpage for irrigation, municipal, and industrial use and estimated pumpage for rural domestic and stock use indicate that a total of about 3.5 billion gallons, or 10,800 acre-feet, of water was withdrawn in 1955. This would be equal to about 0.17 inch of water spread over the county. Much of this water, had it not been discharged by pumping, would no doubt have been discharged by natural seepage or by transpiration.
Discharge by Percolation
The amount of ground water moving out of Sumner County by percolation is probably a little less than the amount moving into the county by this means. Within the major valleys of the county the amounts of water entering and leaving the county by percolation are probably about equal. The amount of water that could percolate into or out of the county through the relatively impermeable Permian shale is insignificant and can be disregarded. In the area of Nebraskan deposits west of Conway Springs, however, and in the area between Ninnescah and Arkansas Rivers on the Sumner-Sedgwick County line, ground water in appreciable quantities moves into Sumner County. Most of this water is discharged within Sumner County by springs and seeps, by transpiration, and by wells.
Recovery
When a well is at rest, under static conditions, the level of the water in the well is the same as the level of the water in the surrounding material, and there is little or no movement of the water. When water is withdrawn from the well, the water level in the well is lowered, and water flows into the well from the surrounding material. The amount of lowering of the water level in the well may be so small that it is not noticeable, but some lowering must occur before water can move into the well. When pumping is continued for some time, the water table is lowered around the well to form a depression in the water table that somewhat resembles an inverted cone. This depressed area is known as the cone of depression or cone of influence. As the pumping rate of the well is increased, the drawdown becomes greater. When a well is first pumped, the water level falls very rapidly, but as pumping is continued, the drawdown increases at a diminishing rate. When the pump is stopped, the water level rises rapidly at first, then more slowly, and may continue to rise for a long time.
The yield of a well is the rate at which it will deliver water continuously after the water stored in the well has been removed. The yield depends upon the quantity of water available, the thickness and permeability of the water-bearing bed, and the construction and condition of the well. The yield of a well is usually expressed in gallons per minute (gpm). Reported yields of wells in Sumner County range from 1 gpm for some domestic wells to about 2,500 gpm for some irrigation wells.
The specific capacity of a well is the rate of yield per unit of drawdown and is expressed in gallons per minute per foot. In testing the specific capacity of a well, pumping is continued until the water level remains approximately stationary. Specific capacities as great as 175 gpm per foot were reported for some wells in Sumner County.
Prev Page--General Geology || Next Page--Utilization
Kansas Geological Survey, Geology
Placed on web January 2003; originally published August 1961.
Comments to webadmin@kgs.ku.edu
The URL for this page is http://www.kgs.ku.edu/General/Geology/Sumner/05_gw.html