![]()
Prev Page--Ground Water || Next Page--Well Records
Chemical Quality of Ground Water
The chemical character of ground water in Pratt County is indicated by analyses of 64 water samples from 46 wells and 11 test holes (table 4). The results in table 4 are given in milligrams per liter of mineral constituents and can be expressed in milliequivalents per liter by multiplying milligrams per liter by conversion factors given in table 5. Except near Cairo, ground water in Pratt County is chemically suitable for most uses.
Table 4--Chemical analyses of water from selected wells and test holes. [Chemical constituents reported in milligrams per liter. Analyses by Kansas State Department of Health.]
| Well or test-hole number1 | Sample number (fig. 11) | Date of collection | Temp. (° C) | Dissolved solids (residue at 180° C) | Silica (SiO2) | Iron (Fe) | Manganese (Mn) | Calcium (Ca) | Magnesium (Mg) | Sodium and potassium2 (Na+K) | Bicarbonate (HCO3) | Sulfate (SO4) | Chloride (Cl) | Fluoride (F) | Nitrate (NO3) | Hardness as CaCO3 | Specific conductance (micromhos at 25° C) | PH | Remarks3 | |
|---|---|---|---|---|---|---|---|---|---|---|---|---|---|---|---|---|---|---|---|---|
| Calcium, Magnesium | Noncarbonate | |||||||||||||||||||
| 26-11W-8aaa | 1 | 29-Nov-1951 | 14 | 260 | 18 | 0.24 | 66 | 6.4 | 18 | 222 | 8.6 | 19 | 0.2 | 15 | 190 | 9 | ||||
| -13daa | 2 | 23-Nov-1951 | 16 | 404 | 7 | 111 | 13 | 14 | 312 | 31 | 21 | 0.4 | 53 | 330 | 74 | |||||
| -29cbc | 3 | 29-Nov-1951 | 14 | 152 | 10 | 0.3 | 18 | 4.2 | 24 | 57 | 30 | 10 | 0.8 | 27 | 62 | 16 | ||||
| -30add1 | 4 | 6-Aug-1964 | 348 | 19 | 0 | 0 | 83 | 6.1 | 34 | 271 | 26 | 23 | 0.3 | 23 | 232 | 10 | 540 | |||
| 26-12W-2aac | 1-May-1964 | 83 | 670 | |||||||||||||||||
| -34cdd | 5 | 7-Aug-1964 | 381 | 3.5 | 0.46 | 0.06 | 51 | 8.8 | 83 | 144 | 22 | 140 | 0.6 | 0.4 | 165 | 45 | 690 | TH, 50 | ||
| 26-13W-2ccc | 6 | 29-Nov-1951 | 15 | 215 | 11 | 49 | 5.8 | 18 | 167 | 11 | 10 | 0.3 | 28 | 146 | 9 | |||||
| 26-15W-6baa | 7 | 28-Nov-1951 | 16 | 739 | 8.2 | 0.07 | 123 | 16 | 95 | 321 | 52 | 52 | 0.2 | 235 | 373 | 110 | ||||
| -26bda | 8 | 28-Nov-1951 | 15 | 138 | 19 | 0.06 | 27 | 4.8 | 8.5 | 85 | 2.9 | 9 | 0.2 | 25 | 87 | 17 | ||||
| -32cbb | 9 | 28-Nov-1951 | 14 | 144 | 17 | 27 | 5.4 | 17 | 138 | 2.5 | 6 | 0.4 | 0.7 | 90 | 0 | |||||
| 27-11W-18cbb | 10 | 6-Aug-1964 | 18 | 325 | 18 | 0.01 | 0 | 68 | 8.4 | 37 | 268 | 15 | 15 | 0.3 | 32 | 204 | 0 | 510 | ||
| -19bbc | 20-Jul-1964 | 150 | 43 | 2.1 | 8.2 | 139 | 7 | 9 | 116 | 260 | TH, 65 | |||||||||
| -25cdb | 11 | 23-Nov-1951 | 16 | 375 | 12 | 0.19 | 62 | 8.2 | 66 | 200 | 18 | 100 | 0.3 | 10 | 188 | 24 | ||||
| -30bcb | 12 | 19-Sep-1956 | 229 | 20 | 0.47 | 55 | 4.2 | 19 | 188 | 7 | 13 | 0.2 | 18 | 154 | 0 | TH, 56 | ||||
| -30bcb | 13 | 19-Sep-1956 | 2,230 | 20 | 0.39 | 59 | 9.5 | 787 | 227 | 119 | 1,120 | 0.3 | 8 | 186 | 0 | TH, 116 | ||||
| -30ccc | 14 | 18-Sep-1956 | 2,480 | 21 | 0.34 | 107 | 16 | 817 | 226 | 155 | 1,240 | 0.2 | 8 | 333 | 147 | TH, 45 | ||||
| -30ccc | 15 | 18-Sep-1956 | 10,200 | 19 | 0.54 | 261 | 76 | 3,536 | 207 | 720 | 5,480 | 0.3 | 13 | 964 | 794 | TH, 95 | ||||
| -32cba | 16 | 29-Nov-1951 | 15 | 283 | 14 | 0.04 | 74 | 7 | 17 | 239 | 12 | 14 | 0.3 | 27 | 214 | 18 | ||||
| -35dad | 17 | 19-Sep-1951 | 15 | 685 | 15 | 170 | 14 | 63 | 210 | 6.2 | 307 | 0.2 | 6.6 | 482 | 310 | |||||
| 27-12W-9aaa | 18 | 22-Jul-1964 | 8,860 | 14 | 0.28 | 0 | 152 | 41 | 3,240 | 220 | 451 | 4,845 | 0.3 | 5.3 | 548 | 368 | 15,000 | TH, 106 | ||
| -13add | 19 | 21-Jul-1964 | 21 | 19,360 | 1 | 0.26 | 0 | 448 | 112 | 6,835 | 73 | 1,202 | 10,700 | 0.6 | 3.6 | 1,578 | 1,518 | 29,100 | TH, 210 | |
| -14adb | 20 | 21-Jul-1964 | 18 | 805 | 17 | 0.01 | 0 | 119 | 17 | 155 | 232 | 33 | 336 | 0.2 | 14 | 367 | 177 | 1,410 | ||
| -25daa | 21 | 20-Jul-1964 | 1,460 | 4 | 131 | 13 | 404 | 178 | 96 | 720 | 0.3 | 2 | 380 | 234 | 2,660 | TH, 41 | ||||
| -25daa | 22 | 20-Jul-1964 | 17 | 3,060 | 5.5 | 0.38 | 119 | 18 | 1,034 | 215 | 170 | 1,600 | 0.2 | 6.2 | 371 | 195 | 5,480 | TH, 90 | ||
| -26dda | 23 | 17-Jul-1964 | 23 | 336 | 21 | 52 | 3.5 | 61 | 188 | 26 | 65 | 0.6 | 14 | 144 | 0 | 550 | TH, 27 | |||
| -26dda | 24 | 17-Jul-1964 | 18 | 2,270 | 12 | 0 | 93 | 12 | 749 | 222 | 134 | 1,150 | 0.3 | 6.6 | 282 | 100 | 4,150 | TH, 116 | ||
| -35aab | 17-Jul-1964 | 276 | 69 | 2.9 | 215 | 11 | 11 | 184 | 420 | |||||||||||
| -36bcb | 25 | 20-Jul-1964 | 17 | 298 | 14 | 0.23 | 0 | 64 | 6 | 33 | 210 | 21 | 20 | 0.3 | 37 | 184 | 12 | 450 | TH, 32 | |
| -36bcb | 26 | 20-Jul-1964 | 16 | 271 | 17 | 0 | 52 | 4.5 | 41 | 202 | 20 | 25 | 0.3 | 12 | 148 | 0 | 410 | TH, 69 | ||
| -36daa | 27 | 21-Sep-1956 | 275 | 26 | 54 | 6.2 | 32 | 195 | 23 | 25 | 0.3 | 12 | 160 | 0 | TH, 26 | |||||
| -36daa | 28 | 21-Sep-1956 | 242 | 22 | 0.12 | 47 | 6.6 | 29 | 185 | 13 | 24 | 0.3 | 8.4 | 144 | 0 | TH, 105 | ||||
| 27-13W-21aca1 | 1-May-1964 | 40 | 440 | |||||||||||||||||
| -32bbb | 29 | 28-Nov-1951 | 15 | 158 | 17 | 0.37 | 40 | 5.2 | 7.4 | 144 | 4.5 | 7.5 | 0.2 | 4.9 | 122 | 4 | ||||
| -33dcb | 30 | 3-Sep-1964 | 17 | 323 | 17 | 66 | 7.4 | 30 | 190 | 14 | 50 | 0.2 | 14 | 195 | 39 | 510 | 7.2 | |||
| -34cad | 31 | 3-Sep-1964 | 17 | 321 | 16 | 58 | 1.8 | 59 | 181 | 17 | 72 | 0.2 | 11 | 152 | 4 | 550 | 7.4 | |||
| -34dab | 32 | 3-Sep-1964 | 16 | 355 | 15 | 66 | 3.8 | 57 | 195 | 25 | 72 | 0.2 | 16 | 180 | 20 | 600 | 7.4 | |||
| 27-15W-6ddd | 33 | 10-Jul-1964 | 17 | 218 | 0.67 | 0 | 38 | 3.2 | 32 | 144 | 18 | 8 | 0.4 | 30 | 108 | 0 | 320 | TH, 59 | ||
| -6ddd | 34 | 10-Jul-1964 | 19 | 213 | 16 | 51 | 3.2 | 21 | 181 | 14 | 5 | 0.6 | 14 | 140 | 0 | 330 | TH, 128 | |||
| -34ccc | 1-May-1964 | 6 | 230 | |||||||||||||||||
| -35cdc | 35 | 27-Nov-1951 | 16 | 155 | 19 | 0.26 | 38 | 5.2 | 7.6 | 144 | 1.6 | 5 | 0.2 | 7.5 | 116 | 0 | ||||
| 28-11W-18bdc | 1-May-1964 | 18 | 430 | |||||||||||||||||
| 28-12W-14bbd | 1-May-1964 | 240 | 1,110 | |||||||||||||||||
| -21bad | 1-May-1964 | 22 | 390 | |||||||||||||||||
| 28-13W-1bdb | 1-May-1964 | 48 | 500 | |||||||||||||||||
| -3aca | 36 | 3-Sep-1964 | 16 | 349 | 20 | 0.01 | 0 | 62 | 8.2 | 48 | 178 | 33 | 57 | 0.1 | 20 | 188 | 22 | 570 | 8.3 | |
| -3bad | 2-Sep-1964 | 317 | 0.09 | 0 | 57 | 8.8 | 185 | 24 | 45 | 24 | 178 | 510 | ||||||||
| -4dbd | 37 | 3-Sep-1964 | 16 | 378 | 16 | 54 | 5 | 82 | 200 | 28 | 84 | 0.3 | 15 | 155 | 0 | 640 | 7.3 | |||
| -26dcb1 | 38 | 14-Jul-1964 | 16 | 230 | 19 | 0 | 0 | 48 | 3.9 | 28 | 181 | 15 | 21 | 0.3 | 5.8 | 136 | 0 | 360 | ||
| 28-14W-7bbb | 39 | 1964 | 207 | 22 | 0.08 | 0 | 38 | 7.6 | 25 | 161 | 7.4 | 20 | 0.3 | 7.5 | 126 | 0 | 340 | 7.6 | ||
| -11bba | 40 | 30-Nov-1951 | 15 | 207 | 17 | 0.1 | 51 | 5.6 | 16 | 190 | 3.3 | 14 | 0.2 | 5.8 | 150 | 0 | ||||
| -11bbd | 1-May-1964 | 253 | 49 | 5.4 | 166 | 7 | 41 | 6.2 | 410 | |||||||||||
| -22ccc | 9-Jul-1964 | 17 | 196 | 50 | 5.1 | 185 | 4 | 9 | 146 | 320 | ||||||||||
| 28-15W-25cdd | 41 | 2-Sep-1964 | 16 | 185 | 19 | 44 | 1.2 | 18 | 161 | 3.2 | 8 | 0.2 | 4 | 115 | 0 | 280 | 7.1 | |||
| 29-11W-4aaa | 1-May-1964 | 16 | 500 | |||||||||||||||||
| -29bbb | 42 | 7-Aug-1964 | 16 | 287 | 17 | 74 | 2.3 | 23 | 254 | 7.8 | 13 | 0.2 | 13 | 194 | 0 | 460 | 7.3 | |||
| -34baa | 43 | 29-Nov-1951 | 14 | 171 | 12 | 0.14 | 40 | 6.8 | 14 | 167 | 4.5 | 10 | 0.3 | 1.5 | 128 | 0 | ||||
| 29-13W-6baa | 44 | 8-Jul-1964 | 18 | 223 | 21 | 51 | 3.2 | 22 | 181 | 8 | 15 | 0.3 | 8.9 | 140 | 0 | 350 | 7.6 | |||
| -24ddd | 45 | 1-Sep-1964 | 16 | 275 | 15 | 67 | 3.2 | 18 | 210 | 12 | 10 | 0.2 | 23 | 180 | 8 | 420 | 7.3 | |||
| 29-14W-4cdd | 46 | 27-Nov-1951 | 16 | 176 | 15 | 0.4 | 46 | 5.6 | 8.5 | 163 | 6.2 | 7.5 | 0.2 | 6.6 | 138 | 4 | ||||
| -19ddc | 47 | 2-Sep-1964 | 16 | 148 | 19 | 0.03 | 0 | 28 | 4.4 | 15 | 107 | 5.8 | 10 | 0.2 | 12 | 88 | 0 | 230 | 8.1 | |
| -23bba1 | 48 | 2-Sep-1964 | 20 | 237 | 16 | 54 | 6.7 | 18 | 195 | 9.1 | 13 | 0.2 | 10 | 162 | 2 | 370 | 7.6 | |||
| -23bba2 | 49 | 27-Nov-1951 | 16 | 209 | 9.8 | 0.56 | 54 | 6.8 | 13 | 196 | 7.8 | 8 | 0.2 | 12 | 162 | 2 | ||||
| 29-15W-2dab | 50 | 28-Nov-1951 | 15 | 203 | 15 | 51 | 6.2 | 13 | 186 | 8.6 | 9 | 0.2 | 8.4 | 152 | 0 | |||||
| -16aaa | 51 | 28-Nov-1951 | 16 | 87 | 14 | 0.25 | 17 | 3.4 | 4.8 | 56 | 6.2 | 5 | 0.2 | 8.8 | 56 | 10 | ||||
| 1. Well- and test-hole numbering system described in text. 2. Includes potassium reported as sodium. 3. TH, test hole; number (such as 50) designates depth below land surface, in feet, from which water sample was collected for chemical analysis. |
||||||||||||||||||||
Table 5--Factors for converting milligrams per liter to milliequivalents per liter.
| Mineral constituent | Chemical symbol | Multiply by |
|---|---|---|
| Calcium | Ca++ | 0.04990 |
| Magnesium | Mg++ | .08226 |
| Sodium | Na+ | .04350 |
| Bicarbonate | HCO3- | .01639 |
| Sulfate | SO4-- | .02082 |
| Chloride | Cl- | .02821 |
| Fluoride | F- | .05264 |
| Nitrate | NO3- | .01613 |
The chemical analyses in table 4 do not indicate the sanitary quality of the water, although a large amount of certain mineral constituents, such as nitrate or chloride, may indicate pollution. Water containing mineral matter that imparts an objectionable taste or odor may be free from harmful bacteria and safe for drinking. Conversely, water that is clear and pleasant to the taste may contain harmful bacteria. Great care should be taken to protect domestic and public water supplies from pollution. To guard against contamination, a well must be sealed to keep out dust, insects, vermin, debris, and surface water. Wells should not be placed where runoff or leakage from barnyards, privies, or cesspools are possible sources of pollution.
Water from private wells may be tested for bacteriological content by the Division of Environmental Health of the Kansas State Department of Health at little or no cost to the well owner. This service can be obtained by the County Health Officer.
Water to be used for drinking should not contain excessive amounts of iron, magnesium, chloride, sulfate, or nitrate. Water to be used for cooking should have neither an excessive hardness nor a high bicarbonate content. The quality of water in relation to use is described in table 6.
Table 6--Quality of water in relation to use, Pratt County.
| Constituent | Principal characteristics | Recommended maximum concentration1(mg/l) |
|---|---|---|
| Dissolved solids | Water high in dissolved-solids concentration may have a disagreeable taste or a laxative effect. When water is evaporated the residue consists mainly of the minerals listed in table 4. | 500 |
| Hardness | Hardness is caused by calcium and magnesium. Forms scale in vessels used in heating or evaporative processes. Hardness is commonly noticed by its effect when soap is used with the water. Carbonate hardness can be removed by boiling, non-carbonate hardness cannot. | 120 (easily detected) 200 (sometimes softened for household use) |
| Iron (Fe) | Stains cooling utensils, plumbing fixtures, and laundry. Water may have a disagreeable taste. | 0.3 |
| Fluoride (F) | Fluoride concentrations of about 1 mg/l in drinking water used by children during the period of calcification of teeth prevent or lessen the incidence of tooth decay. However, concentrations in excess of 1.5 mg/l may cause mottling of the tooth enamel (Dean, 1936). Bone changes may occur with concentrations of 8 to 20 mg/l. | 1.5 |
| Nitrate (NO3) | Comly (1945) states that concentrations of 45 mg/l may be harmful to infants. Adverse effects from drinking water high in nitrate concentration are also possible in older children and adults. | 45 |
| Sulfate (SO4) | Derived from solution of gypsum and oxidation of iron sulfides (pyrite, etc.). Concentrations of magnesium sulfate (Epsom salt) and sodium sulfate (Glauber's salt) may have a laxative effect on some persons. | 250 |
| Chloride (Cl) | Chloride in ground water may be derived from connate marine water in sediments, surface contamination, or solution of minerals containing chloride. Causes water to taste salty and, in high concentrations, increases the corrosiveness of the water. | 250 |
| 1 Concentration recommended by the U.S. Public Health Service (1962). | ||
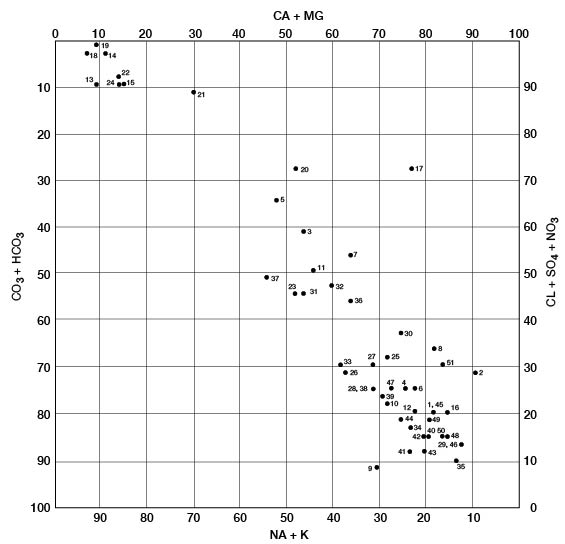
The modified Piper diagram (Piper, 1953; Hem, 1959) shown on figure 10 illustrates the chemical type of ground water from 34 wells and 10 test holes in Pratt County. Milliequivalents per liter of cations or anions are plotted as percentages of total milliequivalents per liter of all cations or anions; thus, the position of the analysis on the diagram reflects the predominant anions and cations. The analyses plot in three general groups. The group in the upper left represents waters of the sodium chloride type. All these waters are from the Cairo area. Calcium and bicarbonate are the predominant ions for the analyses in the lower right, which are typical of ground water in the High Plains. The middle grouping of analyses represents mixed waters that probably result from the influx of saline water from Permian rocks.
Figure 10--Modified Piper diagram showing grouping of analyses of water from wells. Numbers by symbols are sample identification numbers from table 4.
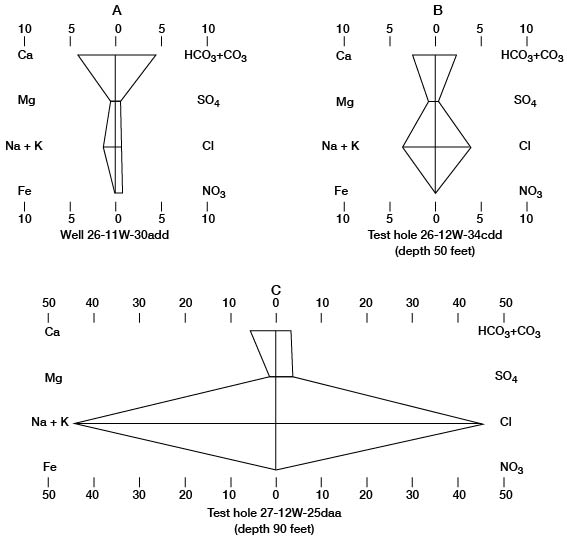
The numerical values of these water analyses can be shown graphically by the Stiff technique (Stiff, 1951; Hem, 1959) as an aid in classifying and correlating the water types. The patterns produced by plotting the data are useful for quick comparison of water types. Stiff diagrams representing the three water types found in Pratt County are illustrated on figure 11.
Figure 11--Stiff diagrams of selected analyses of water. A, Calcium bicarbonate water, typical of ground water in Pratt County. B, Mixed calcium bicarbonate and sodium chloride water. C, Sodium chloride water, typical of ground water in the Cairo area. Units are milliequivalents per liter.
Suitability for Irrigation
This discussion of the suitability of water for irrigation is based on Agriculture Handbook 60, U.S. Department of Agriculture (U.S. Salinity Laboratory Staff, 1954).
In areas of sufficient rainfall and ideal soil conditions, soluble salts in the soil or salts added to the soil by water are carried downward by percolation and ultimately reach the potentiometric surface. Soil that was originally nonsaline and nonalkaline may become unproductive if an excess of soluble salts or exchangeable sodium is allowed to accumulate as a result of improper irrigation and soil management. If the amount of water applied to the soil is less than that needed by plants, water will not percolate below the root zone, and mineral matter will accumulate in the zone. Likewise, impermeable soil zones near the surface can retard the downward movement of water and cause waterlogging of the soil and deposition of salts.
The characteristics that seem to be most important in determining the suitability of water for irrigation are the concentration of sodium ion and dissolved solids. For diagnosis and classification, the dissolved solids concentration of irrigation water can be estimated from specific conductance, which is a measure of the capacity of the inorganic salts in solution to conduct an electrical current. The specific conductance can be measured accurately in the laboratory, or it can be approximated by multiplying the total milliequivalents per liter of cations (calcium, magnesium, sodium, and potassium) by 100 or by dividing the dissolved-solids content in milligrams per liter by 0.64.
Salt-sensitive crops such as strawberries, green beans, and red clover may be affected adversely by irrigation water having a specific conductance exceeding 250 micromhos per centimeter, but water having a specific conductance below 750 micromhos per centimeter generally is satisfactory for irrigation, insofar as salt content is concerned. Water in the range of 750 to 2,250 micromhos per centimeter is widely used, and satisfactory crop growth is obtained under good management and favorable drainage conditions, but saline conditions will develop if leaching and drainage are inadequate. Use of water having a conductivity of more than 2,250 micromhos per centimeter is the exception, although a few cases can be cited where such water has been used successfully.
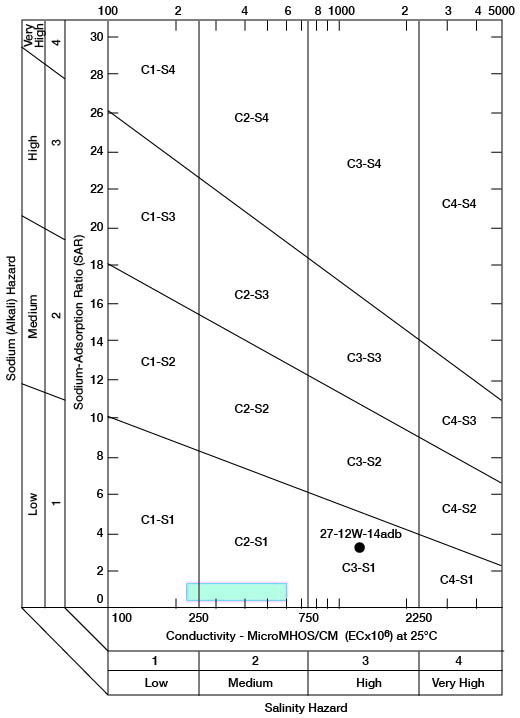
When the sodium-adsorption ratio and the electrical conductivity of a water are known, the suitability of the water for irrigation can be determined graphically by plotting these values on the diagram shown on figure 12. The sodium-adsorption ratio (SAR) is determined by dividing the concentration of sodium, expressed in milliequivalents per liter, by the square root of one-half the sum of the concentrations of calcium and magnesium, also expressed in milliequivalents per liter, as shown below:
Figure 12--Classification of water used for irrigation. Hatchured area includes analyses of water from Holdrege and Grand Island Formations given in table 7.
Low-sodium water (S1) can be used for irrigation on almost all soils with little danger that harmful levels of exchangeable sodium will develop. Medium-sodium water (S2) may be used safely on coarse-textured or organic soils having good permeability, but S2 water will present an appreciable sodium hazard in certain fine-textured soils, especially under poor leaching conditions. High-sodium water (S3) may produce harmful levels of exchangeable sodium in most soils and will require special soil management such as good drainage, leaching, and additions of organic matter. Very high sodium water (S4) generally is unsatisfactory for irrigation unless special action is taken, such as addition of gypsum to the soil.
Low-salinity water (C1) can be used for irrigation of most crops on most soils with little likelihood that soil salinity will develop. Medium-salinity water (C2) can be used if a moderate amount of leaching occurs. Crops that tolerate moderate amounts of salt, such as potatoes, corn, wheat, oats, and alfalfa, can be irrigated with C2 water without special practices. High-salinity water (C3) cannot be used on soils having restricted drainage. Very high-salinity water (C4) can be used only on certain crops and then only if special practices are followed.
Chemical analyses of water from wells in the two major aquifers in the county were selected for determining irrigation suitability (table 7). Specific conductance ranged from 230 to 1,410 micromhos, with the latter value probably being caused by contamination. The analysis of this high-salinity water sample from an irrigation well (27-12W-14adb) in the Cairo area is plotted separately on figure 12. All the other samples are classified as low-sodium (S1) and low- to medium-salinity (C1-C2) water, because they plot within the hatchured area shown on figure 12.
Table 7--Sodium-adsorption ratios and specific conductances of water samples from selected wells and test holes.
| Well or test-hole number |
Sodium adsorption ratio |
Specific conductance micromhos per centimeter at 25° C) |
|---|---|---|
| 26-11W-30add1 | 0.91 | 540 |
| 27-11W-18cbb | 1.06 | 510 |
| 27-12W-14adb 1 | 3.40 | 1,410 |
| 27-12W-36bcb | 1.35 | 410 |
| 27-13W-34dab | 1.68 | 600 |
| 27-15W- 6ddd | 1.17 | 320 |
| 28-13W-26dcb1 | .97 | 360 |
| 28-15W-25cdd | .48 | 280 |
| 29-11W-29bbb | .62 | 460 |
| 29-13W- 6baa | .73 | 350 |
| 29-13W-24ddd | .51 | 420 |
| 29-14W-19ddc | .60 | 230 |
| 1Analysis plotted separately on figure 12. | ||
The Cairo Area
An investigation of the chemical quality of water in the South Fork Ninnescah River basin is being made currently as part of the cooperative program between the Kansas State Department of Health and the U.S. Geological Survey. The principal objectives are to (1) determine the chemical quality of the water resources, (2) determine the relation between water quality and the major hydrologic and cultural factors that influence water quality, and (3) identify the principal sources and extent of natural and man-made pollution. Such information is essential to wise planning for development of the water resources of the basin.
A. M. Diaz (1965) stated: "The deterioration of water quality in the South Fork Ninnescah River by the inflow of saline waters has been known for many years. Parker and Bailey of the U.S. Geological Survey reported in 1911 that the concentration of chloride in the water of the South Fork Ninnescah increased considerably in the area between Pratt and Kingman [Kingman County]. However, the increase was attributed to inflow from salt mines near Kingman. The occurrence of saline inflow to the river from the slough area between Cairo and Cunningham was reported by the U.S. Bureau of Reclamation in administrative reports of low-flow studies made in 1956."
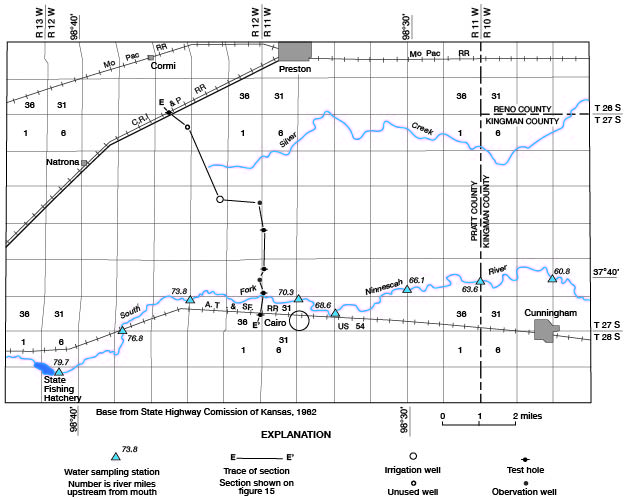
Water samples are collected during periodic discharge measurements of the South Fork Ninnescah River. The measuring and sampling stations along the river are designated by the number of river miles the station is upstream from the confluence with the North Fork Ninnescah River; thus, station 60.8 is near Cunningham in Kingman County, and station 70.3 is near Cairo. Sampling stations pertinent to the Cairo area are shown on figure 13.
Figure 13--Locations of water-sampling stations and selected wells in the Cairo area.
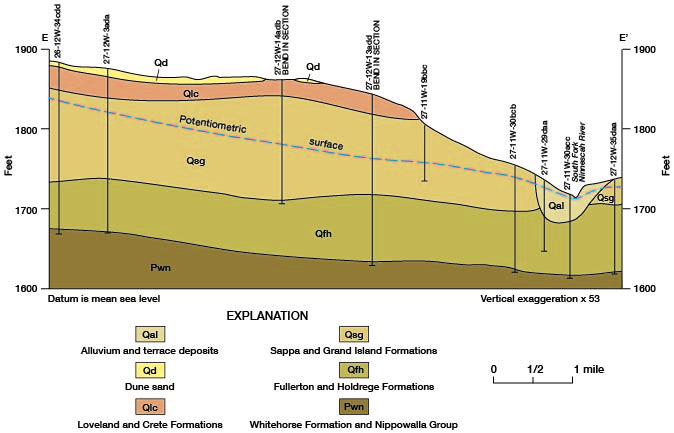
The discharge of chemical constituents and of the stream at stations in the Cairo area is shown on figure 14. The discharge values increase at a relatively low and uniform rate to station 76.8, which is about 5 river miles east of Pratt. From there to station 66.1, which is 2.5 river miles upstream from the county line, the discharge values increase markedly. The rate of increase is greatest in the 7.7-mile reach between stations 73.8 and 66.1. The dissolved-solids discharge in this reach increases from 30 to 185 tons per day and streamflow increases from 32 to 60 cfs. The increased discharge of chemical constituents is attributed to inflow of saline water in the reach. The increase in streamflow is attributed partly to the saline-water inflow, but primarily to discharge of ground water from the Holdrege Formation. The Fullerton Formation contains a confining layer of silt and clay in the, Cairo area, and water in the underlying deposits of Nebraskan age is under hydraulic pressure. The confining layer has been breached in the South Fork Ninnescah Valley by Wisconsinan erosion, and alluvium and terrace deposits in the river valley are hydraulically connected to the lower Fullerton and to the Holdrege Formations (fig. 15). Ground water from these Nebraskan deposits moves through the alluvium and terrace deposits to the stream. The increased streamflow in the Cairo area is indicated also by the sharp upstream bend of the potentiometric contours shown on plate 1.
Figure 14--Relation of stream and chemical discharge to distance upstream from mouth, South Fork Ninnescah River, April 1963 (A.M. Diaz, written comun., 1965). Locations of water sampling stations are shown on figure 13.
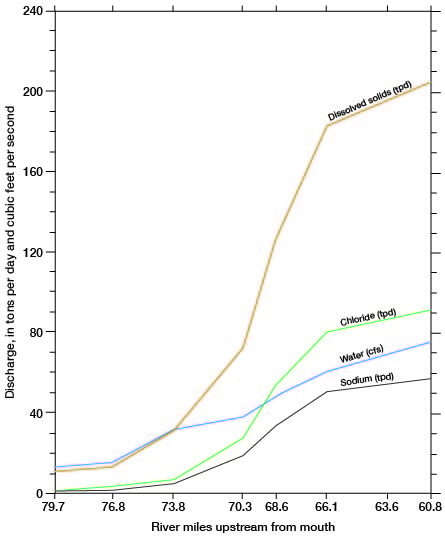
Figure 15--Geologic section showing the hydraulic connection between the alluvium and terrace deposits and the Holdrege and Fullerton Formations in the Cairo area. Trace of section is shown on figure 13.
A limited amount of test drilling and collection of ground-water samples for chemical analysis was done in an attempt to determine the source of the saline water. The sources considered were (1) leakage of oil-field brine from evaporation ponds or through faulty oil-well casing, and (2) inflow of saline water from rocks of Permian age that underlie the South Fork Ninnescah Valley.
Test holes were drilled and cased along a north-northwesterly trend from Cairo toward the oil-producing area near Natrona and Carmi (fig. 13). Water samples for chemical analysis were collected from these test holes and from wells in the area. The samples were collected from various depths and from both the Holdrege and Grand Island Formations. The analyses showed that saline water is present along the trend and that it occurs on the north side of the river only. However, the upper aquifer (Grand Island) did not contain saline water, so leakage from brine-evaporation ponds on the land surface is not considered a likely source of the contamination.
Leonard (1964) has shown that the ratio of sodium concentration to chloride concentration in Kansas oil-field brines is less than 0.60. This value has been confirmed by analyses of 24 brine samples from 18 oil wells in eastern Pratt County in which the sodium to chloride ratio ranged from 0.43 to 0.59 (A. M. Diaz, written commun., 1967). Saline-water contamination was found in seven of the samples collected from test holes drilled in the Cairo area. The sodium to chloride ratios in these samples ranged from 0.64 to 0.70, which is typical of water from Permian rocks, not oil-field brine from rocks of pre-Permian age (A. M. Diaz, written commun., 1967). The chemistry of the water, therefore, indicates that the contamination is by upward leakage of saline water from rocks of Permian age that underlie the South Fork Ninnescah Valley. The conclusion of a natural rather than a man-made source is further supported by the fact that the contamination was known many years before oil production began in Pratt County.
Further study of the Cairo area is needed to determine whether (1) saline water moves upward along a geologic fault in eastern Pratt County (fig. 5), or (2) the ancesteral South Fork Ninnescah River has eroded the Permian rocks sufficiently to permit direct movement of saline water into the Holdrege Formation. Hydraulic pressure that would cause movement of the water, by either path, is known to exist. Parker (1911, p. 160) reported that salt water rose to within 15 feet of land surface in an 800-foot deep well drilled at Pratt. Pressure sufficient to raise water this high would cause saline water to move into the Holdrege Formation, into the alluvium and terrace deposits, and, eventually, into the river.
Summary and Conclusions
Ground water is an important factor in the economy of Pratt County. The future population and economic growth of the area depend largely on the availability and extent of development of the ground-water resource.
Pratt County is fortunate in being underlain by extensive aquifers from which good-quality water can be withdrawn by wells. Well yields of 500 gpm are possible almost anywhere in the county, and yields of 2,000 gpm are possible in much of the area. Even though ground water in the Holdrege Formation near Cairo is contaminated by upward leakage of saline water from Permian rocks, good-quality water is available from wells completed in the shallower Grand Island Formation.
Prev Page--Ground Water || Next Page--Well Records
Kansas Geological Survey, Geology
Placed on web Aug. 18, 2008; originally published Feb. 1973.
Comments to webadmin@kgs.ku.edu
The URL for this page is http://www.kgs.ku.edu/General/Geology/Pratt/06_qual.html