![]()
Figure 9
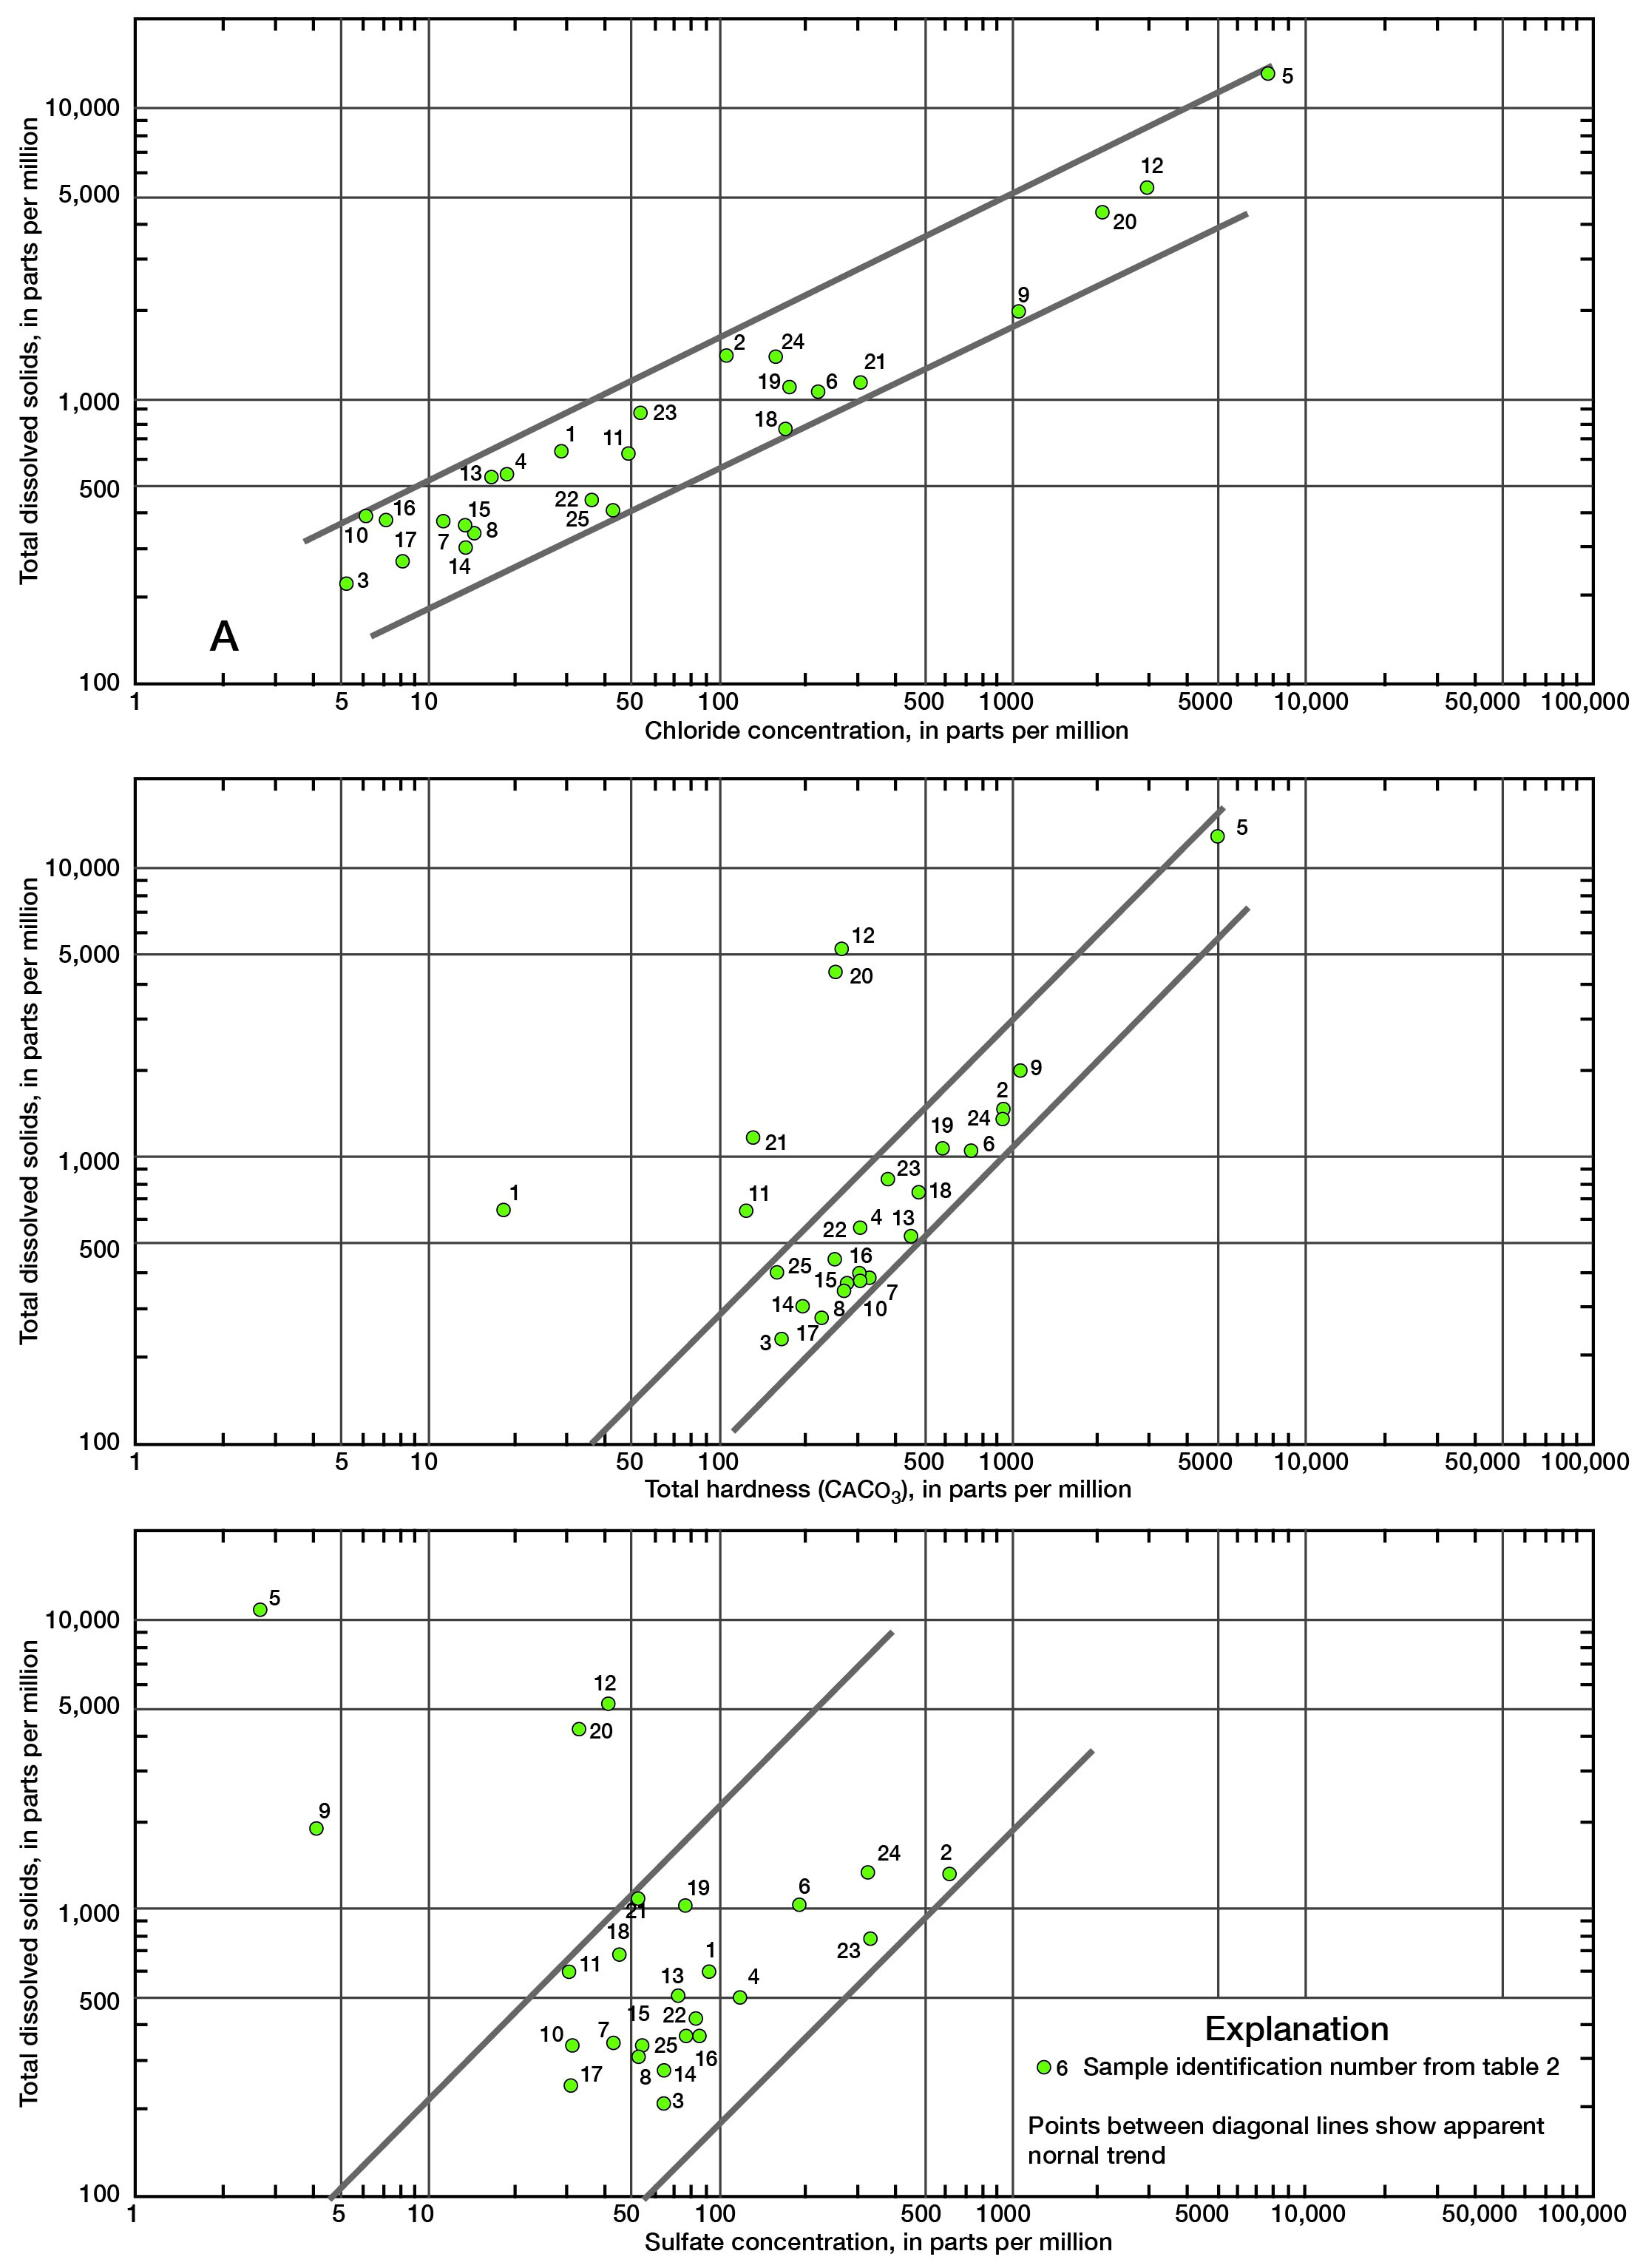
Figure 9--Relationship between total dissolved solids and (A) chloride concentration, (B) total hardness, and (C) sulfate concentration.
Kansas Geological Survey, Geology
Placed on web June 8, 2009; originally published November 1969.
Comments to webadmin@kgs.ku.edu
The URL for this page is http://www.kgs.ku.edu/General/Geology/Linn/fig9.html