![]()
Prev Page--Geologic units || Next Page--Well Records
Ground Water
Source
The source of ground water in Linn County is the precipitation on the county and adjacent areas with streams that drain into Linn County. Most of the moisture that falls on the county is removed as surface runoff or is returned directly to the atmosphere by evaporation or transpiration. The part not directly removed percolates downward into the soil and into voids in the underlying bedrock. At some depth below land surface all voids are completely filled and the rock is saturated. The water in the saturated rock is ground water.
Recharge and Discharge
The quantity of water that reaches the zone of saturation is recharge to the aquifer. Recharge is greatest when evapotranspiration and other losses are lowest and rainfall is highest; in Linn County this occurs during the spring months.
The rates of recharge vary widely and depend mainly on topography and rock and soil textures. The areas receiving greatest recharge in Linn County are the broad, flat, and poorly drained surfaces developed on the valley fill and terrace surfaces, and on the gentle dip slopes of several of the thicker limestone units. Areas where recharge is slight include: most steep, well-drained slopes; surfaces underlain by impermeable shale; and surfaces underlain by soils with well-developed clay pans.
Recharge to the alluvium is greater than to any of the other formations in the county because the soil zone is the most permeable, and runoff and discharge from the valley sides must cross the alluvium or percolate through it before being discharged into the streams. Occasional flood water from the streams at high stage is also a source of recharge. Much of the water available for recharge is presently being discharged as streamflow.
Infiltration is the passage of water through the soil surface and into the soil, and infiltration capacity (Horton, 1933) is the maximum rate of this movement. According to soil-moisture data compiled by the local Soil Conservation Service, the infiltration capacities of all Linn County soils are extremely low: 0.3 inch per hour through soils developed on Pennsylvanian rocks younger than the Pleasanton Group, 0.1 inch per hour through soils developed on Pleasanton and Marmaton Groups, and 0.5 inch per hour through soils of alluvial origin.
The discharge of ground water in Linn County is mainly through springs and seeps and by evaporation from the surface of the aquifer at its outcrop. Some ground water is discharged by wells, and some is discharged by transpiration where root systems are close to the water table.
An estimate of the runoff from Linn County, which includes both surface water and ground water, may be made using the long-term streamflow record from Big Sugar Creek at Farlinville. According to this record, mean annual runoff from this drainage area for the period from 1930 to 1931 and from 1950 to 1956 was 130 cfs (cubic feet per second) or 8.94 inches (Furness, 1959, table 3). The largest part of this runoff is storm runoff that occurs during a relatively short period of time. The remainder, or the discharge that maintains flow between storms, is ground-water discharge or base flow.
According to an accumulated frequency or flow-duration curve based on the entire record from the Farlinville gage, more than 90 percent of the total discharge occurs in about 10 percent of the time (Furness, 1959, fig. 77). Similarly, about 85 percent of the precipitation was received in about 50 percent of the time. On the basis of these estimates, it was assumed that the discharge that occurs at the Farlinville gage between 50 percent and 90 percent of the time is derived mainly from ground water. Ground-water recharge in the area is approximately equal to this discharge, derived from ground water. Accordingly, from the flow-duration curves (Furness, 1959, fig. 77), ground-water discharge into Big Sugar Creek ranges from 1.1 inches (Q50) to 0.2 inch (Q90) annually.
This range of discharge appears to be in the right order of magnitude as shown by more recent data. According to Busby and Armentrout (1965, p. 89) the average base flow of Big Sugar Creek for the period 1923-62 was 19.9 cfs or 1.4 inches annually, and the mean base flow varied from 41.3 cfs or 2.8 inches in 1962 to zero for several other years.
Despite normal seasonal fluctuations, the average altitude of the water table in Linn County is reasonably constant from year to year (fig. 6). It can be assumed, therefore, that the total quantity of water added to these aquifers as recharge is approximately equal to the total quantity discharged. Based on approximations of ground-water discharge from streamflow hydrographs, total annual recharge probably varies from 2.8 inches to nearly zero. If considerable water is lost by evapotranspiration along the outcrop of the consolidated rocks, as appears probable from examination of figure 7, the recharge to the alluvium may be more than the average of 1.4 inches and possibly more than 2.0 inches, the average for the non-growing season.
Figure 6--Hydrographs of three selected wells.
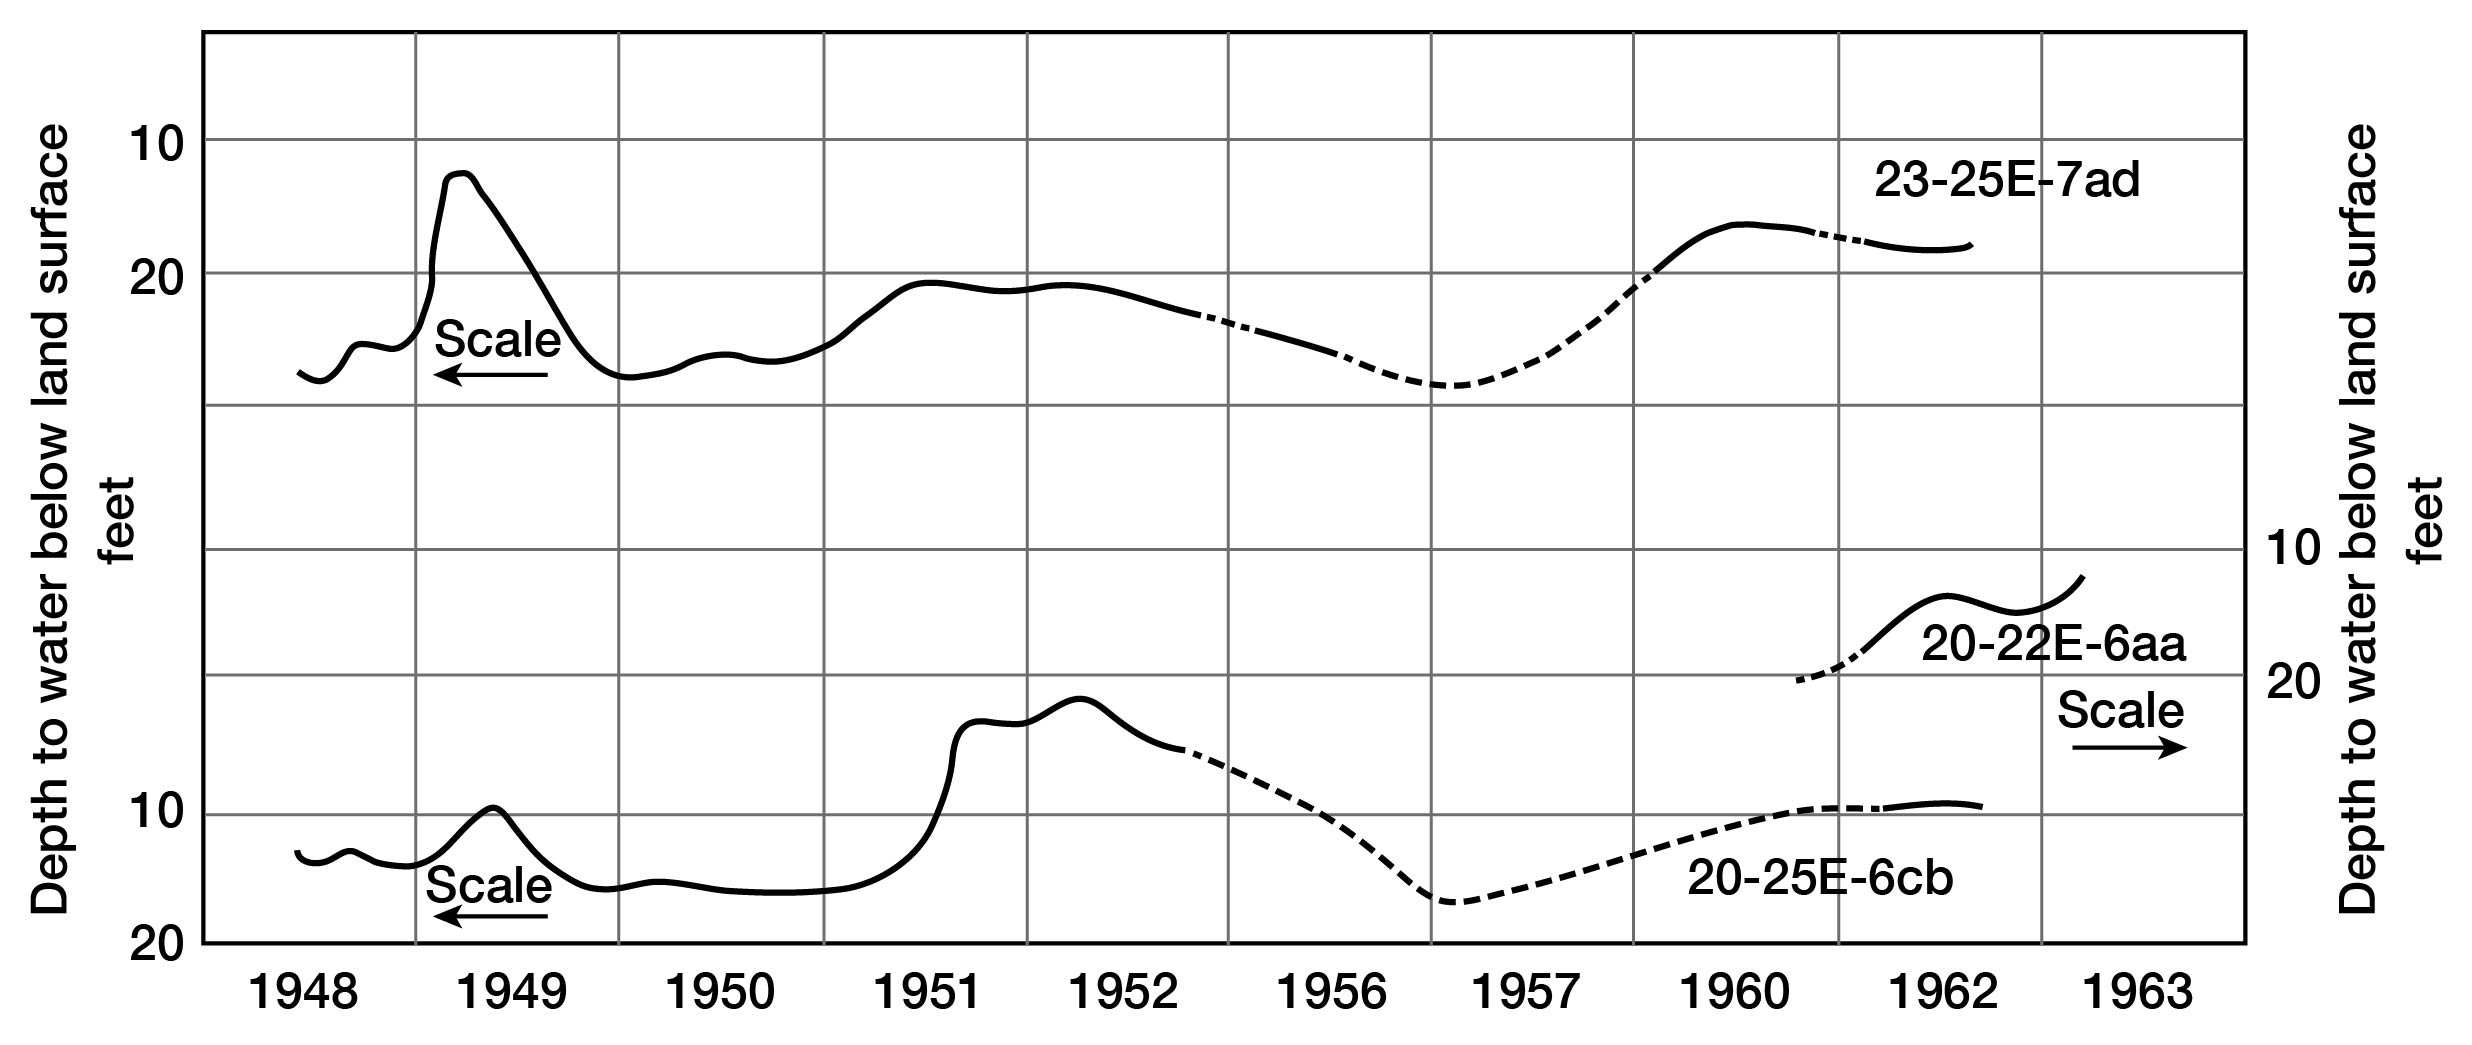
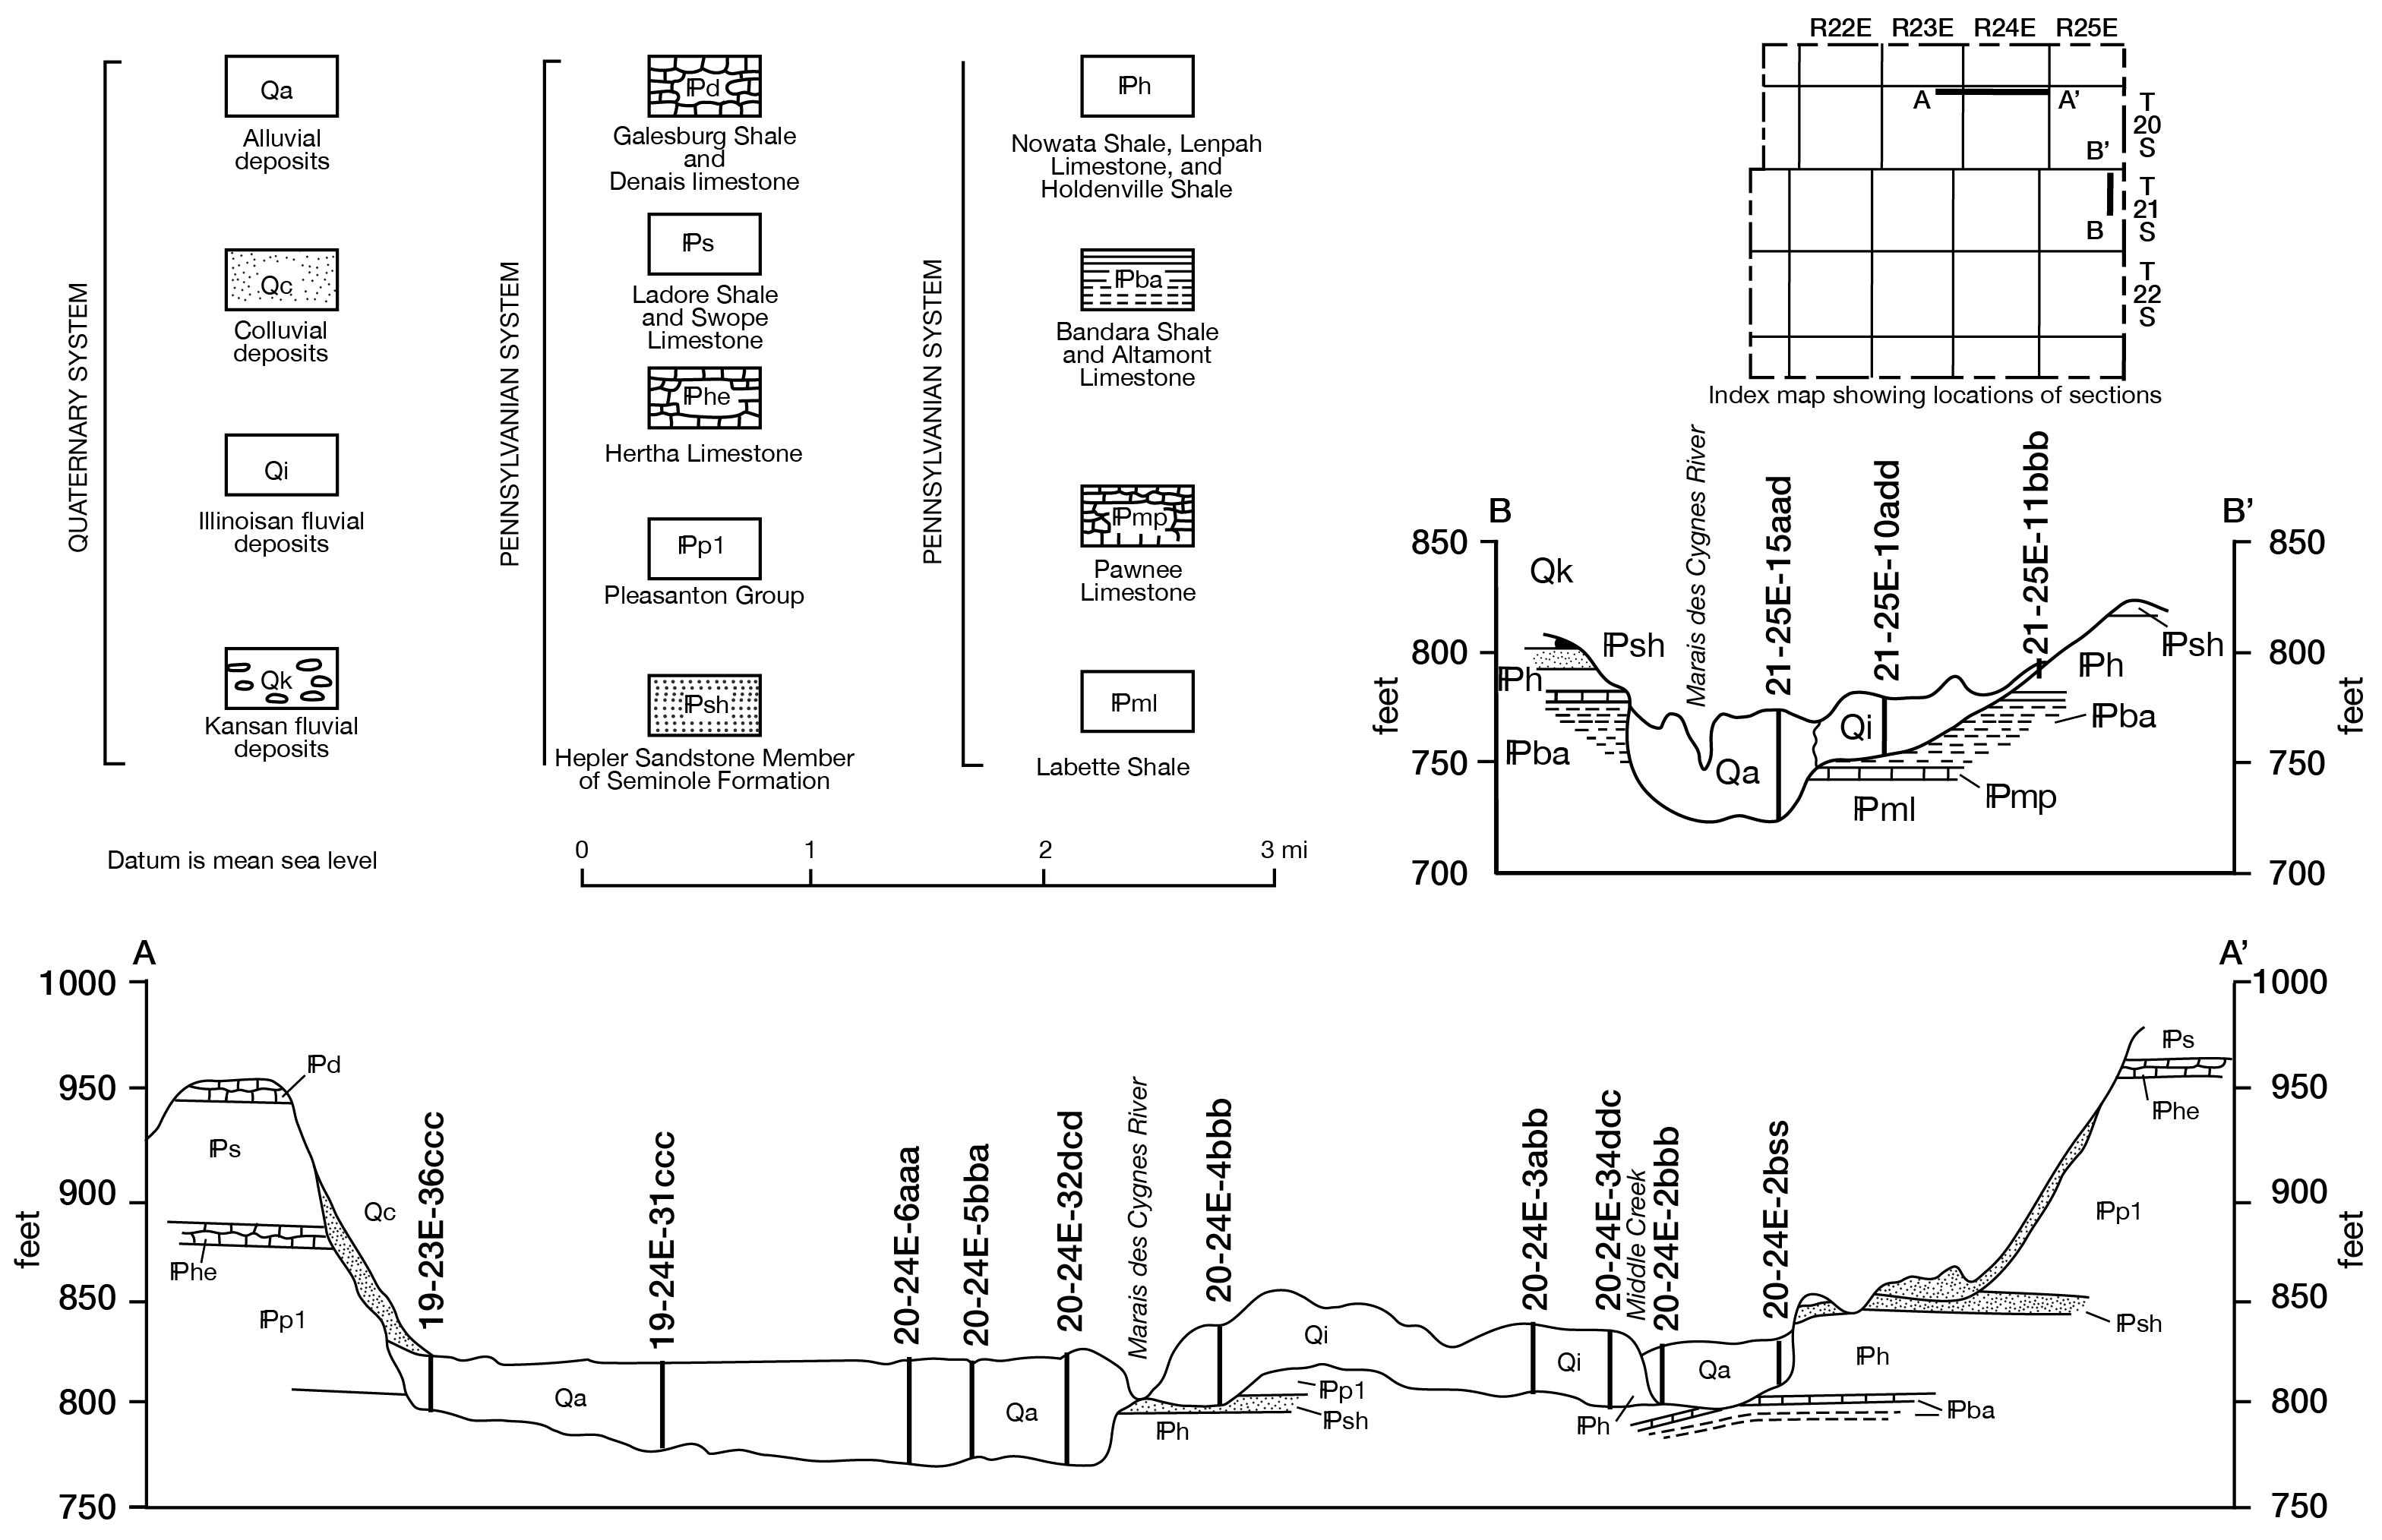
Figure 7--Geologic sections. A larger version of this figure is available.
Movement
In Linn County the movement of ground water is in the direction of the hydraulic gradient at a rate that is proportional to this gradient and to the permeability of the aquifer. Movement of ground water in unconsolidated valley-fill deposits of the Marais des Cygnes River and its larger tributaries occurs mainly in basal sands and gravels and is in a direction which is both downstream and toward streams.
The rate of movement of water through these sands and gravels may be estimated by application of the relationship (after Wenzel, 1942, p. 71)
V = PI / 39,500p
where:
V is the average velocity, in feet per day;
P is the coefficient of permeability, in gallons per day per square foot;
I is the hydraulic gradient, in feet per mile; and
p is the porosity.
Based on an approximation of permeability of 2,000 gallons per day per square foot from reported aquifer-test data, a hydraulic gradient of 1 foot per mile, and an estimated 15 percent porosity, the rate of water movement is 0.34 foot per day. These are minimum estimates and indicate that a considerable quantity of water moves downgradient through the deposits.
The hydraulic gradient of water in the upland bedrock aquifers is northwestward, in the direction of regional dip, except in small areas of anomalous structure. Most ground water, moving in accordance with these gradients, moves toward a point of discharge where wells, land surface, or streams intersect the water table. Based on an estimated value for P of 100 gallons per day per square foot, a regional hydraulic gradient of 1 foot per mile, and a porosity of 10 percent, the rate of movement through these aquifers may be as low as 0.03 foot per day.
Chemical Character
Ground water in Linn County contains dissolved minerals and other matter obtained from the rocks and soil with which it has come in contact and from sources of manmade contamination. The degree of mineralization of the waters is dependent on such factors as the mineralogical composition of the rocks or soil and the length of time the water is in contact with soluble products. Two general sources of contamination resulting from the activities of man are petroleum production and waste disposal.
The chemical quality of 25 representative ground-water samples collected in Linn County is shown in table 2.
Table 2--Analyses of water from selected wells (in parts per million except as otherwise indicated). (One part per million is equivalent to one pound of substance per million pounds of water or 8.33 pounds per million gallons of water.) Samples analyzed by H. A. Stoltenberg, Kansas State Department of Health.
| Well number |
Sample number |
Depth (feet) |
Geologic source | Date of collection |
Temp. (°F) |
Dissolved solids (residue at 180° C) |
Silica (SiO2) |
Iron (Fe) |
Manganese (Mn) |
Calcium (Ca) |
Magnesium (Mg) |
Sodium and Potassium (Na+K) |
Bicarbonate (HCO3) |
Sulfate (SO4) |
Chloride (Cl) |
Fluoride (F) |
Nitrate (NO3)* |
Hardness as CaCO3 | Specific conductance (micromhos at 25° C) |
pH | ||
|---|---|---|---|---|---|---|---|---|---|---|---|---|---|---|---|---|---|---|---|---|---|---|
| Total | Carbonate | Non- carbonate |
||||||||||||||||||||
| 19-21E-23cb | 1 | 120 | Chanute Shale |
3-27-1963 | 639 | 6.0 | 0.59 | .00 | 6.4 | 0.5 | 250 | 454 | 91 | 28 | 2.8 | 0.4 | 18 | 18 | 0 | 1,060 | ||
| 19-23E-30dd | 2 | 18 | Cherryvale Shale |
9-21-1961 | 62 | 1,396 | 15 | .25 | .38 | 286 | 63 | 85 | 442 | 608 | 106 | .6 | 15 | 972 | 362 | 610 | 2,070 | |
| 19-24E-31dd | 3 | 31 | Pleasanton Group |
9-21-1961 | 222 | 12 | .18 | .00 | 43 | 13 | 12 | 127 | 62 | 5.0 | .3 | 12 | 161 | 104 | 57 | 380 | ||
| 20-22E-9bb | 4 | 85 | Drum and Iola Limestones |
3-27-1963 | 524 | 18 | .42 | .17 | 70 | 33 | 74 | 398 | 114 | 18 | .4 | 1.0 | 310 | 310 | 0 | 850 | ||
| 20-22E-15c | 5 | 1,290 | Mississippian System |
3-1-1964 | 12,150 | .0 | 1.1 | .00 | 328 | 176 | 4,162 | 56 | 3.7 | 7,450 | 1.0 | .4 | 1,542 | 46 | 1,496 | 20,050 | 6.8 | |
| 20-22E-32cdd | 6 | 18 | Cherrvale Shale |
3-27-1963 | 1,004 | 15 | .09 | .00 | 234 | 38 | 61 | 371 | 181 | 212 | .1 | 80 | 740 | 304 | 436 | 1,700 | ||
| 20-22E-33dd | 7 | 20 | Alluvium | 3-27-1963 | 370 | 12 | .05 | .00 | 114 | 9.6 | 10 | 337 | 41 | 11 | .1 | 5.8 | 324 | 276 | 48 | 630 | ||
| 20-23E-36cb | 8 | 18 | Alluvium | 9-19-1961 | 331 | 17 | .05 | .00 | 99 | 5.1 | 9.7 | 254 | 52 | 14 | .1 | 8.9 | 268 | 208 | 60 | 580 | ||
| 20-24E-3ba | 9 | 21 | Alluvium | 9-19-1961 | 1,968 | 17 | .04 | .00 | 315 | 69 | 330 | 405 | 4.1 | 1,025 | .1 | 8.0 | 1,070 | 332 | 738 | 4,050 | ||
| 20-24E-19ca | 10 | 20 | Dennis and Swope Limestones |
9-19-1961 | 59 | 370 | 7.5 | .24 | .00 | 114 | 5.7 | 9.9 | 310 | 30 | 6.0 | .1 | 44 | 308 | 254 | 54 | 650 | |
| 20-25E-31da | 11 | 68 | Marmaton Group |
9-19-1961 | 632 | 12 | 2.3 | 28 | 13 | 209 | 566 | 41 | 49 | .8 | .4 | 124 | 124 | 0 | 1,110 | |||
| 21-22E-17ac | 12 | 62 | Dennis and Swope Limestones |
3-27-1963 | 5,163 | 10 | .82 | .00 | 53 | 33 | 1,916 | 610 | 40 | 2,800 | 4.6 | 6.2 | 268 | 268 | 0 | 9,370 | ||
| 21-23E-6ca | 13 | 24 | Colluvium and alluvium |
9-20-1961 | 522 | 12 | .01 | .00 | 160 | 13 | 12 | 451 | 70 | 16 | .1 | 17 | 452 | 370 | 82 | 900 | ||
| 21-23E-26da | 14 | 100 | Dennis and Swope Limestones |
9-21-1961 | 296 | 9.5 | .30 | .00 | 48 | 17 | 35 | 222 | 62 | 12 | .4 | 2.2 | 190 | 182 | 8 | 530 | ||
| 21-23E-31dc | 15 | 30 | Dennis Limestone |
9-20-1961 | 351 | 7.5 | .37 | .00 | 88 | 14 | 22 | 302 | 51 | 13 | .3 | 6.2 | 277 | 248 | 29 | 630 | ||
| 21-24E-8cd | 16 | 125 | Dennis Limestone |
9-19-1961 | 374 | 9.0 | 2.9 | .00 | 108 | 7.4 | 16 | 293 | 81 | 7.0 | .2 | .4 | 300 | 240 | 60 | 640 | ||
| 21-24E-29da | 17 | 25 | Alluvium | 9-20-1961 | 264 | 12 | .15 | .00 | 65 | 15 | 9.4 | 239 | 30 | 8.0 | .4 | 6.2 | 224 | 196 | 28 | 480 | ||
| 22-23E-12aa | 18 | 43 | Terrace deposits |
9-20-1961 | 62 | 728 | 11 | 1.1 | .00 | 138 | 37 | 88 | 500 | 44 | 163 | .1 | .4 | 496 | 410 | 86 | 1,350 | |
| 22-23E-27cd | 19 | 48 | Dennis Limestone |
9-20-1961 | 1,032 | 20 | 1.6 | .47 | 144 | 58 | 158 | 695 | 74 | 169 | 1.0 | 66 | 598 | 570 | 28 | 1,830 | ||
| 22-24E-14dc | 20 | 228 | Fort Scott Limestone |
9-20-1961 | 4,296 | 9.5 | .96 | .00 | 53 | 30 | 1,620 | 1,193 | 34 | 1,960 | .6 | .4 | 256 | 256 | 0 | 7,960 | ||
| 22-24E-20ad | 21 | 87 | Holdenville Shale |
9-20-1961 | 1,102 | 7.0 | .08 | .00 | 38 | 10 | 389 | 595 | 52 | 305 | 1.6 | 6.2 | 136 | 136 | 0 | 2,030 | ||
| 22-25E-16ab | 22 | 55 | Hepler Sandstone Member of Seminole Formation |
9-19-1961 | 436 | 6.5 | .07 | .00 | 62 | 29 | 56 | 298 | 80 | 36 | .2 | 19 | 274 | 244 | 30 | 780 | ||
| 23-22E-9cc | 23 | 33 | Dennis Limestone |
3-27-1963 | 820 | 13 | 5.2 | .00 | 102 | 31 | 132 | 305 | 324 | 53 | .9 | 14 | 382 | 250 | 132 | 1,290 | ||
| 23-24E-8dd | 24 | 53 | Pawnee (?) Limestone |
9-20-1961 | 1,376 | 11 | 3.6 | .00 | 318 | 39 | 46 | 266 | 316 | 152 | .1 | 363 | 954 | 218 | 736 | 2,150 | ||
| 23-25E-7dd | 25 | 32 | Pawnee Limestone |
9-18-1961 | 382 | 7.0 | .12 | .00 | 4O | 13 | 74 | 168 | 74 | 42 | .3 | 49 | 154 | 138 | 16 | 660 | ||
| * In areas in which the nitrate content of water is known to exceed 45 ppm, the public should be warned of the potential dangers of using the water for infant feeding (U.S. Public Health Service, 1962, p. 7). | ||||||||||||||||||||||
Various graphical and computer techniques were used during the course of this study in an attempt to gain some understanding of the general chemical characteristics of ground water in the county. Figure 8 shows total dissolved solids in each water sample in parts per million (ppm), depth of well, and lithology of the aquifer from which the water sample was obtained. The highly mineralized water sample from Mississippian age rocks (well number 20-22E-15c) is not shown. Total dissolved solids as used here represents the sum of dissolved mineral constituents in the water. The range in values illustrates the diversity of water quality in the county.
Figure 8--Location and depth of sampled wells, lithology of aquifers, and total dissolved solids of water.
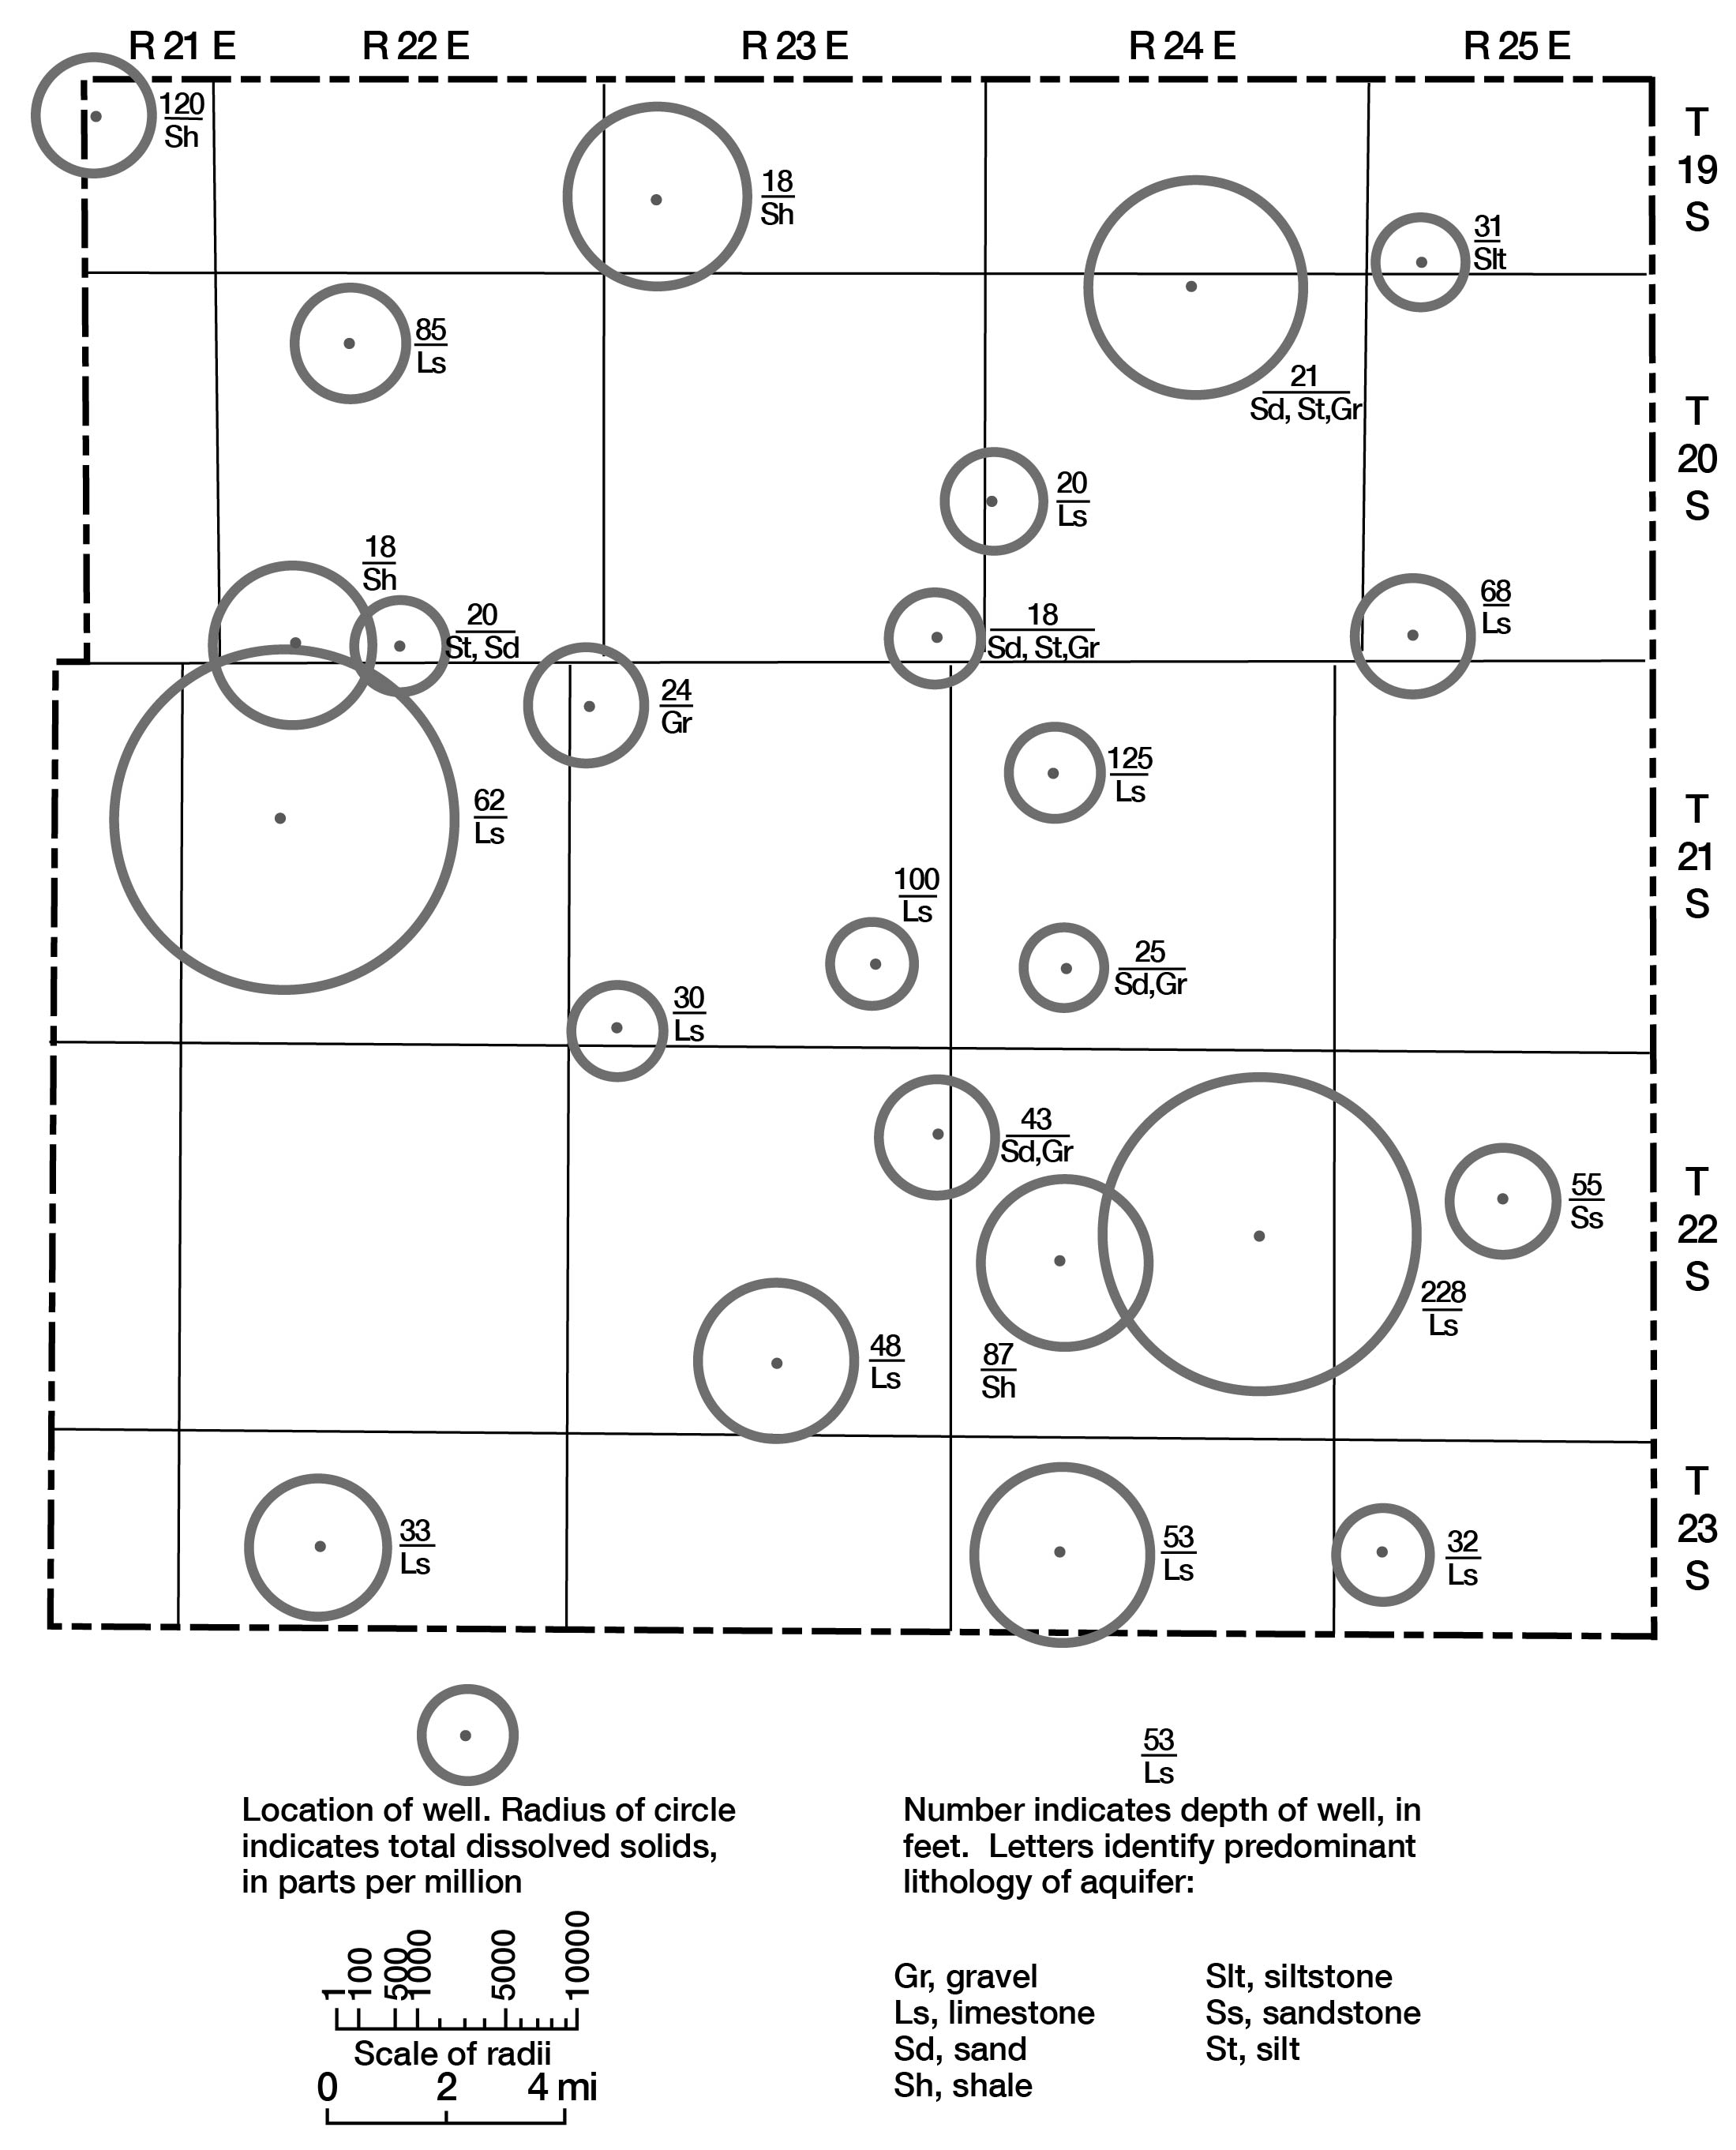
Wells 20-24E-3ba (depth 21 feet) and 21-22E-17ac (depth 62 feet) in alluvium and Dennis and Swope Limestones, respectively, have water with high total dissolved solids content when compared with water from similar aquifers and comparable depths. The analyses of water from these wells show that the high dissolved solids can be attributed to sodium and chloride. The precise source of the mineralization is not known, but by using Na/Cl ratios obtained from the analyses, some inferences can be made. In situations where natural chemical conditions prevail, a Na/Cl ratio of 0.8000 or greater can be expected (Walter E. Hill, Jr., Chemist, State Geological Survey of Kansas, written commun., 1961). Lower ratios indicate that high sodium-chloride water is being introduced into the aquifer. The Na/Cl ratio at well 20-24E-3ba is 0.3219. This ratio is low enough to indicate possible pollution from brines or wastes being introduced into the aquifer and not from natural pollution. The Na/Cl ratio at well 21-22E-17ac is 0.6842. This ratio is marginal and does not definitely indicate an unnatural chemical situation in the aquifer. The chloride content (2,800 ppm) is, however, unusually high for the reasonably shallow depth (62 feet) of the well.
Well 22-24E-14dc in the Fort Scott Limestone yields water that is also high in dissolved solids and has a chloride concentration of 1,960 ppm. The Na/Cl ratio is 0.8265, which indicates that natural conditions probably are responsible for the increased salinity. The depth of the well (228 feet) places it in a zone sufficiently deep that higher total solids and higher salinity should be expected.
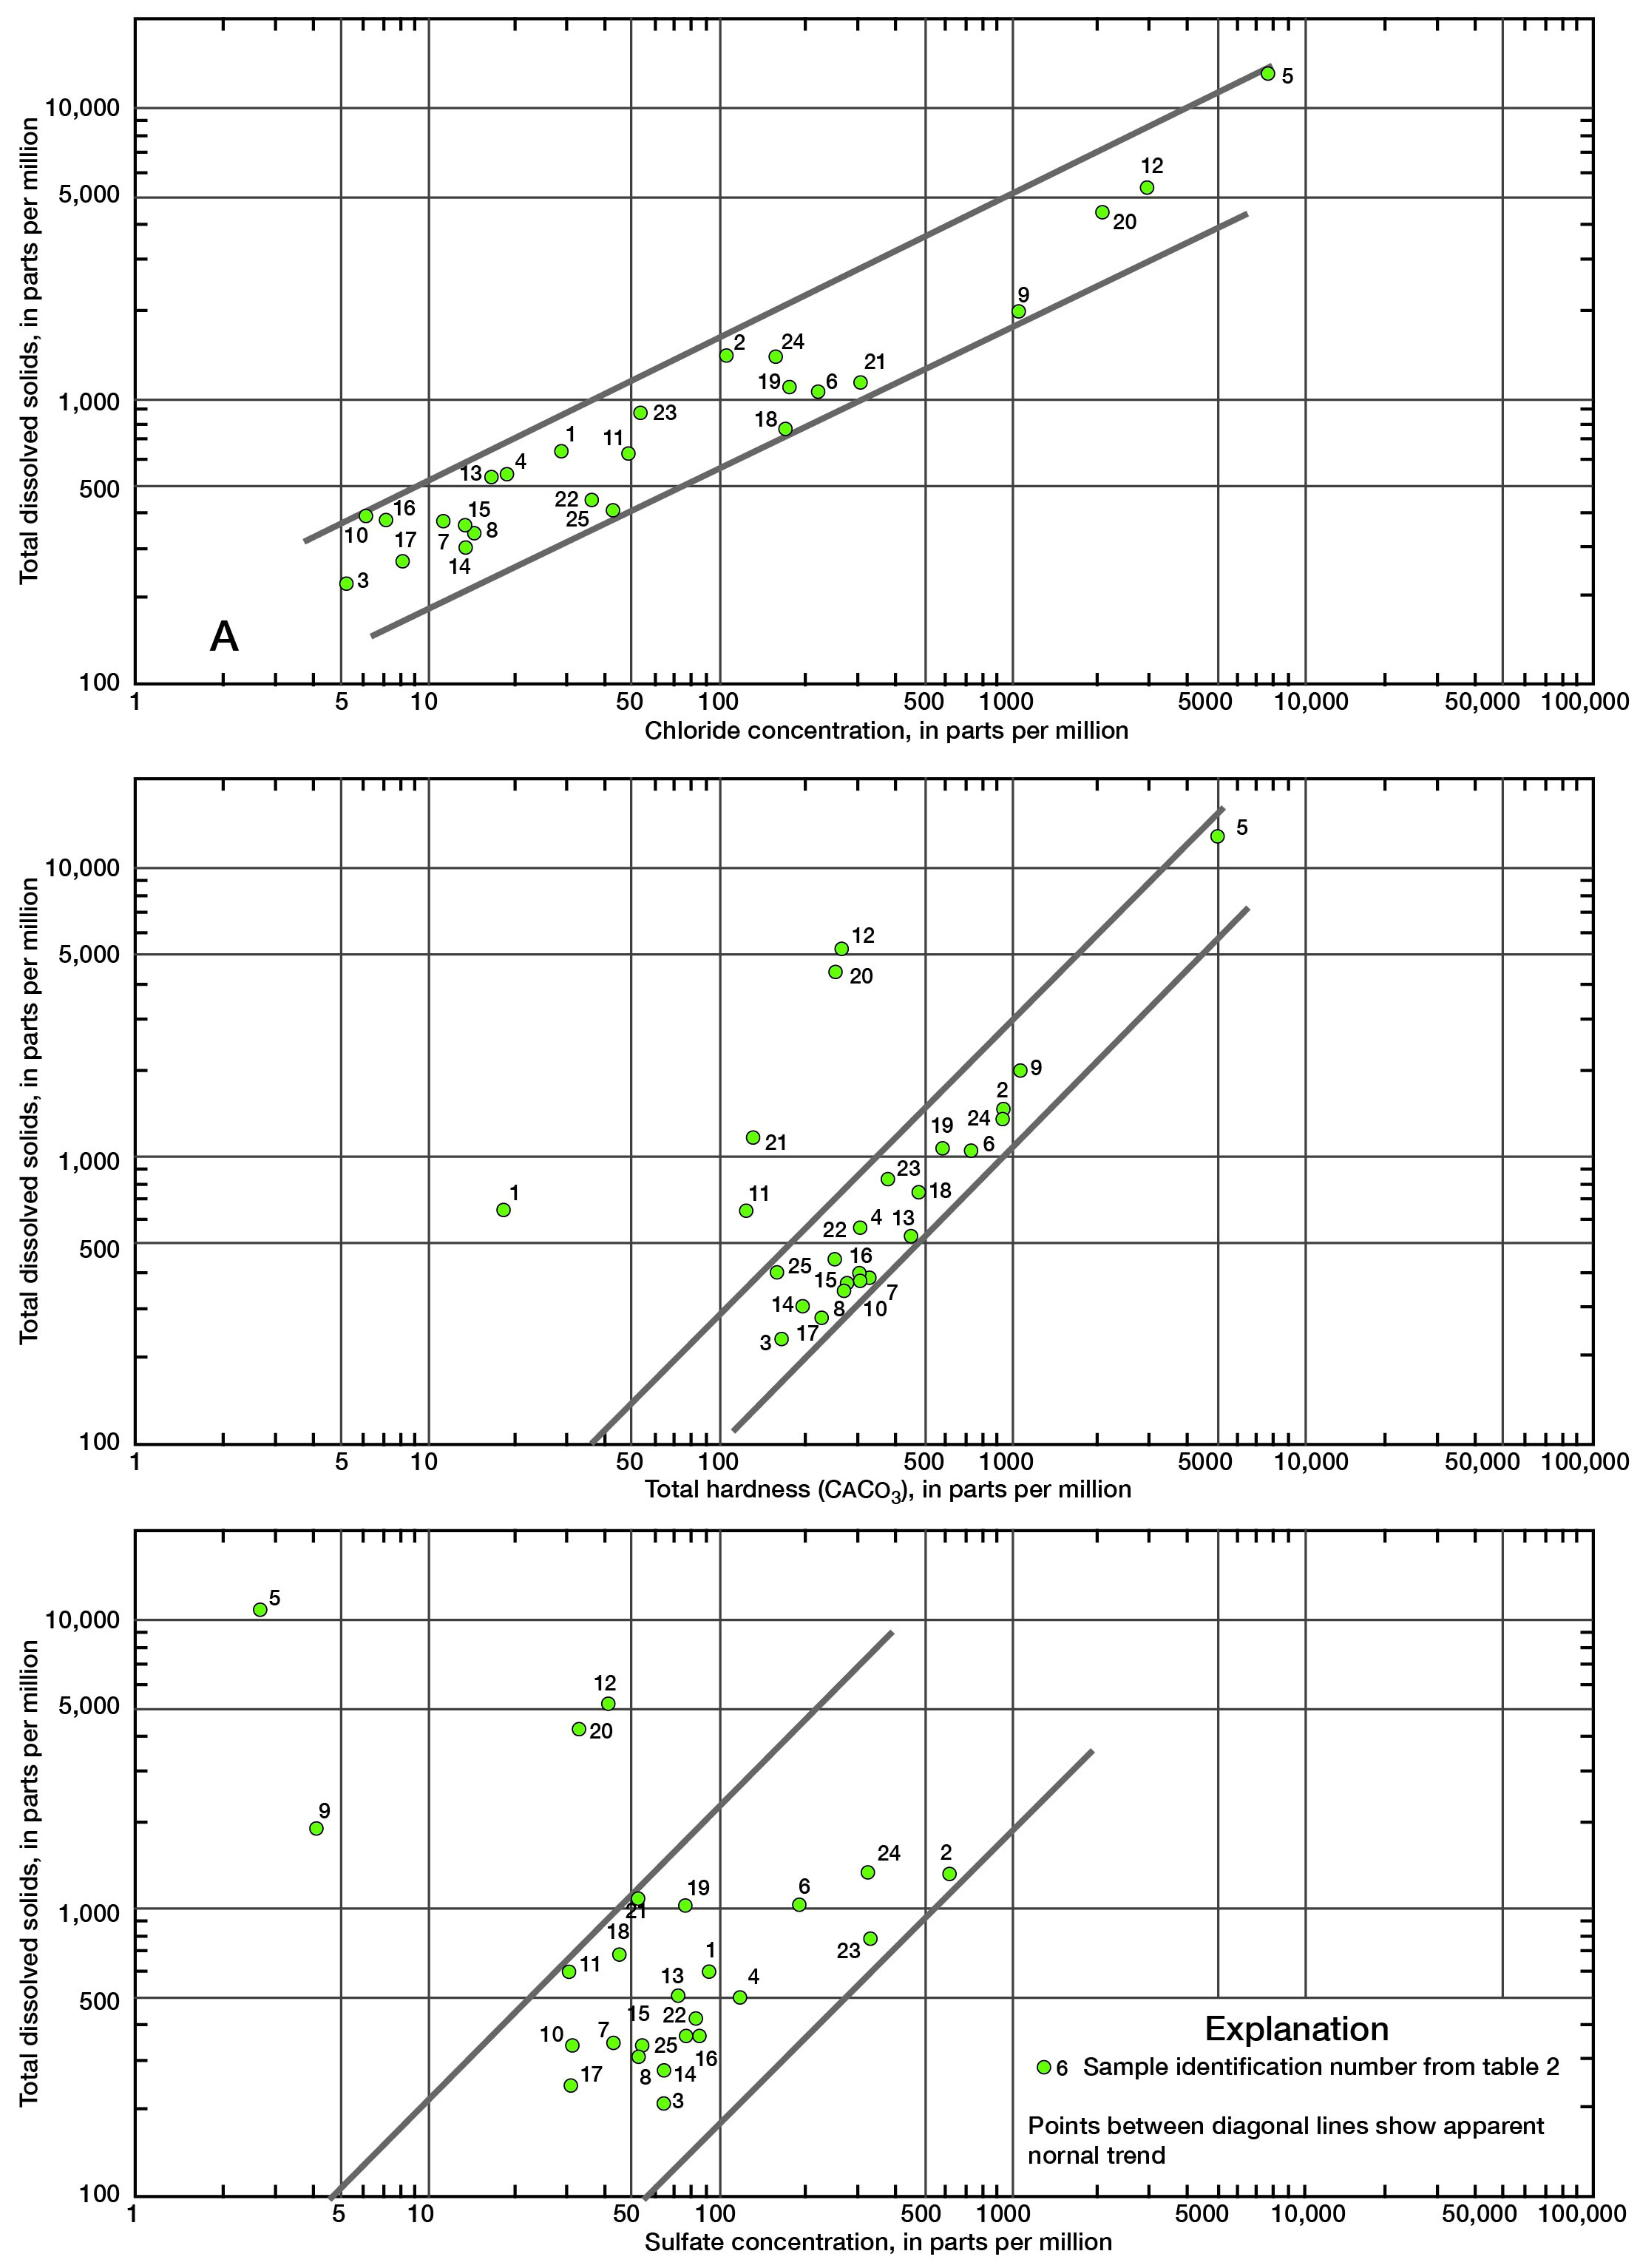
A log-log plot of total dissolved solids versus chloride concentration (fig. 9A) shows the relationship of these two constituents in Linn County.
A log-log plot of total dissolved solids versus total hardness (fig. 9B) illustrates the normal relationship of these two constituents in ground waters in Linn County. It is probable that points well off the normal trend show base exchange of sodium for calcium (natural softening). These samples also have relatively high fluoride content which indicates the presence of a natural zeolite or collophane [Ca5F(PO4)3] in the aquifer.
Figure 9C shows the relationship of sulfate concentration to total dissolved solids. It may be noted that the three wells previously discussed, which are high in chloride and dissolved solids, plot far off the normal trend. Most of the brines from deeper formations have a very low sulfate content. If pollution is occurring in the shallow aquifers, then the sulfate concentration should probably stay relatively low with an increase in total dissolved solids and salinity.
Figure 9--Relationship between total dissolved solids and (A) chloride concentration, (B) total hardness, and (C) sulfate concentration. A larger version of this figure is available.
The significance of each of the several constituents is discussed in the following paragraphs, excluding well 20-22E-15c, and is described in table 3. For a more detailed treatment of this subject, the reader is referred to Hem (1959).
Dissolved solids--Dissolved solids is the total quantity of dissolved mineral matter remaining after evaporation of the water sample. The taste and overall quality of water containing less than 500 ppm dissolved solids are not affected except where iron and hardness are excessive. Water containing more than 1,000 ppm total solids is generally objectionable. Water samples collected in Linn County had dissolved solids ranging from 222 to 5,163 ppm.Table 3--Significance of certain chemical constituents in ground water.
| Constituent | Recommended limit, ppm (1) |
Range in Linn County, ppm (2) |
Undesirable effects |
|---|---|---|---|
| Total dissolved solids | 500 | 222-5,163 | Taste affected when quantity exceeds 500 ppm. |
| Manganese | 0.05 | 0.00-0.47 | Impairs taste of water and produces brown stain. |
| Iron | 0.3 | 0.01-5.2 | Iron may be easily tasted in drinking water containing more than 1.8 ppm and may cause staining of laundry and plumbing fixtures when the amount exceeds 0.3 ppm. |
| Fluoride | 0.8-1.5 (for annual average maximum air temperatures from 53.8° F to 58.3° F) Optimum level for this temperature range 1.1 | 0.1-4.6 | Excessive fluoride in drinking water produces objectionable dental fluorosis. Other expected effects from excessively high concentrations include bone changes when water containing 8-20 ppm is consumed over a long period of time, crippling fluorosis when 20 ppm or more is consumed per day for 20 or more years, and death when 2,250-4,500 ppm fluoride is consumed in a single dose. |
| Nitrate | 45 | 0.4-363 | Water containing nitrate in excess of 45 1)1)in may cause nitrate poisoning of infants (cyanosis). |
| Sulfate | 250 | 4.1-608 | Water containing sulfate in excess of 750 ppm has a laxative effect (500 ppm when water is also high in magnesium). Can be tasted when concentration exceeds 250 ppm. |
| Chloride | 250 | 5.0-2,800 | Can be tasted when concentration exceeds 250 ppm. |
| (1) U.S. Public Health Service, 1962. (2) Sample No. 5, table 2, not considered. |
|||
Hardness--Hardness of water is generally recognized by the increased quantity of soap required to produce lather. Hardness is a function of the calcium carbonate equivalent to the calcium and magnesium and all other cations individually determined. Calcium and magnesium are responsible for almost all hardness.
Salts of calcium and magnesium carbonate may be removed from water by ordinary softening processes. However, compounds of magnesium and calcium formed with the sulfate or chloride anion cannot be removed in this way, and water containing these anions is considered permanently hard.
Water with a total hardness from 0 to 60 PPM is considered soft; 61 to 120 ppm, moderately hard; 121 to 180 ppm, hard; and in excess of 180 ppm, very hard. Water samples collected in Linn County had a range in total hardness from 18 to 1,070 ppm.
Iron--The occurrence of iron in excess of a few tenths of a part per million is objectionable. Water containing more than 0.3 ppm iron has an objectionable taste and will stain laundry and plumbing fixtures. Iron concentrations in water samples from Linn County ranged from 0.01 to 5.2 ppm.
Fluoride--According to many dental authorities, the occurrence of fluorides in drinking water in concentrations of about 1 ppm will prevent or lessen tooth decay in children. However, concentrations in excess of this amount will cause a dental defect known as mottled teeth in children up to 12 years of age (Dean, 1936, 1938). Fluoride concentrations in water samples from Linn County ranged from 0.1 to 4.6 ppm.
Nitrate--Water containing concentrations of 45 ppm or more of nitrate is considered by the U.S. Public Health Service to be the cause of cyanosis (blue babies) when used in the preparation of formulas. Boiling will not render water high in nitrate safe; in fact, it may increase the concentration. Nitrate in water is considered a final oxidation product of nitrogenous material and may indicate organic contamination. Nitrate concentrations in water samples from Linn County ranged from 0.4 to 363 ppm.
Sulfate--Sulfate is one of the most common ions present in natural waters and is commonly derived from solution of iron sulfide and calcium sulfate. Sulfate combined with magnesium (epsom salts) and sodium (glaubers salt) in concentrations exceeding 500 ppm may have a laxative effect on some persons.
In Linn County high concentrations of sulfate are noted in water associated with black shale, coal, and other rock units containing large amounts of iron sulfide. Concentrations are reported to increase during dry periods when water remains in contact with the sulfides for longer periods of time. Sulfate concentrations in water samples from Linn County ranged from 4.1 to 608 ppm.
Chloride--Chloride in combination with sodium forms table salt (NaCl), one of the more common chloride salts found in Linn County ground water. Concentrations of less than 250 ppm chloride normally do not affect the taste of water. However, concentrations in excess of this amount do affect the taste and are, according to most authorities, objectionable.
In Linn County ground water obtained at depths greater than 100 feet generally contains objectionable quantities of chloride and is not often used. Excessive concentrations of chloride at depth are considered natural because of their uniform distribution at uniform depth over the entire county. Chloride concentrations in water samples from Linn County ranged from 5.0 to 2,800 ppm.
Hydrogen sulfide--Although no attempt was made to measure hydrogen sulfide in ground-water samples collected in Linn County, its pungent odor (like rotten eggs) was noted in a number of water samples. Even in very small quantities, hydrogen sulfide is noticeable and objectionable and, in combination with iron, will form a black precipitate (iron sulfite).
Utilization
The greatest use of ground water in Linn County is for domestic and stock purposes. One municipality, La Cygne, formerly used ground water, and several oil fields in the county are repressured with mineralized water pumped from Ordovician limestone.
Domestic and stock--There are approximately 850 wells in rural Linn County which supply all or most of the domestic and stock supplies. In 1961 and 1962 the amount of water derived from wells and springs, with the exception of municipal and industrial sources, was estimated to be about 350,000 gallons per day.
Approximately 50 percent of the wells in Linn County are dug wells. These wells are several feet in diameter near the surface and increase in diameter with depth. Dug wells in this area commonly penetrate only the upper part of the aquifer and are likely to "go dry" during prolonged periods of drought. Yields from dug wells are normally small, and the wells are subject to contamination.
Drilled wells in Linn County are generally about 100 feet in depth and commonly penetrate one or more aquifers. Wells of this type are installed with percussion-type drills and generally range in diameter from 6 to 8 inches. Casings in these wells normally are set from ground surface down to the first resistant rock layer in order to prevent contamination.
Municipal--The municipal water system at La Cygne, until 1964, depended solely on ground water. Two wells were used--a large-diameter dug well that penetrates water-bearing terrace gravels, and a gravel-packed well that obtains water from gravel and sand near the base of the Marais des Cygnes valley fill. The dug well served as the principal source through much of the year, and the gravel-packed well was used during periods of peak demand. Water was pumped from these wells into a 60,000-gallon elevated tank. In 1960 average daily consumption was reported to be 57,000 gallons per day.
Availability
In this report, "small" supplies of ground water refer to yields of less than 10 gpm (gallons per minute) and "moderate" supplies refer to yields greater than 10 gpm but less than 50 gpm. Except locally in alluvial deposits, yields greater than 50 gpm are not available in the county.Cambrian and Ordovician Systems
No well in Linn County penetrates rocks older than the Arbuckle Group. Most wells in the county that penetrate the Arbuckle Group produce some highly mineralized water, particularly from the sandy and cherty zones in the undifferentiated Cotter and Jefferson City Dolomites and the Roubidoux Formation.
A well drilled into the Roubidoux Formation a number of years ago for the city of Butler, in Bates County, Mo., 16 miles east of Linn County, encountered highly mineralized water reported to contain 2,500 ppm chloride and 165 ppm sulfate. This well was pumped at a rate of 150 gpm.
Devonian System
In Linn County no well is known which obtains water from the Chattanooga Shale. According to Schoff (Reed and others, 1955), the hydrologic importance of this unit is that it serves as a barrier between water in the Arbuckle Group and water in the Mississippian limestone.
Mississippian System
In Linn County most of the wells drilled into rocks of the Mississippian System encounter some very highly mineralized water (see analysis for 20-22E-15c, table 2) in one or more zones. Silicious zones composed principally of chert and normally less than 10 feet thick are the most common water-bearing zones in this sequence. Estimates based on bailer tests by drillers suggest that yields from these zones in excess of 10 gpm are rare.
Pennsylvanian System
Aquifers of Pennsylvanian age provide most of the ground water for domestic use in Linn County. Individual yields obtained from these aquifers are small and locally inadequate; however, most formations provide enough water for domestic purposes. Limestones, especially the thicker members of the Kansas City Group, are the most important aquifers, sandstones are next in importance, and shales and siltstones are least important.
Knowledge of the hydrologic properties of the several Pennsylvanian rock units is based largely on random sampling of typical water wells in the county and on reports by water-well drillers and well owners. Following is a discussion, by groups, of the Pennsylvanian rock units that yield water.
Cherokee Group
Large quantities of highly mineralized water are obtained from thin layers of residual chert along the Mississippian-Pennsylvanian contact zone, and from the Warner Sandstone and Bluejacket Sandstone Members of the Krebs Formation in Linn County. Many oil and gas wells in the county penetrate these water-bearing zones, and considerable quantities of mineralized water have been brought to the surface together with the oil and gas; some of this water has been a source of pollution. According to most drillers and oil and gas producers in the county, water from these zones is too highly mineralized to use. However, several miles east of the southeastern corner of Linn County, potable water is obtained from this group and is used by several municipalities.
At the town of Hume a single well drilled to the base of the Cherokee Group provides water for about 100 people. The well is reported to obtain water from the base of the Cherokee Group at a depth of 600 feet and from the Bartlesville sand at a depth of 400 feet. The well is normally pumped at about 35 gpm, and the reported specific capacity is about 3 gpm per foot of drawdown. These facts are mentioned for the reason that less mineralized water might move northwestward at some time in the future.
Marmaton Group
Due to the dominance of fine-grained lithologies and the thinness of the several carbonate rock units, very little ground water is obtained from the Marmaton Group in Linn County. Most successful wells drilled into the Marmaton Group obtain water from either the Pawnee Limestone or the Altamont Limestone. The Fort Scott Limestone in Linn County normally is below the zone of fresh water, and the Lenapah Limestone is too thin and nonpersistant to be of importance. Other water-bearing zones in the Marmaton Group include contact zones especially between rocks of contrasting lithologies, such as coal beds and black fissile shales, where some ground water may be recovered.
Pleasanton Group
With the exception of the relatively thin layers of sandstone at the base and near the top of the group, there are no significant zones within the Pleasanton Group which will transmit water. Consequently, very few of the wells o served in Linn County depend solely on the rocks of this group as a source of water.
Within the vicinity of their outcrops, sandstone members of this group are poorly situated topographically to receive recharge and too fine grained to transmit water. The small quantity of water that does move through these rocks is usually in vertical joints and permeable zones along bedding planes.
Kansas City Group
The most productive Pennsylvanian aquifers in Linn County are the thick limestone members of the Swope and Dennis Limestones. The combined thickness of these adjacent formations is great, and areally they directly underlie a considerable part of the county. The nearly flat and poorly drained surfaces directly underlain by these formations are well suited as recharge areas.
The permeability of the thicker limestones is relatively high as a result of solution widening of jolnts and other rock openings. Both limestones also are underlain by widespread black fissile shale, which tends to retard downward percolation of water and to conduct water along permeable horizontal planes.
Water wells that penetrate these lower rocks of the Kansas City Group are normally successful; however, the yield of a well is dependent on the number and size of rock openings intersected in the limestones and on the thickness and permeability of the black shale members. For this reason larger-diameter wells generally yield larger quantities of water.
The remaining part of the Kansas City Group is composed mainly of fine clastic deposits which yield little water, and with the exception of the Wyandotte Limestone, no important aquifers are present within this interval. The thick limestone facies of the Wyandotte Limestone found locally near the northwestern corner of the county is similar lithologically to the thick limestone units at the base of this group and probably is hydrologically similar. Because of the limited area of exposure within the county, few wells that penetrate this limestone were inventoried.
Lansing Group
As only a few square miles in the northwestern corner of Linn County are underlain by the Lansing Group, a representative number of water wells was not examined. However, because of the lithologic similarity between the thick limestones of this group and the lower limestones of the Kansas City Group, it is assumed that their hydrologic properties are similar.
Quaternary System
The largest supplies of ground water in Linn County are contained in the unconsolidated Illinoisan, Wisconsinan, and Recent alluvial deposits. These deposits underlie about 110 square miles in the county (pl. 1). Other Quaternary deposits, the Kansan and pre-Kansan gravel and colluvial deposits, are not water bearing.
Illinoisan Deposits
A number of domestic wells yield small supplies of water (about 10 gpm) from the basal gravel in the Illinoisan terrace deposits.
Former La Cygne city well No. 20-24E-5aaa, a dug well 20 feet in diameter and 38 feet deep, penetrates 3.5 feet of gravel near the base. Three short horizontal galleries extend into the gravel. This well was pumped at an average rate of about 30 gpm for a number of years. This well indicates that properly constructed and developed wells that penetrate this basal gravel may yield more than 30 gpm, but yields of 10 gpm from present small wells are more common.
Thickness of the saturated zone rarely exceeds 5 feet and decreases toward the topographic divide. Consequently, pumping rates, which result in moderate drawdown only, are possible. However, the specific capacity (gallons per minute per foot of drawdown) is comparatively large, and these deposits receive considerable recharge from both rainfall and abutting bedrock formations (fig. 7). The areal extent of the Illinoisan terrace deposits is about 34 square miles as mapped (pl. 1). This amount represents only a small part of the total area of Linn County, but is a potential source for several installations requiring moderate supplies of water. The construction and performance of the large-diameter city well at La Cygne illustrate the potential of these deposits for further development. The yield of this well also suggests that wells with more and longer collection galleries might support larger pumping rates.
Wisconsinan and Recent Deposits
In the sparsely settled flood plains of the Marais des Cygnes River and its tributaries several shallow dug wells, one municipal well No. 19-24E-33ccc, and a number of augered test holes penetrate and obtain water from gravel at the base of Wisconsinan deposits. About 75 square miles are underlain by these deposits in Linn County.
In December 1960 a number of test holes were augered in the Marais des Cygnes Valley from La Cygne west to the bedrock valley wall. Figure 7, a geologic section drawn on the basis of data obtained from these holes, shows that the thickness of these deposits ranges from about 30 feet near the edge of the valley to 50 feet near the middle of the valley. The saturated thickness varies in the same direction from 23 to about 40 feet. In December 1960 the average static water level in this area was about 12 feet below land surface.
Wells that penetrate only the upper few feet of the zone of saturation, as many domestic wells do, may obtain only a few gallons of water per minute, but wells which penetrate the gravel at the base of these deposits may obtain more than 100 gpm. The specific capacity of a gravel-packed municipal well at La Cygne, which obtains water from Wisconsinan deposits, was 6.3 gpm per foot of drawdown in 1935 when the well was drilled and 5.4 gpm per foot in 1953. Similar hydrologic properties are reported by Williams (1944) from a well drilled through comparable deposits in the Neosho River valley fill in northeastern Labette County. In this area a test well penetrating 30 feet of silt, clay, and about 5 feet of coarse gravel was pumped for 98 hours at an average rate of 90 gpm. According to Williams, the specific capacity of this well was 3.9 gpm per foot of drawdown and the permeability of the aquifer was 420 gallons of water per day per square foot.
A hydrologic study in the Neosho River valley during the summer of 1964 supports Williams' data for these similar deposits. Forty test holes were drilled within the valley between Iola and the Kansas-Oklahoma border and nine 6 1/4-inch observation wells with slotted-pipe well screens were installed and developed. These wells were pumped at an average rate of 20 gpm for periods of no longer than 1 hour. Specific capacities measured during these preliminary tests varied from 3.6 gpm per foot of drawdown to 87 gpm per foot, and averaged about 7 gpm per foot.
The saturated thickness, areal extent, and pumping data available indicate that a large quantity of ground water is in storage and is available for pumping in these deposits in Linn County. Yields of 100 gpm or more probably could be developed from properly constructed wells. The chemical quality of this available water is fair. It is hard at some locations, containing mostly carbonate hardness (see table 2), and might require treatment for some uses. Runoff and discharge from the valley sides provide most of the recharge to the alluvium. Occasional flood water from the streams at high stage is also a source of recharge. Much of this recharge is being rejected by the saturated aquifer and leaves the area as streamflow. Increased pumping from wells would intercept some discharge to the streams and provide space for increased storage from recharge. Therefore, a perennial supply to wells is indicated and considerable development appears possible.
Prev Page--Geologic units || Next Page--Well Records
Kansas Geological Survey, Geology
Placed on web June 8, 2009; originally published November 1969.
Comments to webadmin@kgs.ku.edu
The URL for this page is http://www.kgs.ku.edu/General/Geology/Linn/04_gw.html