![]()
Prev Page--Ground Water || Next Page--Recharge
Ground Water, continued
The Water Table and Movement of Ground Water
The permeable rocks that lie below a certain level in Ford County and elsewhere generally are saturated with water under hydrostatic pressure. These saturated rocks are said to be in the zone of saturation, the upper surface of which is called the water table. The permeable rocks that lie above the water table may be said to be in the zone of aeration. The relation of the zone of saturation to the zone of aeration is shown in figure 6. The water that enters from the surface into the soil is slowly drawn down by gravity through the zone of aeration to the zone of saturation, except that which is retained by molecular attraction. In fine-grained material the earth is always moist several feet above the water table due to capillarity and this moist belt is called the capillary fringe. Water in the capillary fringe or in transit in the zone of aeration is not available to wells, hence wells must be sunk to the water table before water enters them.
Figure 6--Diagram showing divisions of subsurface water. (After O.E. Meinzer.)
Where permeable rock is homogeneous down to a considerable depth there is only one zone of saturation, but in certain localities the water may be hindered in its downward course by an impermeable or nearly impermeable bed to such an extent that it forms a upper zone of saturation, or perched water body, that is not associated with the lower zone of saturation. The water table is said to be absent in places where impermeable material immediately overlies the zone of saturation. Small bodies of perched water have been recognized in Ford County, notably along several dry stream courses tributary to Cow Creek in the northeastern part of the county and in certain local areas mantled by dune sand north of Arkansas River northwest of Ford.
Shape and Slope
The shape and slope of the water table in Ford County are shown on the map (pl. 1) by means of contours drawn on the water table. Each contour line has been drawn through points on the water table having approximately the same altitude. Collectively they show the configuration of the upper surface of the groundwater body in much the same manner as contours on topographic maps show the general shape of the land surface. The altitudes of the water surfaces in each of the wells that were used in compiling the map have been referred to sea-level datum. Groundwater moves in the direction of maximum slope, which is at right angles to the contours. The position of the contours indicates that the water table in general slopes eastward, but that the amount of slope varies considerably because of irregularities of the water table.
The shape of the water table, which in turn determines the rate and direction of movement of ground water, is controlled by several factors. Irregularities in the shape of the water table under Ford County may be caused by: (1) the configuration of the underlying Cretaceous floor; (2) discharge of groundwater into perennial streams; (3) recharge of the groundwater body by ephemeral streams; (4) differences in the altitude of the water table in wells that tap different water-bearing formations; (5) unequal addition of water to the groundwater reservoir at different places; (6) local differences in the permeability of the deposits, and (7) local depressions on the water table caused by the pumping of water from wells.
The slope of the bedrock floor formed by the underlying Cretaceous rocks controls to a large degree the direction of movement of the water in Ford County. Thus, south of the Arkansas valley the water table conforms in general to the eastward-sloping bedrock floor, the average slope being about 7.2 feet to the mile. The water table contours in this part of the county are roughly parallel and are spaced more uniformly than they are north of the river. The contours show that the water table slopes slightly southeastward in the vicinity of Kingsdown and Bucklin.
The upfold or anticline in the Cretaceous rocks, which extends from the city of Ford northwestward into Hodgeman County (p. 11), has a pronounced effect on the position of the contours in the northeastern part of the county, where the slope of the water table is controlled largely by the position of the underlying Dakota formation, which dips toward the northeast. The Dakota formation has been encountered in numerous water wells in this part of the county at depths ranging from about 50 feet to 100 feet or more. In the vicinity of Bellefont and Windhorst, where the Dakota is known to lie at relatively shallow depth, the contours appear to be more closely-spaced than in areas where the Dakota lies at greater depth.
The slope of the water table and the direction of movement of the groundwater are also influenced by the discharge of groundwater into perennial streams. Along valleys that have been cut below the water table, the water table slopes toward the areas of discharge along the streams. Streams of this type that commonly gain water from the zone of saturation are said to be effluent streams (figure 7). Arkansas River and Sawlog, Duck and Crooked creeks are good examples of effluent streams in Ford County.
Figure 7--Diagrammatic sections showing influent and effluent streams. (After O.E. Meinzer.)
The contours show that in the vicinity of the Arkansas valley the water table slopes rather uniformly toward the river from both sides and also slopes downstream toward the vicinity of Ford, indicating that water flows into the valley from both sides and thence down the valley. The contours also indicate that slight groundwater divides exist both north and south of the Arkansas valley throughout most of its course. The divide north of the river is more pronounced than that south of the river and extends farther back from the river, the distance ranging from about 2 to 5 miles and increasing from east to west; whereas, the divide south of the river nearly everywhere is within 2 miles of the river. East of Ford the river changes direction and flows northeastward. According to the contours in this section of the valley, the water table is sloping in a northeastward direction and the river appears to be in approximate equilibrium with the water table. Arkansas River has an average gradient of 7 feet to the mile in its course through Ford County.
In the northern part of the county, where Sawlog creek and some of its tributaries have cut their valleys below the water table, the slope is principally northward and the contours indicate movement of water into the stream channels.
Streams that flow only after rains are classed as ephemeral or intermittent streams. Their channels are above the water table and are dry much of the time. During periods of stream flow part of the water in an ephemeral stream may seep into the streambed and descend to the water table. Streams of this type are called influent (figure 7). The lower part of Mulberry creek is influent and the water table on both sides of the creek for several miles above its mouth may be affected by occasional periods of stream flow. Coon and Rattlesnake creeks may be influent also, but, if so, they do not seem to affect the water table appreciably. Artificial lakes or other bodies of impounded water may also be influent and contribute water to the zone of saturation. The water-table contours in the vicinity of Ford County Lake and Hain Lake (pl. 1) do not indicate that there is any appreciable recharge from these lakes. The water levels in these lakes were low at the time of the field investigation as a result of subnormal precipitation, however, and it is possible that there may be recharge during periods when the lake levels are higher.
An important factor that is responsible for at least sonic of the irregularities in the water table under Ford County is the presence in some parts of the county of more than one water-bearing formation, each of which may contain water under different hydrostatic pressure. Under such conditions the water levels in adjacent wells that penetrate different formations may stand at different altitudes. Thus, in an area in the northern part of the county (pl. 1) the water levels in some of the deeper wells that obtain, water from the Greenhorn limestone and the Dakota formation stand lower than the water levels in nearby wells that draw from the Ogallala formation. There are appreciable differences in the static water levels of some adjacent wells that penetrate different water-bearing formations. Thus, wells 63 and 64 are only half a mile apart, yet the water level in the latter is 109.6 feet lower than in the former. Well 63 penetrates the Ogallala formation whereas well 64, which is much deeper, penetrates the Greenhorn limestone and possibly also the Dakota formation. In this part of the county it is difficult to obtain satisfactory water supplies because the Ogallala formation is thin and in places is absent entirely so that it has been necessary to depend upon rather meager supplies in the underlying bedrock formations.
Unequal additions of water to the groundwater reservoir are responsible for some of the irregularities in the shape of the water table in Ford County. In areas where conditions at the surface are especially favorable for groundwater recharge the water that percolates downward tends to build up the water table to form slight mounds or high areas. The water-table contours in plate 1 show a rather pronounced mound along the belt of sand hills bordering the river northwest of Ford, that may be attributed to the more favorable conditions for recharge in this sandy area.
Local differences in the permeability of the water-bearing beds affect the shape of the water table. Other things being equal the slope of the water table in any area in general varies inversely with the permeability of the water-bearing material. Thus, the flow of groundwater varies from place to place according to thickness and permeability of the water-bearing material. The permeability of the Ogallala formation is extremely variable as a result of changes in the character of the deposit from one locality to another. In certain areas in the northeastern part of the county the gradient of the water table is steeper because of the fact that the permeability of the fine-grained sandstones of the Dakota formation is lower than that of the overlying Ogallala formation.
Relation to Topography
In Ford County the depth to water level below the land surface is controlled largely by the configuration of the land surface. A map (pl. 2) has been prepared showing the depths to water level in wells in Ford County by means of isobath lines--lines of equal depths to water level. These lines delimit areas in which the depth to water level lies within specified ranges. As shown on this map, the depth to water level ranges from less than 10 feet to about 200 feet. In general the depth to water level is less than 25 feet in the Arkansas valley and in most of the other principal stream valleys and is more than 100 feet beneath the uplands of the county. The water table lies deepest in the southern part of the county in the vicinity of Kingsdown. The relation between the water table and the land surface is shown in the three geologic sections across Ford County in plate 5.
Ford County may he divided into several areas based upon the depth to water level as follows: (1) shallow-water areas, (2) deep-water areas, and (3) areas of intermediate depth to water level. The shallow-water areas may be subdivided into the valley shallow-water areas, the northeastern shallow-water area, and the southwestern shallow-water area. The deep-water areas are in general the upland areas and may be subdivided into the northern deep-water area, the Bloom-Kingsdown deep-water area, and the west-central deep-water area.
Valley shallow-water areas--The Arkansas valley is the largest and most important shallow-water area in the county. The water table stands less than 25 feet below the land surface in the Arkansas valley, which ranges in width from 2 or 3 miles in the western part of the county to 7 or 8 miles in the extreme eastern part. There are narrow belts along both sides of the valley in which the depth to water level ranges from 25 to 50 feet (pl. 2). Smaller shallow-water areas occur in the narrow valleys of many of the smaller streams, the more important of which are Sawlog and Duck creeks and their tributaries in the northern part of the county, Coon creek and its tributaries in the northeastern part, Crooked Creek in the southwestern part, and Mulberry creek. Most of the wells in the stream valleys obtain water from alluvium, but some of the wells in the Arkansas valley have been drilled through the alluvium into the Ogallala formation.
Northeastern shallow-water area--The northeastern shallow-water area covers most of the northeastern quarter of the county. The depth to water level is less than 100 feet and in much of the area is less than 50 feet (pl. 2). The shallow depth to water level in this part of the county is due in part to the shallow depth of the Dakota formation which supplies water to many of the wells, and in part to the relatively low altitude of the land surface in this area. In some parts of the area the Ogallala formation appears to be thin or absent, but where present may supply some water to wells. In the vicinity of Arkansas River near the eastern line of the county the depth to water level is less than 25 feet in an area covering more than 20 square miles. Most of the wells in this part of the county are supplied from the alluvium.
Southwestern shallow-water area--The southwestern shallow-water area covers about 22 square miles in the southern part of T. 29 S., R. 26 W., in the southwestern corner of Ford County (pl. 2). The depth to water level in this area is less than 50 feet, and in part of the area it is less than 25 feet. The shallow-water area occurs along Crooked Creek and is the northern extension of the Meade County artesian basin. Most of the wells in this area are supplied from Pleistocene sands and gravels or from the Ogallala formation, but a few may obtain water from the Dakota formation. There are several flowing artesian wells in the vicinity of Crooked Creek (p. 51). Several successful irrigation wells have been drilled and the possibilities of developing additional supplies for irrigation in this area are discussed on page 121.
Northern deep-water area--The northern deep-water area is about 7 miles north of Dodge City and includes parts of sections 7, 8, 9, 10, 13, 14, 15, 16, 17, 18, 23 and 24 T. 25 S., R. 25W. (pl. 2).
The depth to water level in most of the area is more than 100 feet and locally is more than 150 feet. The Ogallala formation is thin or entirely absent in this part of the county and many of the wells have been drilled into the underlying Cretaceous rocks to obtain water supplies. Some of the wells may obtain scanty supplies from the Greenhorn limestone, but the deeper wells doubtless derive water from the Dakota formation.
Bloom-Kingsdown deep-water area--The Bloom-Kingsdown deep-water area in southern Ford County comprises about 20 square miles in the vicinity of Bloom and Kingsdown in which the depth to water level ranges from 150 feet to a maximum known depth of 197 feet in well 476, 4 miles southwest of Kingsdown--the deepest water level observed in the county (pl. 2). The wells in this area derive water from the Ogallala formation.
West-central deep-water areas--The west-central deep-water areas comprise two long narrow belts in western Ford County in which the depth to water level is more than 150 feet (pl. 2). The smaller of these parallels the north side of Mulberry creek and coincides with the divide between that creek and Arkansas River. The other belt parallels the south side of Mulberry creek and coincides with the divide between Mulberry and Crooked creeks. The wells in this area derive their water supplies from the Ogallala formation.
Fluctuations in Water Level
General considerations--The water table in Ford County is not a stationary surface, but a surface that fluctuates up and down much like the water level in a lake or reservoir. A condition of approximate equilibrium exists between the amount of water that is added annually to groundwater storage and the amount that is discharged annually by both artificial and natural means. In general, the water table rises when the amount of recharge exceeds the amount of discharge and declines when the discharge is greater than the recharge. Thus, changes in the water levels in wells indicate to what extent the groundwater reservoir is being depleted or replenished.
The principal factors controlling the rise of the water table in Ford County are the amount of rainfall penetration, the amount of water added to the underground reservoir by seepage from Arkansas River during periods of flood flow, and the amount of water entering the county beneath the surface from areas to the west. The principal factors controlling the decline of the water table are the amount of water lost by underflow to Arkansas River and to several smaller streams, including Duck and Sawlog creeks, the amount of water pumped from wells, the amount of water lost through transpiration and evaporation in stream valleys, and the amount of water leaving the county beneath the surface toward the cast. In the Arkansas valley the water table fluctuates in response to the heavy draft made upon the groundwater reservoir by pumping from irrigation wells and to changes in the amount of water flowing in Arkansas River.
In the fall of 1938, 37 wells were selected at strategic points in Ford County, and periodic measurements of water level in them were begun in order to obtain information concerning the fluctuations in storage of the underground reservoir. The descriptions of wells and the 1938 water-level measurements are given in the 1938 annual water-level report of the Federal Geological Survey (Meinzer and Wenzel, 1939, pp. 93-100) and subsequent water-level measurements have been published in ensuing water-level reports (Meinzer and Wenzel, 1940, pp. 146-157). Table 3 correlates the observation-well numbers used in this report with those given in Water-Supply Papers 845 and 886. The location and description of each well appears in the table of well records at the end of this report.
Table 3--Observation well numbers used in this report and corresponding numbers given in Water-Supply Papers 845 and 886
| Well No. this report | Well No. in Water-Supply Papers 845 and 886 | Well No. this report | Well No. in Water-Supply Papers 845 and 886 | |
|---|---|---|---|---|
| 11 | 41 | 319 | 59 | |
| 14 | 47 | 320 | 60 | |
| 34 | 237 | 322 | 57 | |
| 50 | 10 | 339 | 101 | |
| 84 | 32 | 358 | 48 | |
| 98 | 96 | 361 | 86 | |
| 101 | 11 | 364 | 25 | |
| 123 | 35 | 393 | 43 | |
| 128 | 38 | 398 | 68 | |
| 129 | 36 | 399 | 68A | |
| 171 | 72 | 401 | 5 | |
| 176 | 76 | 403 | 4 | |
| 179 | 24 | 406 | 100 | |
| 184 | 79B | 411 | 26 | |
| 184A | 79C | 417 | 2 | |
| 228 | 52 | 421 | 89 | |
| 243 | 53 | 423 | 13 | |
| 248 | 65 | 485 | 17 | |
| 256 | 8 | 507 | 6 | |
| 311 | 343 | 510 | 15 | |
| 313 | 359 | 522 | 7 | |
| 316 | 9 |
Fluctuations caused by precipitation--Fluctuations in groundwater levels in Ford County are related primarily to the amount of recharge received from precipitation. Under favorable conditions part of the precipitation seeps down through the soil zone and is added to the zone of saturation. The amount and frequency of this recharge depend in part upon the depth of the water table below the surface. In the upland areas where the water table lies at considerable depth below the land surface there is less fluctuation in response to precipitation than in areas like the Arkansas valley in which the water table lies close to the surface. There is generally a lag between the time of precipitation and the time the water levels in wells begin to rise, and, other things being equal, the deeper the water level the greater the lag. The amount of precipitation necessary to produce recharge depends also upon the season of the year, and the character of the material in the soil zone and in the zones of aeration and saturation. After a prolonged period of drought, the soil moisture becomes depleted, so that when rain occurs, this deficiency must be satisfied before any of the water can percolate downward to join the water table. Temperature is also an important factor, for during hot summer months part of the water that falls is evaporated directly into the air from the soil zone, and during the winter months any moisture that falls on frozen ground is greatly hindered from reaching the water table. The water table generally declines somewhat during the summer owing to the withdrawal of water by plant transpiration and evaporation even though the rainfall may be greater than in the winter.
The fluctuations of the water level in six observation wells in Ford County and the monthly precipitation at Dodge City are shown in figure 8. Of the six wells, four are in the Arkansas valley, one is on the upland north of Arkansas River, and one is on the upland south of the river.
Figure 8--Hydrographs showing the fluctuations of the water levels in six wells in Ford County and the precipitation at Dodge City. Precipitation data from U.S. Weather Bureau.
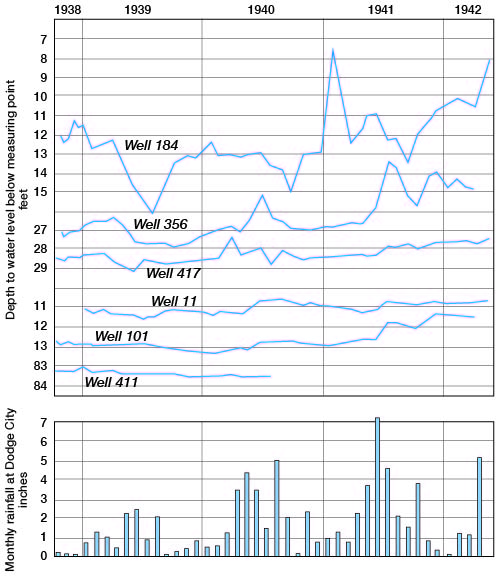
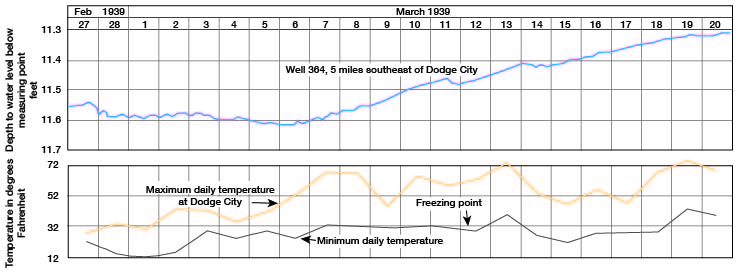
The water table in the Arkansas valley in Ford County usually reaches its highest stage of the year in the spring, often during March, and its lowest stage in the fall, generally about the first of October. The water table declines from about April 1 until October 1 partly as a result of the heavy draft created by the vegetative cover during the growing season and partly as a result of the withdrawal of large quantities of water from many irrigation wells in the valley. From October to April 1 there is usually a gradual rise of the water table. The water-level records of some of the wells in the valley indicate that there are some deviations from this routine behavior of the water table. During winter months there may be alternate periods of freezing and thawing with the result that recharge may occur intermittently. The effect upon the fluctuations of the water level in well 364 of a period of thaw following a period of freezing temperatures, as measured by an automatic water-stage recorder, is shown by the graph in figure 9. Rising temperatures with resultant thawing conditions were responsible for an abrupt rise in water level during the period from March 7 to 20.
Figure 9--Minimum daily water levels in well 364 compared with daily temperature at Dodge City.
During the growing season in 1939 the relation between the precipitation and the water levels in wells in the valley was obscured by heavy pumping from irrigation wells and by transpiration losses. Consequently the wells in the valley were declining even though more than four inches of rainfall was recorded during May and June. The greatest rises in water level in several of the wells in the valley during the period of record occurred in 1940 during the latter part of April and continued through May and June, following rainfall amounting to 3.54 inches in April, 4.41 inches in May, and 3.53 inches in June.
The effect of precipitation on the water level in well 11 on the upland north of the Arkansas valley is shown by the hydrograph of well 11, figure 8. The depth to water level in this well is about 46 feet. In general, the water level in this well declined from October, 1938, until about July, 1940. Apparently the rather scant precipitation that fell during this period was insufficient to produce recharge to the zone of saturation. As a result of heavy rain during May, June, and August, 1939, the water level in well 11 rose during August and September. Heavy rainfall in April, May and June 1940, caused rather abrupt rises in water level in May and June. Well 411 is situated on the upland south of the Arkansas River in an area where the water table is at considerable depth. According to the hydrograph shown in figure 8, the water level in this well appears to be unaffected by precipitation, but a much longer period of record would be necessary before any comparison could he made between the water levels in deep wells and the precipitation.
The minimum daily water levels in three observation wells equipped with automatic water-stage recorders in Ford County, and the precipitation at Dodge City for the period from October, 1938, to September, 1939, are shown in figure 11. Well 364 (pl. 1) is a shallow well in the alluvium of the Arkansas valley; well 50, in the valley of Sawlog creek, was originally drilled into the Dakota formation to a depth of 240 feet, but when measured in October, 1938, the total depth was only 90.5 feet, the casing apparently being collapsed below that point; and well 319, in the Arkansas valley near Howell, was drilled to a depth of 186 feet and taps basal sands and gravels of the Ogallala formation, the upper shallow water being cased out. All three wells formerly were used for irrigation.
The period of record is entirely too short to make any definite correlation between water-level fluctuations and the precipitation, particularly for the two deep wells (wells 50 and 319) where there is undoubtedly a considerable lag between the time that precipitation occurs and the time that recharge takes place. The hydrograph of well 364 shows a slight rise in March as a result of recharge following a period of thawing temperatures. The high water levels that occurred in May, July, and August were caused by seepage from surface-water irrigation ditches in the vicinity of the well rather than by precipitation, as might first be implied. A more detailed graph of this phenomenon is shown in figure 10. Two irrigation ditches leading from a rivet pumping plant pass within 10 feet of well 364, with the result that the water level in the well is affected during the times when the ditches are carrying surface water.
Figure 10--Water-level fluctuations in well 364 caused by water flowing in near-by irrigation ditch, beginning May 23.
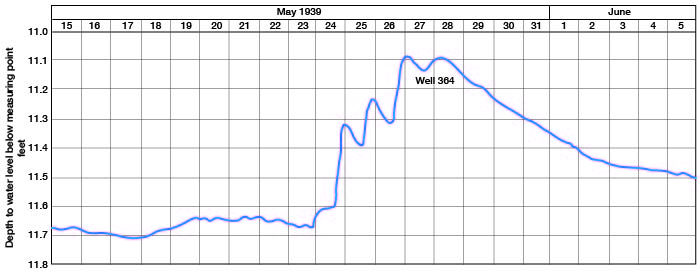
Figure 11--Graphs showing the minimum daily water levels in 3 observation wells equipped with automatic water-stage recorders in Ford County, Kansas, and the precipitation at Dodge City. Precipitation data from U.S. Weather Bureau.
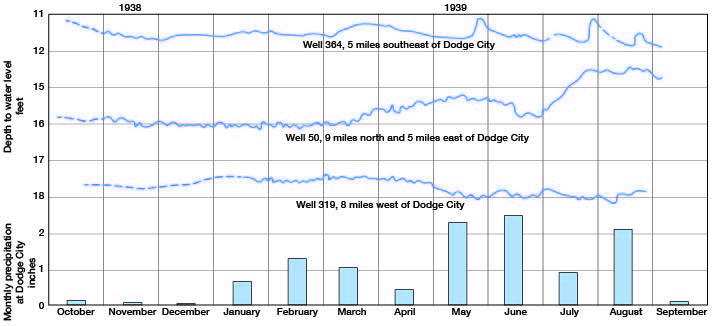
The hydrographs for wells 50 and 319 are widely divergent and do not appear to be affected by precipitation. The water level in well 50 started rising about the middle of March and, aside from a rather prominent decline during June, it continued rising until August, after which it remained nearly stationary during the month. The reasons for this rather unusual rise are not definitely known. Since the well is known to tap the Dakota formation, it appears unlikely that fluctuations in water level would be controlled by precipitation falling locally, but rather that the water level would fluctuate in response to changes in the amount of water in storage in the Dakota formation. There appears to be no correlation between the hydrograph of well 319 and precipitation; however, a longer period of record might show conditions of delayed recharge.
Fluctuations caused by transpiration--Groundwater may be taken into the roots of plants directly from the zone of saturation or from the capillary fringe, which in turn is supplied from the zone of saturation, and is discharged from the plants by the process of transpiration (Meinzer, 1923, p. 48). The water table fluctuates in response to plant transpiration, generally, only in areas where the water table lies but a few feet below the land surface. In Ford County, therefore, the only areas in which the water table is directly affected by transpiration are the floodplains of Arkansas River and several smaller streams where the roots of plants draw water directly from the capillary fringe or from the zone of saturation.
Fluctuations caused by changes in atmospheric pressure--The water levels in wells that penetrate water-bearing formations having a relatively impervious confining bed above the zone of saturation may fluctuate in response to changes in atmospheric pressure. The pressure on the water surface in a well increases with an increase of atmospheric pressure. If this increase in pressure is not transmitted uniformly to the entire groundwater body but acts only on the exposed water surface in the well, the water level in the well fluctuates according to the changes in pressure. If the pressure is transmitted freely through the pore spaces of the soil above the zone of saturation to the ground water, however, there is no barometric fluctuation of the water level.
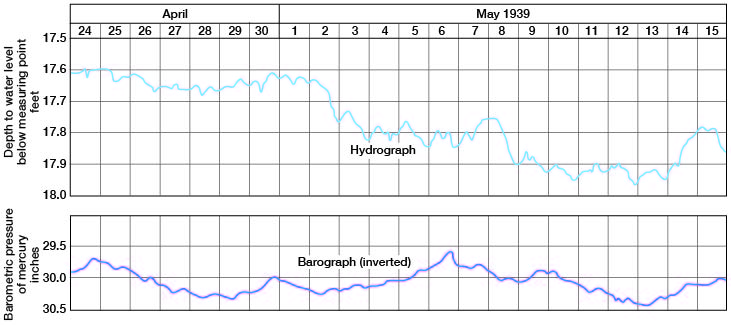
Hydrographs of wells 50 and 319, obtained from automatic water stage recorders and inverted barographs obtained from a recording micro-barograph located in the same shelter, are shown in figures 12 and 13. The barographs are inverted because an increase in atmospheric pressure causes the water levels in wells to decline.
Figure 12--Changes of water level in well 50 caused by changes in atmospheric pressure.
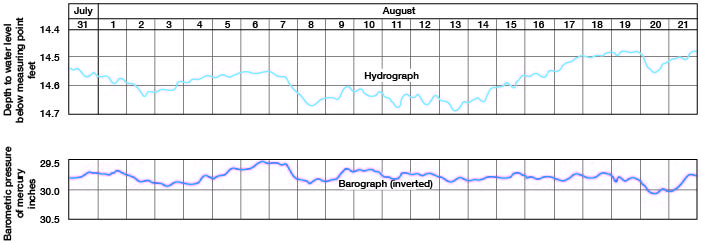
Figure 13--Changes of water level in well 319 caused by changes in atmospheric pressure.
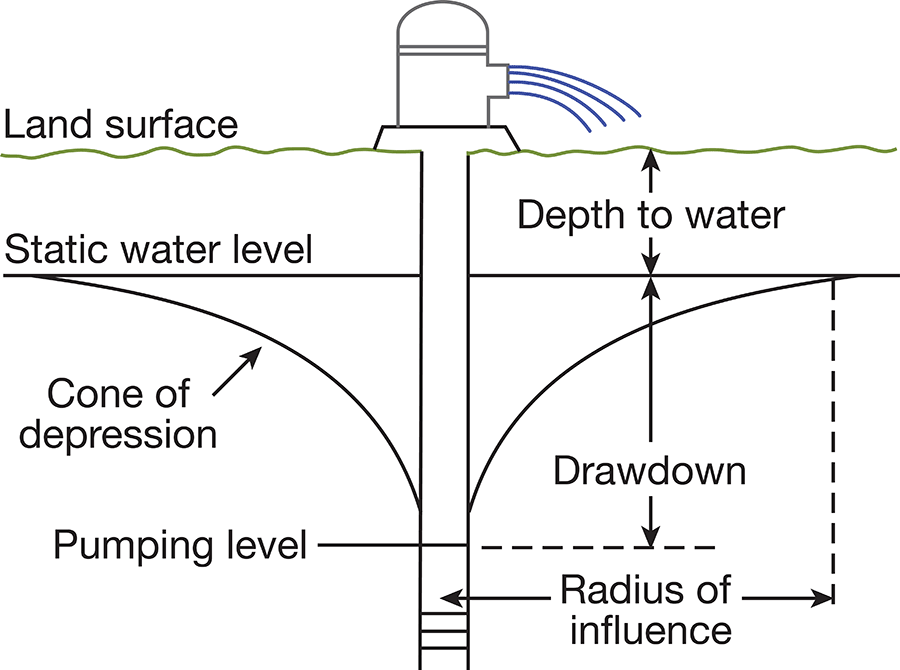
Fluctuations caused by pumping--When a well is pumped, the water table in its vicinity declines and takes a form similar to inverted cone, the apex of which is at the well (fig. 14). The cone of depression thus established represents a loss of storage by the unwatering of a portion of the previously saturated material surrounding the well. When pumping stops, the movement of water from surrounding areas continues until the cone of depression fills up, with resultant slight decline of the regional water table in the vicinity of the well. Most wells are pumped intermittently; hence, a discharging well may be creating a cone of depression in one part of the are while another cone is being refilled following a period of pumping elsewhere. In an area such as the Arkansas valley in Ford County where a great many wells are being pumped, the fluctuations of water level in any one well are complicated and may represent the sum of the effects of pumping or recovery from many nearby wells. At the end of the pumping season there is a gradual readjustment of the regional water table until it approaches the level that existed before pumping began, but there may be a net decline in water level.
Figure 14--Diagrammatic section of a pumping well showing drawdown, cone of depression, and radius of influence.
The pumping season in Ford County may start early in the spring and continue until late in the fall. In a few instances winter wheat has been irrigated from wells during December. The length of the season varies from year to year, depending upon the amount and distribution of precipitation and upon the initiative of the well owners.
The hydrographs of several of the wells in the Arkansas valley (fig. 8) show that declines in water level occurred as a result of a general regional lowering of the water table during the pumping season. Well 184 is a deep well in the Arkansas valley that penetrates the Ogallala formation. It is part of a battery of three shallow and two deep wells interconnected to one pump and used for irrigation. The hydrograph of well 184 shows that pronounced declines in water level have occurred during the summer months in 1939 and during July, August and September, 1940, partly as a result of increased withdrawals of water from several nearby irrigation, industrial, and public-supply wells.
Prev Page--Ground Water || Next Page--Recharge
Kansas Geological Survey, Ford County Geohydrology
Web version April 2002. Original publication date Dec. 1942.
Comments to webadmin@kgs.ku.edu
The URL for this page is http://www.kgs.ku.edu/General/Geology/Ford/05_gw2.html