Kansas Geological Survey, Public Information Circular (PIC) 22
Prev. Page--Factors Influencing Recharge || Next Page--Water Management
![]()
![]()
![]()
![]()
Kansas Geological Survey, Public Information Circular (PIC) 22
Prev. Page--Factors Influencing Recharge ||
Next Page--Water Management
Knowledge of recharge and its relationship with land use is essential for integrated water-resources management. Because many factors influence recharge, and because these factors vary greatly from place to place across the state, recharge is difficult to determine in any one location and difficult to estimate for large areas. Nonetheless, an estimate of recharge is needed to assess the impact of withdrawing ground water from an aquifer and to reliably estimate the long-term behavior of an aquifer under various management schemes. Reliable estimates of recharge and recharge mechanisms are also needed to assess the risk of ground-water contamination, and to evaluate artificial recharge potential. If water and contaminants (such as nitrates and pesticides) move rapidly through fractures and other preferential pathways, for example, the contaminant is likely to reach the water table at relatively high concentrations soon after application at the soil surface. However, if contaminants move through the soil, then the much slower travel time allows for contaminants to disperse, dilute, and break down, thus influencing the final concentration that reaches the ground water.
Many recharge estimates are based on mathematical models. Because these models rely on generalizations about the factors that influence recharge, the results of these models are sensitive to the amount of recharge and how it varies from place to place and over time. One study by the U.S. Geological Survey (Hansen, 1991) was based on water-budget modeling and has been used by the Division of Water Resources (DWR) of the Kansas Department of Agriculture in making decisions on requests for new water rights. The study estimated recharge rates as high as 8 inches per year in southeastern Kansas, about 3 inches per year in central Kansas, and less than an inch per year over about the western third of the state (fig. 4).
Figure 4-Mean annual potential natural recharge (in inches per year) is shown by one-inch contours (except in western Kansas where a half-inch interval was used to show more detail). The extent of High Plains aquifer in Kansas is outlined in blue (adapted from Hansen, 1991).
The U.S. and Kansas geological surveys have developed models for smaller areas of the state. Some of those models estimate that recharge is greater under irrigated cropland than under non-irrigated cropland. That's primarily because the wetter soil profile allows precipitation to move through the soil more quickly and thus recharge the aquifer. Researchers studied recharge in Finney County, in southwestern Kansas, and compared recharge during the years before large-scale irrigation (generally termed pre-development) with recharge after the onset of irrigation in the 1950's and 1960's (Meyer et al., 1970). That study indicated that predevelopment recharge was very low: less than half an inch per year. Recharge after development was estimated at approximately 2.7 inches per year, although factors other than increased irrigation (such as changing from grassland to cropland and significantly above-average precipitation over the 1940-1951 period) also were responsible.
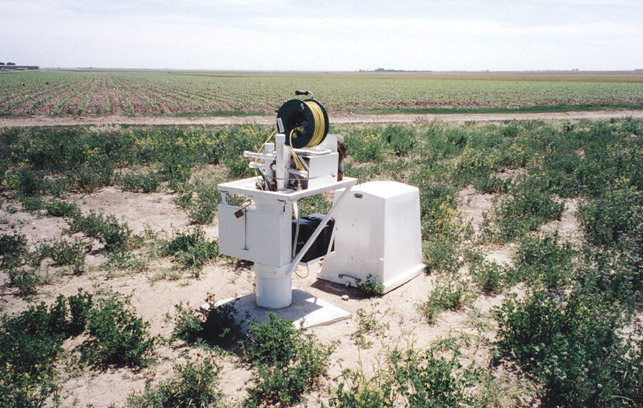
Studies that estimate recharge in the field are few. It is expensive to drill wells and install instrumentation to measure the movement of water underground. Recently, the Kansas and U.S. geological surveys developed recharge-estimation sites in southern Finney County and in the Cimarron National Grassland in Morton County (fig. 5). Those studies indicated that recharge was close to 0.1 inch per year, and was considerably less in grassland areas than under irrigated land (Sophocleous et al., 2002). In general, annual recharge was estimated at less than one percent of annual precipitation. Irrigation development is now so widespread that irrigation seems to contribute more than precipitation to recharge in that region, although this recharge is at the expense of ground water that was previously stored in the aquifer. Clearly, more irrigation to increase recharge is not the solution to declining water levels.
In an earlier, multi-year (1985-1992) study by the Kansas Geological Survey, in cooperation with the Big Bend Groundwater Management District in the Great Bend Prairie region of the High Plains aquifer, recharge was estimated to be about 10 percent of the annual precipitation, though in some years no recharge occurred at some locations (Sophocleous, 1992). Thus, it is clear that the time period and the size of the study area significantly affect estimations of recharge.
Figure 5--Recharge-monitoring site, southwest Kansas (Sophocleous et al., 2002).
Based on recharge studies in the state, the consensus is that estimated average annual recharge to the area underlain by the Ogallala portion of the High Plains aquifer is on the order of less than 0.3 inch per year (Sophocleous, 2003). Much work remains to be done in studying recharge rates in Kansas. Interest is growing in the role of localized features on recharge, such as playas (broad, shallow depressions in western Kansas that fill with water during wet times and dry up during dry times). Although quantification of natural recharge is a difficult task, for most practical purposes it is sufficient to make approximate estimates and then refine these estimates through monitoring and analysis of aquifer responses to pumping.
Prev. Page--Factors Influencing Recharge || Next Page--Water Management
Kansas Geological Survey, Public Outreach
Web version August 15, 2003
http://www.kgs.ku.edu/Publications/pic22/pic22_3.html