Kansas Geological Survey, Open-file Report 2017-31
KGS Open File Report 2017-31
for Western Interior Coal Geologists Forum,
Claremore, Oklahoma, June 5-6, 2017
Unconventional energy production in Kansas includes coal, coalbed methane (CBM), and long-reach horizontal drilling principally applied to the Mississippian Lime Play (MLP). Kansas coal has recorded production every year since 1869, but 2017 may be the first year when no coal is mined in Kansas. Coal production is principally limited to eastern Kansas and production has erratically declined since WWII. CBM production is principally limited to southeastern Kansas, peaked in 2008, and has steadily declined ever since. MLP production in Kansas peaked in 2014. Drastic declines in oil and gas prices (respectively declining since 2008 and 2014) have affected exploration and production of CBM and MLP oil and gas. In 2016, the financial consequences of these low commodity prices took its toll, as the No. 1 CBM producer, the No. 1 oil producer, and the No. 1 natural gas producer in Kansas all declared bankruptcy.
To view this report, you will need the Acrobat PDF Reader, available free from Adobe.
Coalbed methane (CBM) constituted 9.1% of Kansas annual gas production in 2015 and 2016 (down from 9.7% of total Kansas gas production in 2014 and 10.5% of total Kansas gas production in 2013). 2016 CBM production for Kansas was 22.28 billion cubic feet (BCF). 2015 production was 25.88 BCF (fig. 1). Estimated CBM production for 2017, based on the first two months of the year, will be 21.0 BCF. This represents a 5.7% decrease from production in 2016.
Annual CBM production peaked in Kansas in 2008 at 49.14 BCF (fig. 1). CBM annual production declined 2.1% from 2008 to 2009, 10.5% from 2009 to 2010, 5.8% from 2010 to 2011, 11.9% from 2011 to 2012, 13.3% from 2012 to 2013, 10.2% from 2013 to 2014, 6.9% from 2014 to 2015, and 10.1% from 2015 to 2016. The number of wells reporting production during 2016 decreased by 444 from 2015 (fig. 1). The volume of production per well has steadily decreased, on average, since 2008 (fig. 1). CBM production in Kansas is principally concentrated in four counties in the southeastern part of the state (fig. 2).
Cumulatively, approximately 481 BCF of natural gas has been produced in eastern Kansas since 2001, which is the year southeastern Kansas gas production started rising dramatically (see fig. 1). The overwhelming majority of southeastern Kansas gas being produced is due to CBM. CBM production data for Kansas and associated links can be found on the Kansas Geological Survey (KGS) website: http://www.kgs.ku.edu/PRS/petroDB.html.
Figure 1—Eastern Kansas gas production (red; overwhelmingly due to CBM), annual increase or decrease in the number of producing CBM wells reported (blue), and total annual production divided by the total number of CBM wells (green). Projected 2017 production is extrapolated from production data through February 2017.
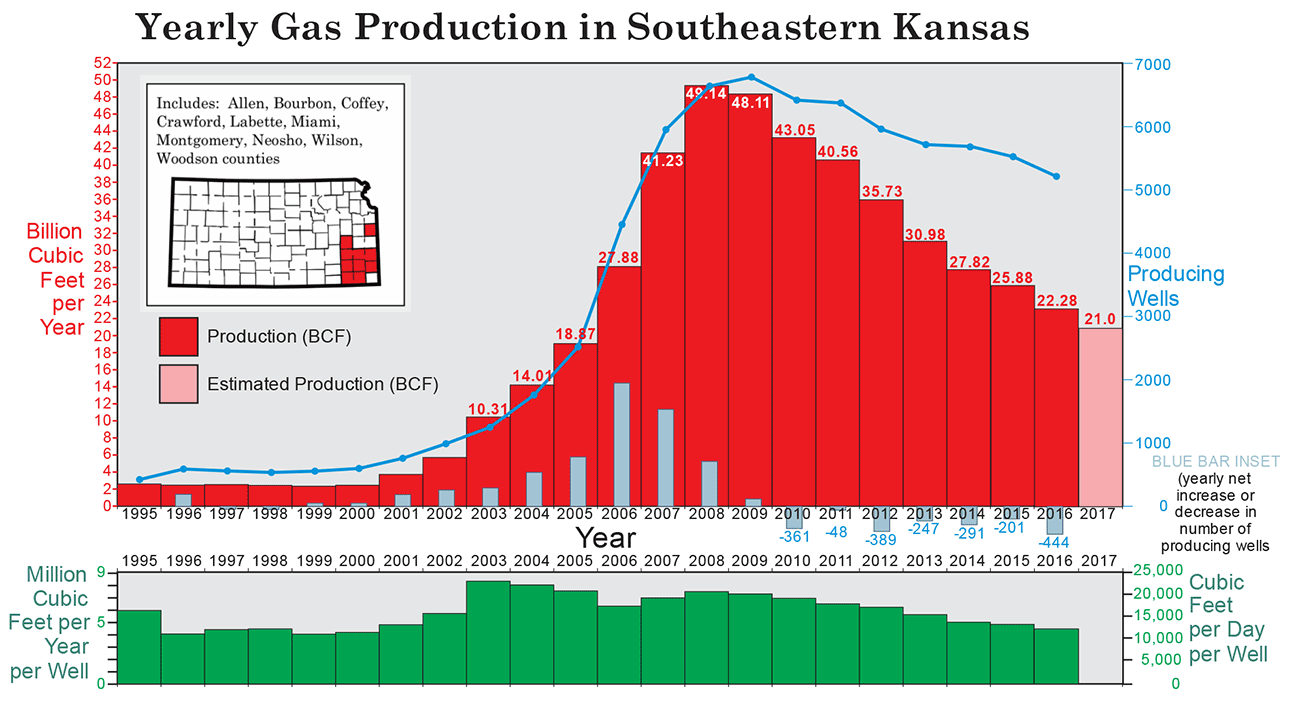
Figure 2—Locations of sections (nominally 1 square mile) in eastern Kansas with record of CBM production (red) and sections with at least one well drilled for CBM but no production recorded (gray). Major gas pipelines are in orange (after Newell and Yoakum, 2010).
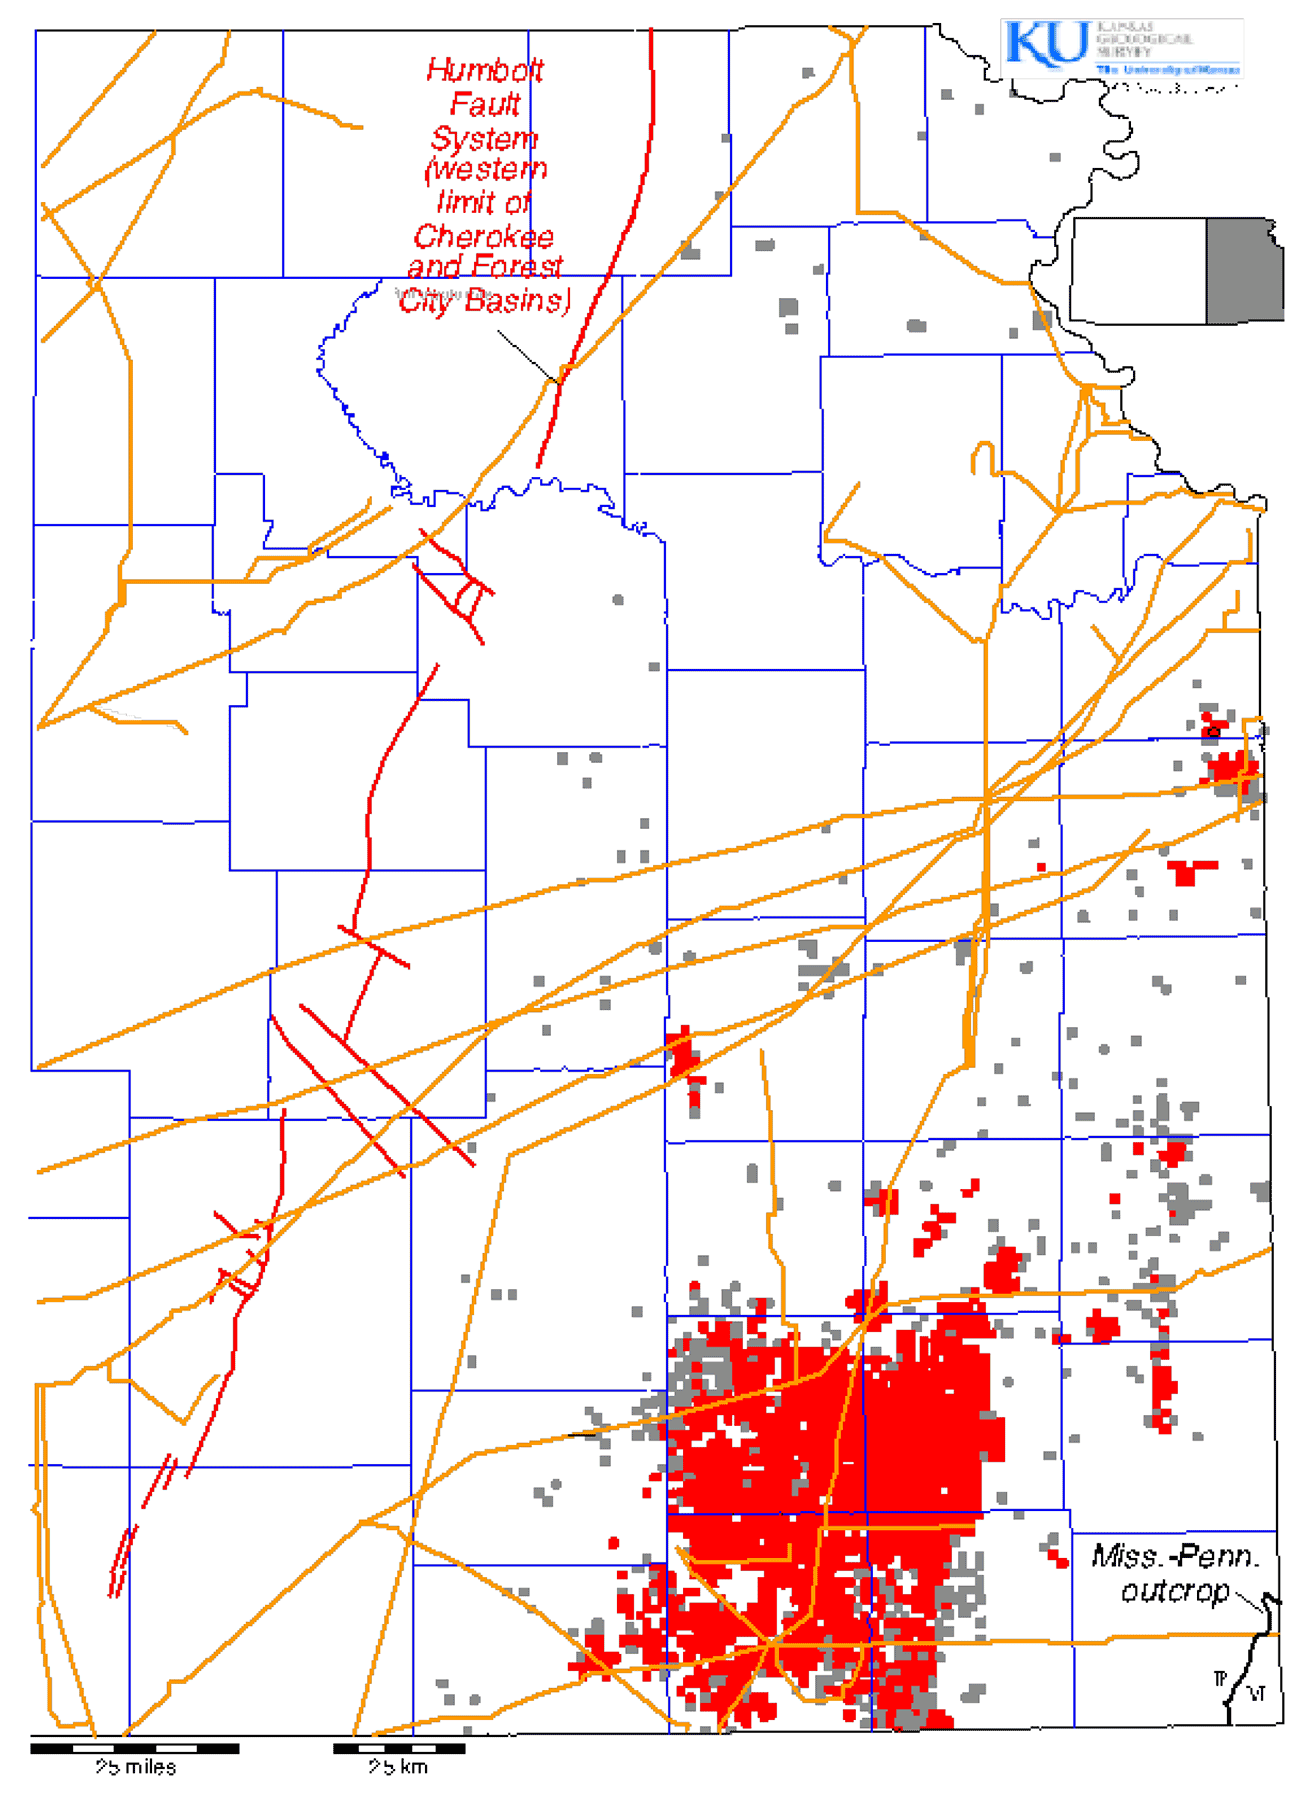
Most CBM in southeastern Kansas is from Middle and Upper Pennsylvanian high-volatile B and A rank bituminous coals. Almost all wells are vertical and have multiple completions.
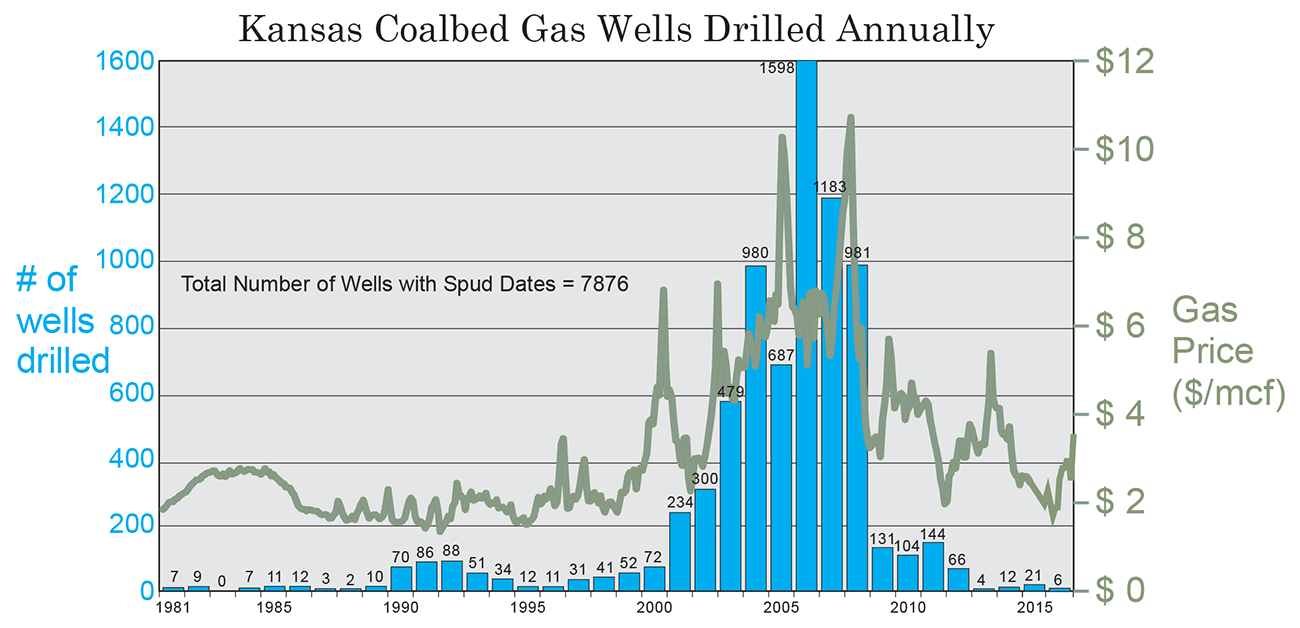
As of February 2017, 7,876 wells have been reported spudded for CBM in eastern Kansas (fig. 3). Drilling peaked in 2006 and has languished since 2008. The drastic price decline for natural gas since the last half of 2008 continues to affect CBM and drilling at large for natural gas in Kansas.
Figure 3—CBM wells (dry and producing) drilled in Kansas.
In 2015, 21 wells for CBM were drilled in Kansas. PostRock Midcontinent Production LLC accounted for all of these wells.
On April 1, 2016, PostRock Energy filed for bankruptcy. It had $50-100 million in debt. (https://globenewswire.com/news-release/2016/04/01/825199/0/en/PostRock-Announces-Bankruptcy-Filing.html). PostRock assets were purchased by Cardinal River Energy (Oklahoma City) and then put under management of an affiliated company named River Rock Operating.
Only five CBM wells were drilled in 2016, three of which were drilled by PostRock Midcontinent Production and two by River Rock Operating.
Production by operator in 2016 has yet to be compiled, but PostRock Midcontinent Production LLC recorded the greatest CBM production for any operator in Kansas in 2015 at 13.5 BCF (compared to 15.6 BCF in 2013 and 14.2 BCF in 2015). Dart Cherokee Basin Operating Co. (4.1 BCF in 2015; 4.6 BCF in 2014; 5.3 BCF in 2013) and Layne Energy Operating (2.6 BCF in 2015; 2.9 BCF in 2014; 3.4 BCF in 2013) follow. In light of this decrease in gas production, and considering the better price commanded by oil in recent years, several operators changed their business model and reviewed data from their CBM wells with effort directed toward finding previously overlooked or ignored oil accumulations.
The KGS continues to be open to partnership with industry to pursue additional CBM-related research. Ongoing research has focused on the gas content of coals and shales, the isotope chemistry and composition of produced gases, and production characteristics. The KGS has received grants from industry participants several times to core scientific test holes and recover coals and shales for desorption studies, using the Survey wireline drilling rig and desorption laboratory. Other research partnerships are always welcomed.
Recent doctoral research on Kansas and Oklahoma CBM was completed by Steven A. Tedesco (Tedesco, 2013). Production declines in Kansas CBM wells are discussed in Shrout and Newell (2015).
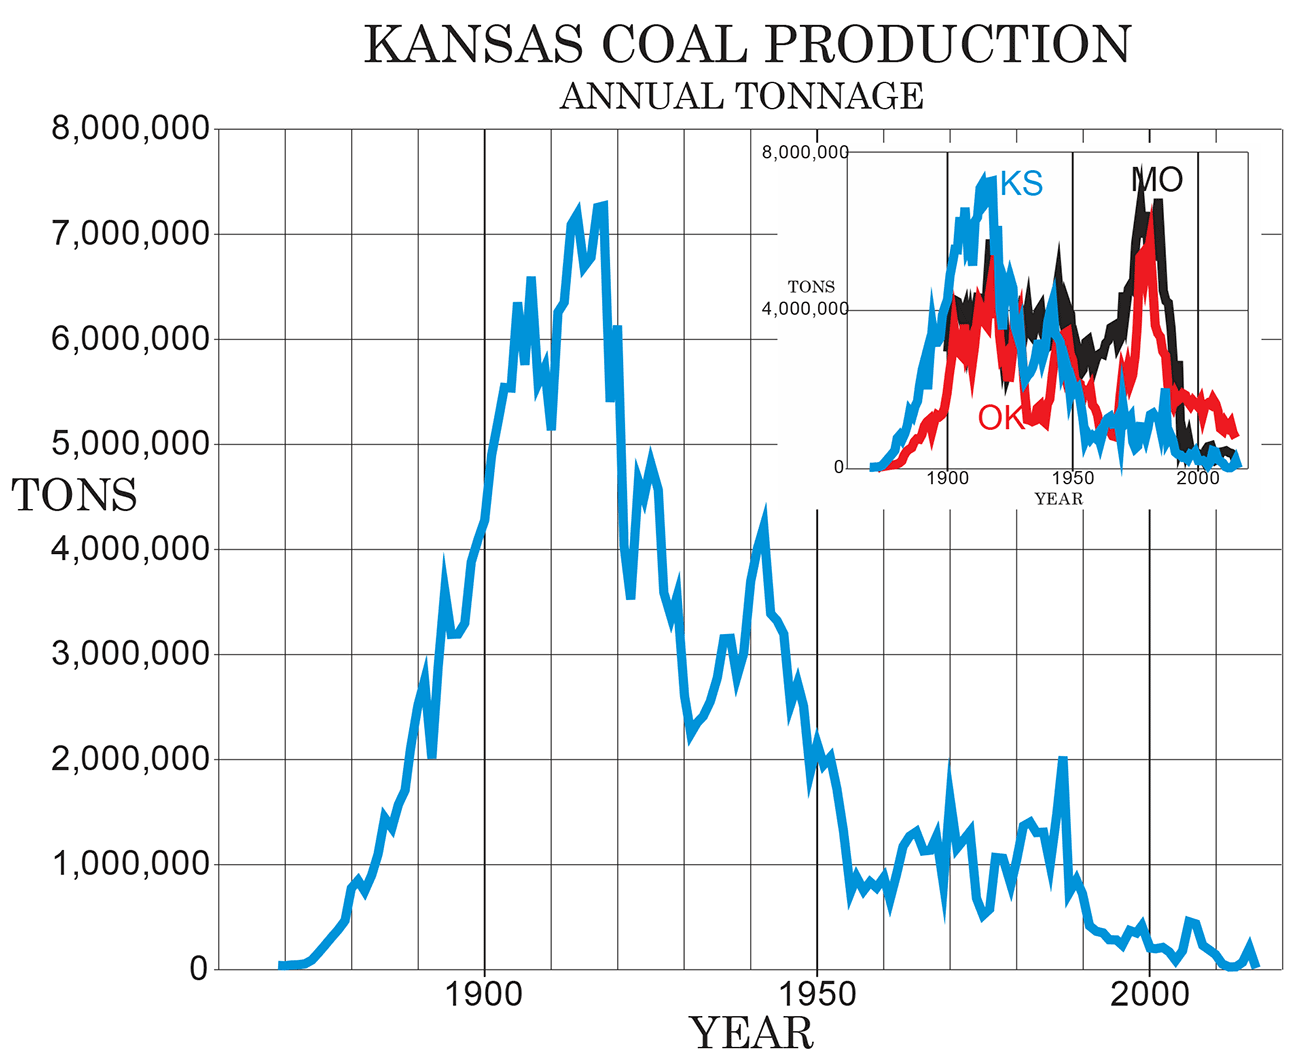
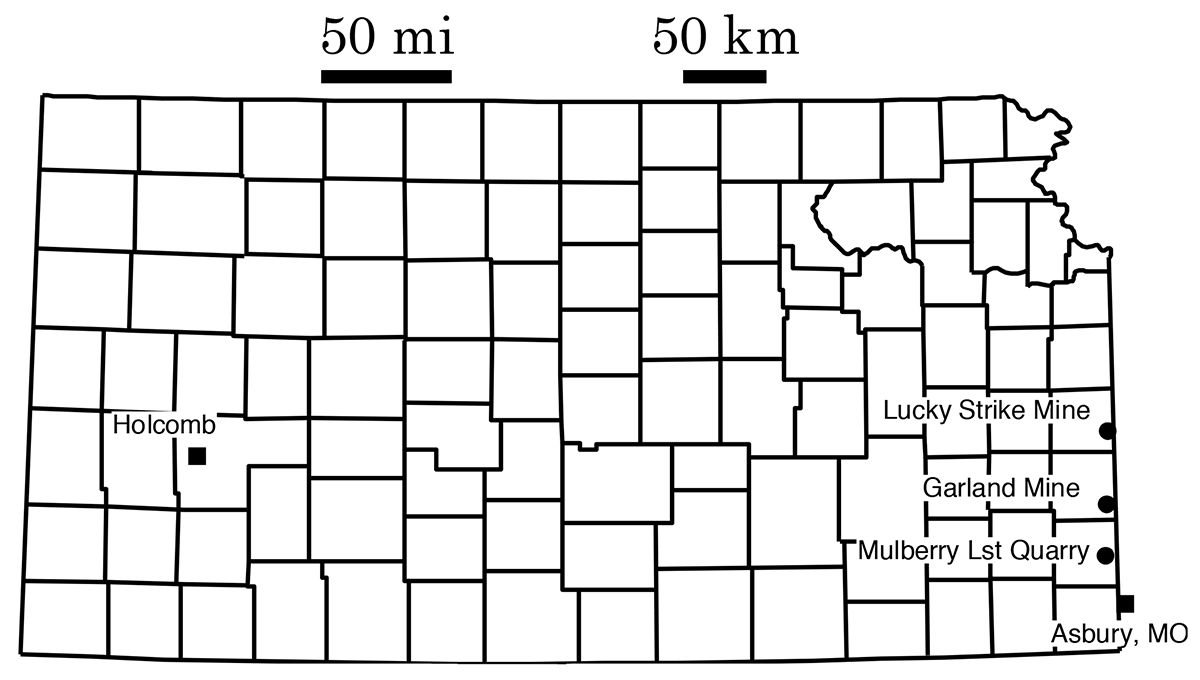
Based on information from the Surface Mining Section of the Kansas Department of Health and Environment, Kansas coal production totaled 24,994 short tons in 2013, 69,671 short tons in 2014, 199,199 short tons in 2015, and 26,567 short tons in 2016 (fig. 4). All of this production 2015 and 2016 came from the Continental Coal Company Lucky Strike Mine in eastern Linn County, where the company resumed mining of Kansas coal after a number of years mining immediately across the state line in Missouri. This operation moved back to Missouri in 2016, so future production in Kansas is unlikely at this time. The Phoenix Coal Company finished mining Kansas coal at its Garland Mine in mid-2014 with a 2014 production total of 16,793 tons in southeastern Bourbon County. The Mulberry Limestone Company produced 3,305 tons of coal from a multi-product mine in northeastern Crawford County in 2014, but no production was registered for 2015. The last year Kansas produced at least one million tons of coal was 1987, and the last year the state produced at least 100 thousand tons of coal was 2010 (fig. 4). Collectively since production records started in 1869, Kansas has produced 320,504,819 short tons of coal.
Figure 4—Annual coal production in Kansas and inset showing simultaneous production from adjacent states. First Kansas production was in 1869.
Kansas coal in recent years was used mainly as a blending fuel with western coal from Wyoming for local power generation in eastern Kansas and western Missouri. During 2012, Empire Electric Company's Asbury power plant (Asbury, Missouri) blended 7.3% local coals with 86.8% Powder River Basin coal.
A proposed power plant has been the center of legal disputes for more than a decade. The $2.8 billion project involves construction of an 895-megawatt coal-fired plant to be operated by Hays, Kansas-based Sunflower Electric Power Corp. in southwestern Kansas, next to an existing coal-fired plant near the town of Holcomb (fig. 5). The plant will have the capacity to power approximately 500,000 homes, and Tri-State Transmission and Generation Association Inc. of Westminster, Colorado (an electricity wholesaler) would get 75% of the power for customers in Colorado.
Figure 5—Coal mines in Kansas, Asbury power plant in Missouri, and location for the proposed Sunflower power plant in Holcomb, Kansas.
In August 2012, the Kansas Supreme Court heard arguments regarding a brief filed by Earthjustice, which represented the Sierra Club of Kansas. The litigation regarded a 2010 permit issued by the Kansas Department of Health and Environment (KDHE) for the proposed power plant. The Sierra Club attempted to block construction of the power plant, alleging that the permit issued by the KDHE did not comply with the Clean Air Act. Conversely, the KDHE and Sunflower Electric maintained the permit met all state and federal requirements.
The court issued a decision in early October 2013 and overturned the project's permit, stating that the KDHE failed to apply Environmental Protection Agency regulations on pollution emissions that had become effective several months before the permit had been issued. The court thus sent the case back to the KDHE, telling the agency that the permit must comply with one-hour emission limits for nitrogen dioxide and sulfur dioxide.
In a separate lawsuit, in late January 2012, U.S. District Court Judge Emmett Sullivan in Washington, D.C., handed down a ruling that the Rural Utilities Service of the federal government, which financially supported the Sunflower project, failed to consider environmental impacts of the plant. The Rural Utilities Service was directed not to issue any approvals or consents related to the construction of the power plant until a new Environmental Impact Statement was completed.
Sunflower Electric maintained that the company would "continue to take the steps necessary to preserve and advance the project," and as a result of its efforts to amend the 2010 permit, the KDHE in May 2014 approved the permit only days before the federal government was expected to announce new rules for utilities designed to curb greenhouse gas emissions. The Sierra Club, through Earthjustice, followed in June 2014 with a lawsuit filed with the state Court of Appeals alleging that the KDHE did not adequately impose limits on various pollutants that would be produced by the plant, including mercury, nitrogen dioxide, and sulfur dioxide. In addition, the lawsuit alleged that carbon dioxide emissions by the plant would not meet federal air-quality standards that the state is required to enforce.
Arguments were presented to the Kansas Supreme Court on this issue in January 2016, and on March 17, 2017, the Kansas Supreme Court gave its approval to a permit to build the power plant. Sunflower Electric, however, has not yet said whether it intends to move forward with construction.
Although about 1,100 horizontal wells have been drilled in Kansas over several decades, 2010 marked the beginning of a new era in drilling where staged massive hydraulic fracturing was extensively used in long-reach horizontal wells. Most horizontal wells since 2010 have been drilled to access poorly drained reservoir compartments and low-permeable oil zones in Mississippian carbonates in southern Kansas, particularly in the tier of counties immediately north of the Oklahoma state line. This new engineering and geological play is dubbed the Mississippian Lime(stone) Play, or MLP. Other pay zones are targeted in addition to the MLP. Horizontal wells in Trego County, Kansas, have mostly targeted Pawnee Limestone and Marmaton pay zones instead of Mississippian strata.
Some companies, including Chesapeake Energy, Shell Oil Gulf of Mexico, EnCana Oil and Gas (USA), and Apache Oil, gained acreage positions in Kansas but after initial drilling stated that they would not pursue the play any more in the state. In February 2014, Tapstone Energy LLC (Oklahoma City, Oklahoma), a company founded by former SandRidge-Energy CEO Tom Ward, agreed to buy Shell's Kansas assets and leases (~600,000 acres). SandRidge Energy (Oklahoma City, Oklahoma), Unit Petroleum (Tulsa, Oklahoma), and Woolsey Petroleum (Wichita, Kansas) were particularly active in the play, as were several other independents from Oklahoma, Texas, Kansas, and Colorado, until 2015. Reductions in the price of oil in late 2014, however, have scaled back drilling of all wells in Kansas (and the entire United States), including horizontal wells targeting the Mississippian.
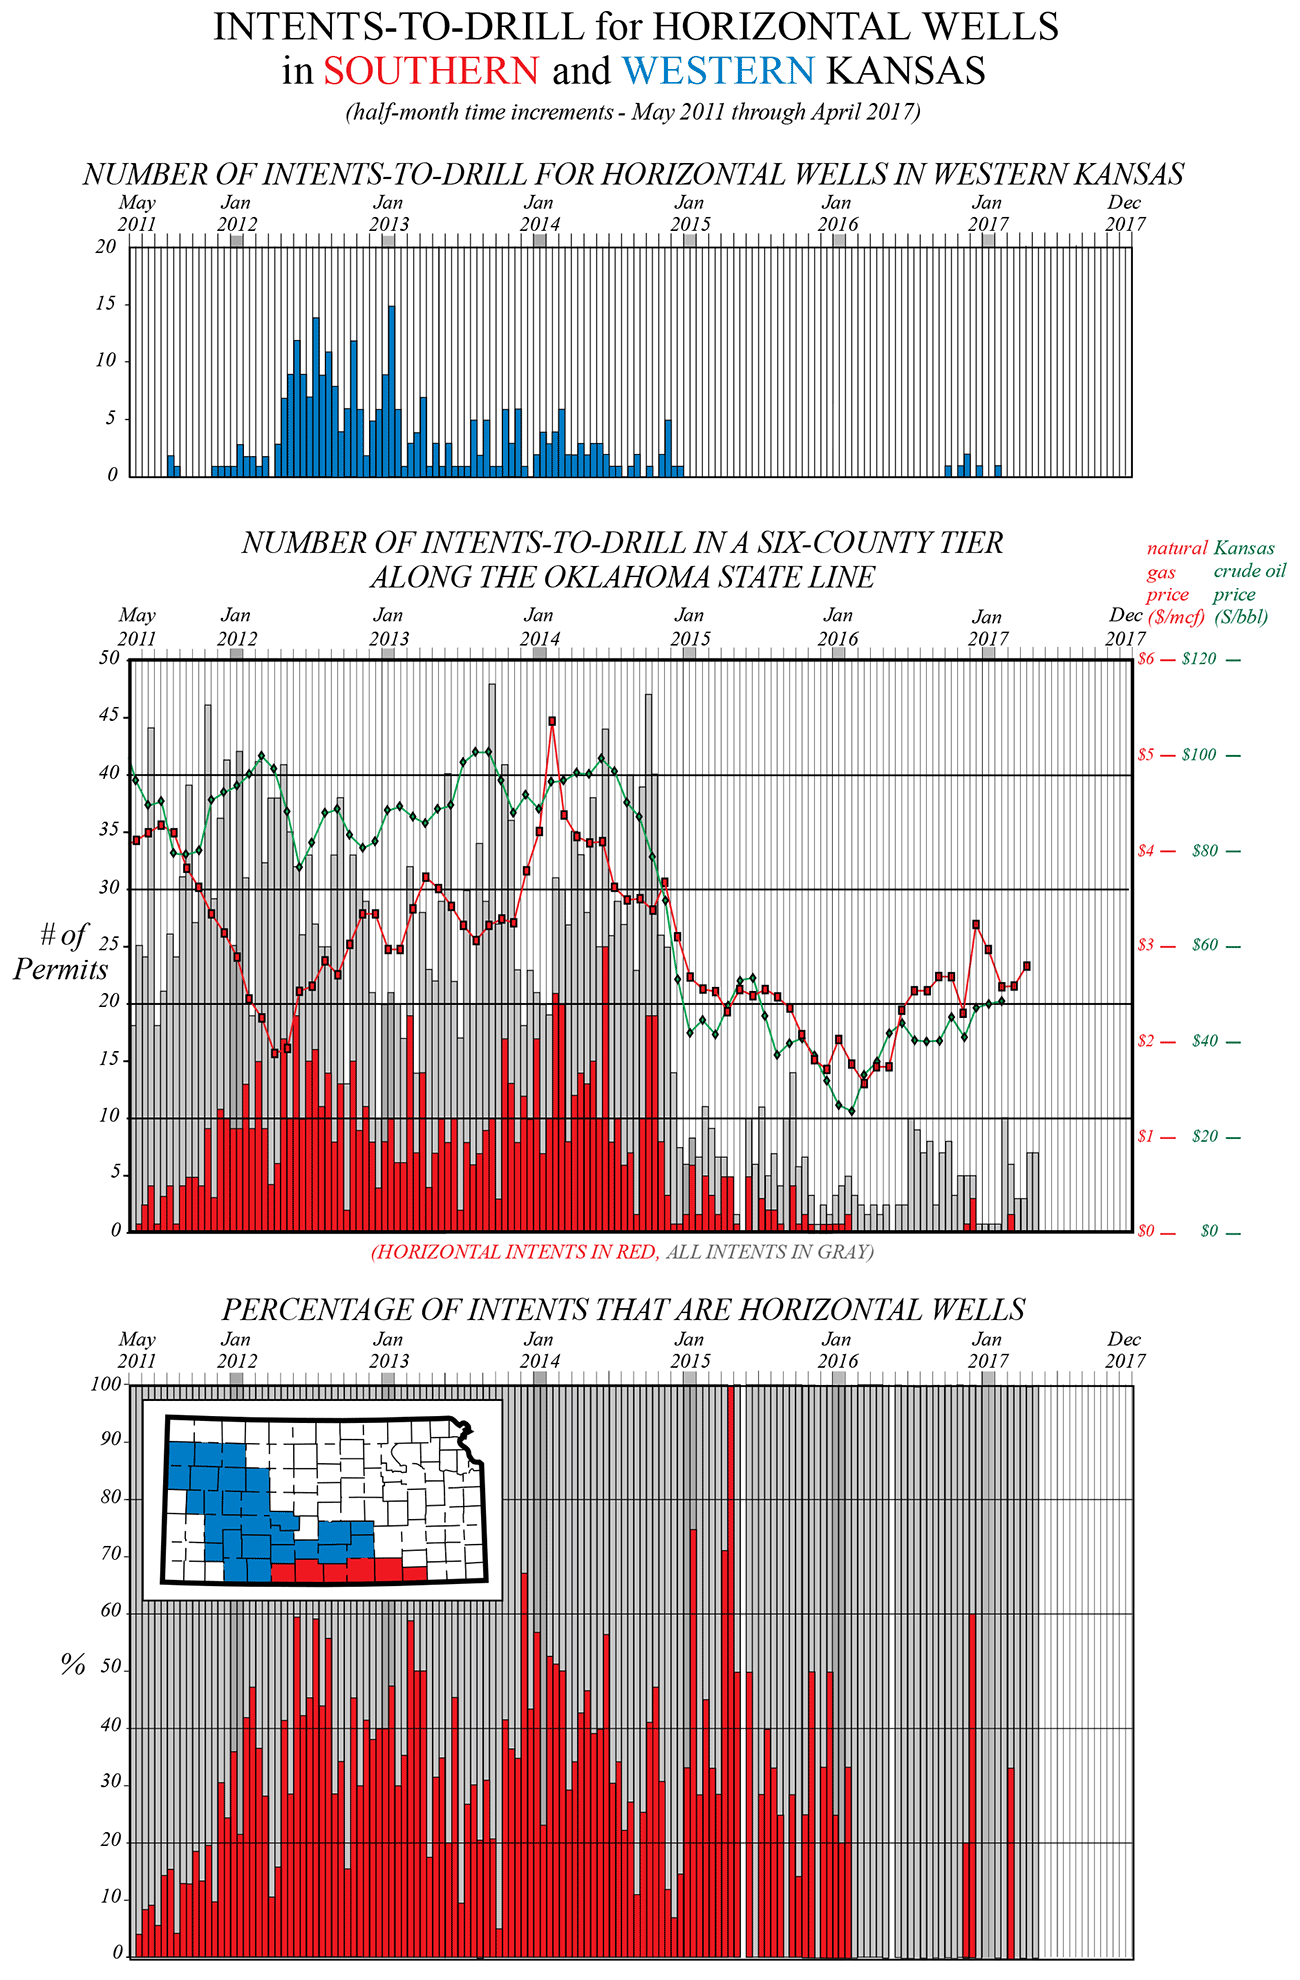
The number of intents-to-drill, which are posted on the website of the Kansas Corporation Commission (KCC), can aid in monitoring the types of wells that are soon to be drilled in Kansas. As indicated by the intents-to-drill, the number of horizontal wells in the southern part of the state rapidly increased in 2011 and early 2012 and remained relatively constant until the last four months of 2014 (fig. 6). Permits dropped in the late months of 2014 and early 2015 in the southern tier of counties north of the Oklahoma state line. The continued low price of crude oil appears to have scotched filing of any intents-to-drill for horizontal wells in the traditional MLP fairway encompassed by the red-shaded counties (see fig. 6). A slight rise in oil and gas prices in 2016 may have spurred some permitting of a few new horizontal wells, but no to little activity in horizontal drilling is now the norm.
Figure 6—Intents-to-drill for Kansas counties immediately north of the Oklahoma state line (red) and in western Kansas (blue). Commodity prices are superimposed on the bar graph for number of intents-to-drill for the southern tier of Kansas counties.
It is anticipated that with few new wells being drilled, production from the MLP will continue to drop drastically in 2017, as it did in 2016. Gas-oil ratios (GORs) for the play will increase, mimicking the typical rise in GOR with time from individual wells. Up until mid-2015, monthly GOR for the play ranged between 7,000 and 9,000 cubic ft per barrel, but the monthly GOR increased to 15,900 cubic ft per barrel at the end of 2016. Cumulative GOR for the MLP horizontal wells since 2010 is 8,738 cubic ft per barrel. Any increased production in the MLP will only come with increased drilling. Drilling will only be increased with increases in the price of oil and natural gas.
As of February 2016 (and since September 2010), 812 horizontal wells have been drilled in Kansas, not counting a few miscellaneous gas storage, saltwater disposal, CBM, Niobrara, and Hugoton Field horizontal wells. A considerable number of wells—more than 100 drilled since September 2014‐have yet to report any production. Oil or natural gas production has been recorded for 596 wells (fig. 7). Of the producing wells, 57 have been officially plugged and abandoned or converted to enhanced oil recovery (EOR) wells. In addition, 72 of the producing wells have had no reported oil or gas production in the last year.
Figure 7—Modern horizontal wells in Kansas. Most horizontal wells in the southern tier of counties in the state are targeting the Mississippian. The approximate economic viability of the horizontal wells for their first two years of production is estimated by their reported monthly production volumes multiplied by the average monthly oil and gas price as reported by the U.S. Energy Information Agency.
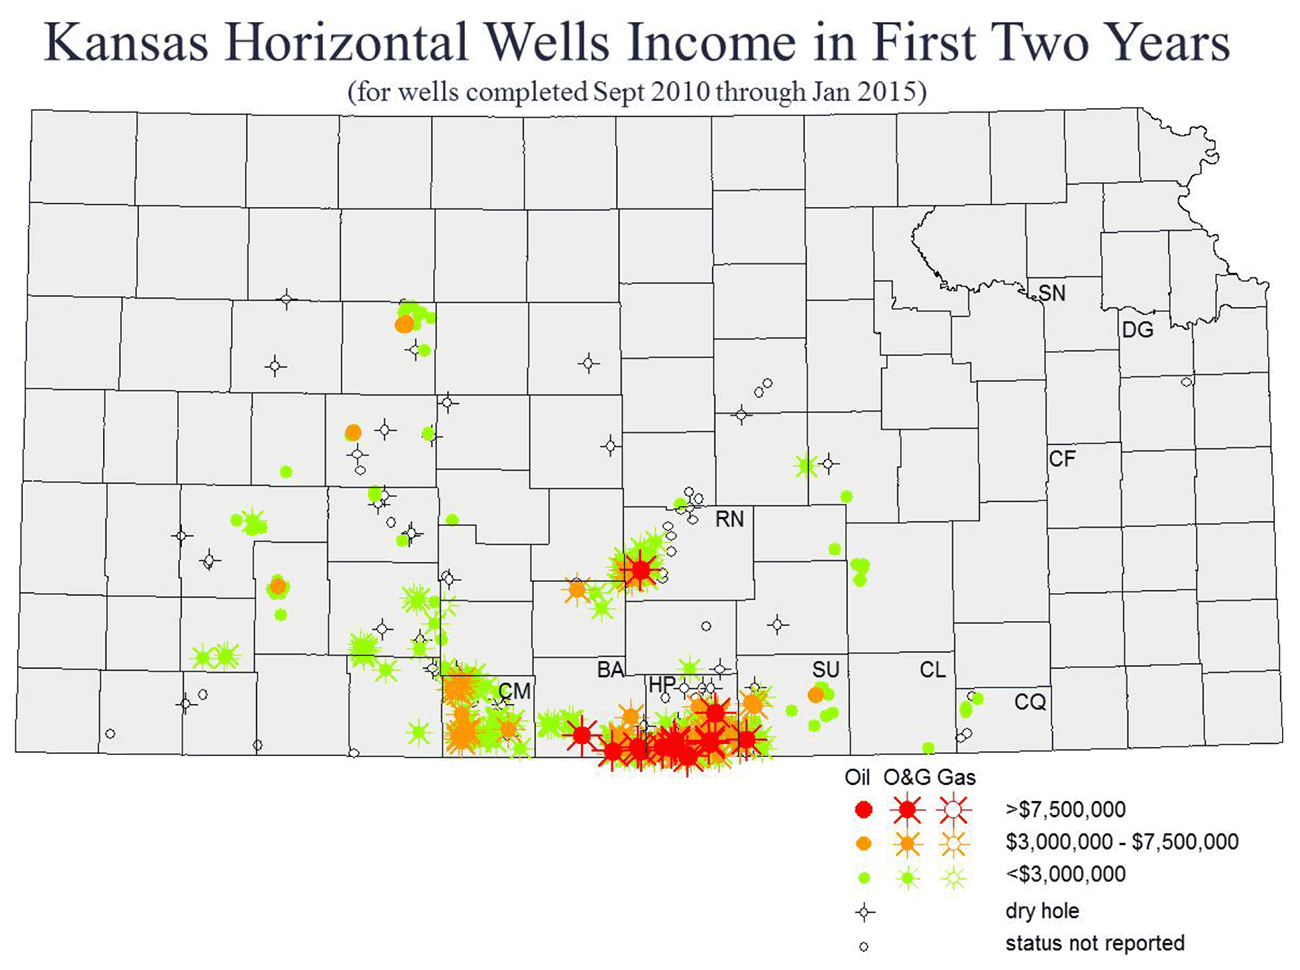
Examination of production in the first 113 MLP horizontal producing wells in Kansas by Newell and others (2014) indicates average monthly production one year after the peak month will be on the order of 25% of the peak month. Monthly production declines continually the longer a well is produced, but initial declines are marked (see fig. 8). If MLP wells cost about $3,000,000 to drill and complete, only one-fourth of the MLP horizontal wells are projected to recoup these costs with two years production. With the drop in the price of oil since 2014, perhaps as few as one in eight MLP horizontal wells can recoup the $3 million drilling and completion costs within two years of first production.
The most prolific Kansas MLP horizontal well with respect to cumulative production and greatest inferred income to date is the SandRidge Dean 3408 #1-27H well in sec. 27, T. 34 S., R. 08 W. in Harper County just north of the Oklahoma state line. In 32 months (production reported through January 2017), this well produced 235,953 bbls of oil and 2,175,873 thousand cubic feet (mcf) of natural gas (gross income ~$24.0 million). The second-most prolific well in terms of cumulative production is the SandRidge Bernice #1-17H well in in sec. 17, T. 35 S., R. 07 W. in Harper County (see table 1). No production has been reported for this well since September 2013, and in October 2014 the KCC approved an application filed for its temporary abandonment. This well was converted to an enhanced oil recovery well in May 2015. Table 1 presents the most prolific MLP wells, with respect to their cumulative production, in Kansas. The respective gross incomes are inferred by multiplying the monthly product price (published by the federal Energy Information Agency) by the respective monthly volumes of oil and gas (reported by the operator to the KCC).
Table 1—Most prolific cumulative production for Mississippian horizontal wells (as of January 2016), sorted according to inferred cumulative income. Two wells with the greatest cumulative oil and cumulative gas production, respectively, but not ranked among the top seven in income, also are listed.
| Well and location | Months of prod. |
Rank (by inferred cum. income) |
Cum. oil (bbls) |
Cum. gas (mcf) |
Cum. BOE (boe) [6000 cf = 1 BOE] |
Inferred cum. income (monthly price X monthly volume) |
|---|---|---|---|---|---|---|
| SandRidge Dean 3408 #1-27H 27-T34S-R08W, Harper Co. |
32 | 1 | 235,953 | 2,175,873 | 598,599 | $23,961,750 |
| SandRidge Bernice #1-17H 17-T35S-R07W, Harper Co. |
26 | 2 | 200,472 | 932,037 | 355,812 | $20,158,591 |
| SandRidge Lake #1-21H 21-T34-R06W, Harper Co. |
62 | 3 | 197,438 | 759,202 | 323,972 | $19,188,806 |
| SandRidge Hughes 3408 #1-22 22-T34S-R08W, Harper Co. |
29 | 4 | 260,804 | 1,010,552 | 429,229 | $17,723,330 |
| SandRidge 3407 Shrack #2-28H 28-T34S-R06W, Harper Co. |
46 | 5 | 158,600 | 1,140,576 | 348,696 | $16,735,243 |
| SandRidge Lori #1-2H 02-T35S-R10W, Barber Co. |
59 | 6 | 133,113 | 1,450,909 | 374,931 | $15,893,380 |
| CMX Scrooge #1-7H 07-T35S-R11W, Barber Co. |
66 | 7 | 136,559 | 1,213,053 | 338,735 | $14,555,015 |
| Unit Petroleum Urban #24-1H 13-T25S-R10W, Reno Co. |
35 | 9 | 213,152 | 200,986 | 246,650 | $12,784,419 |
| Shell GOM Chain Land #1-1H 01-T35S-R09W, Harper Co. |
47 | 13 | 87,806 | 1,742,812 | 378,275 | $10,900,797 |
In terms of monthly production in barrels of oil equivalence (BOE), in which natural gas is mathematically converted to barrels of oil with an approximate energy equivalence of 6,000 cubic feet equal to 1 barrel of oil, nine wells stand apart with production greater than 1,000 BOE/day (see table 1). The price discrepancy between natural gas and oil (where depending on relative pricing, 6,000 cubic feet of natural gas costs approximately one-fifth to one-third of its energy-equivalent one barrel of oil) affects the relative economic importance of these wells. Wells with greater liquids production fortuitously produced in months when oil prices rank high (for example, the SandRidge Dean 3408 #1-27H well) (see table 2) thus score high in a ranking based on monthly gross income.
Table 2—Most prolific monthly production for Mississippian horizontal wells, ranked by BOE/mo.
| Well and location | Month of prod. |
Date | Monthly oil (bbls/day) |
Monthly gas (mcf/day) |
Monthly BOE (bbls/day) [6000 cf = 1 BOE] |
Inferred income (monthly price X monthly volume) |
|---|---|---|---|---|---|---|
| SandRidge Hughes 3408 #1-22 22-T34S-R08W, Harper Co. |
2nd | Oct 2014 | 1,959 | 3,428 | 2,311 | $4,828,442 |
| SandRidge Dean 3408 #1-27H 27-T34S-R08W, Harper Co. |
4th | Sept 2014 | 1,876 | 2,512 | 2,295 | $5,164,204 |
| SandRidge Mary 3408 #1-21H 21-T34S-08W, Harper Co. |
1st | May 2015 | 1,186 | 2,808 | 1,654 | $2,104,299 |
| SandRidge Lori #2-2H 02-T35S-R10W, Barber Co. |
2nd | June 2012 | 238 | 7,061 | 1,415 | $1,082,348 |
| SandRidge Mary 3408 #2-21H 21-34S-08W, Harper Co. |
1st | May 2015 | 1,019 | 1,402 | 1,252 | $1,730,971 |
| SandRidge Lori #1-2H 02-T35S-R10W, Barber Co. |
2nd | April 2012 | 582 | 3,576 | 1,178 | $1,895,746 |
| SandRidge 3404 Peter #1-20H 20-T34S-R04W, Sumner Co. |
3rd | Sept 2013 | 844 | 1,753 | 1,136 | $2,714,390 |
| SandRidge Hunt 3408 #2-15H 15-T34S-08W, Harper Co. |
2nd | Mar 2015 | 947 | 1,105 | 1,131 | $1,267,627 |
| SandRidge Bernice #1-17H 17-T35S-R07W, Harper Co. |
5th | Dec 2011 | 849 | 1,603 | 1,116 | $2,500,850 |
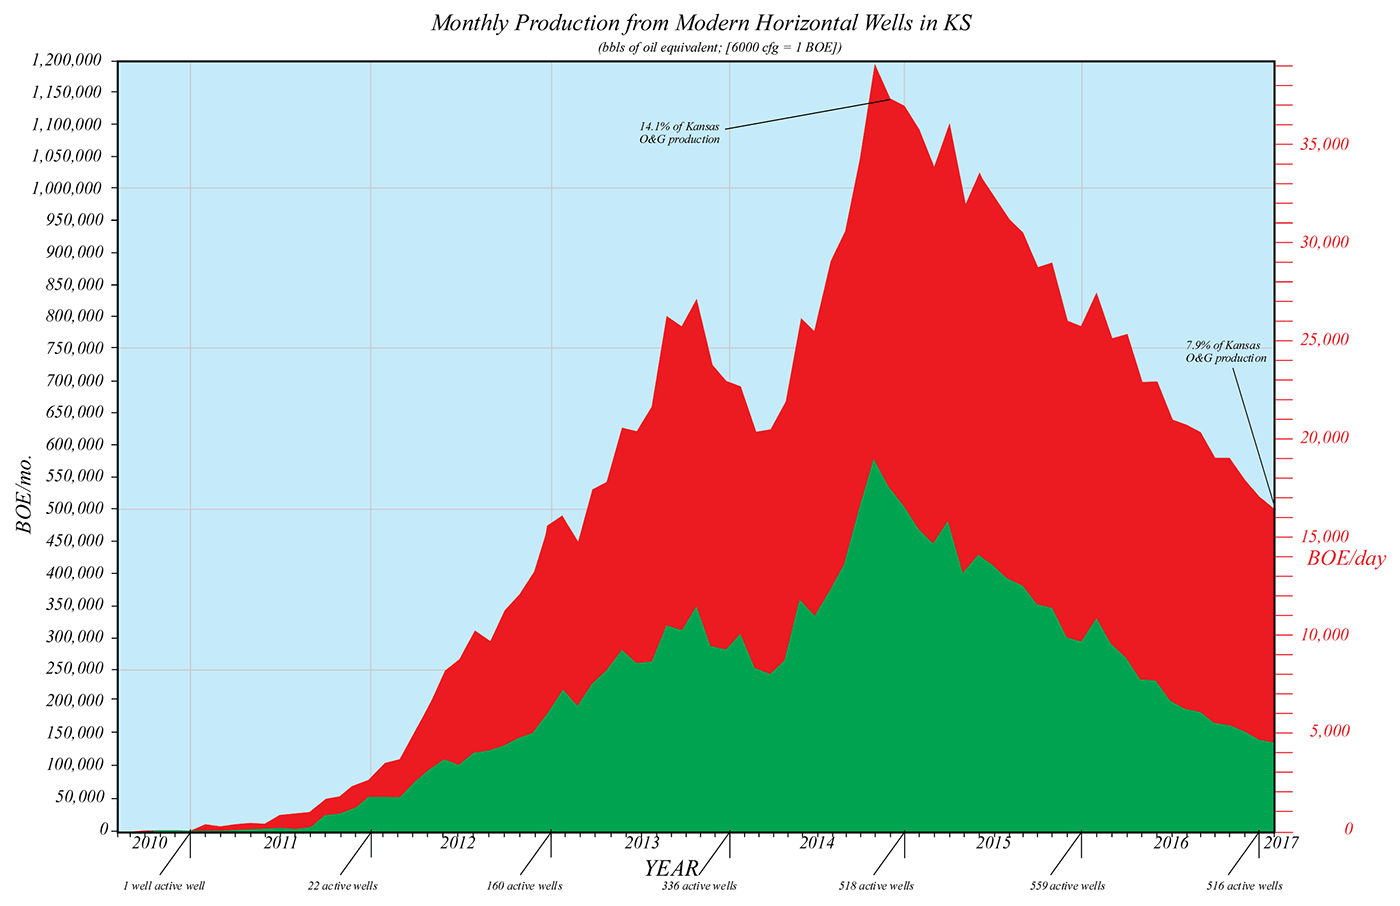
In January 2017 (the most recent publication of production data), 562 MLP horizontal wells (and 20 additional horizontal wells targeting other geological formations) constituted 7.9% of monthly oil and gas production in Kansas (figs. 8 and 9). This percentage generally increased since the first "modern" MLP horizontal well was drilled in late 2010, peaking at 14.1% in November 2014. Since then, the proportion of production from the horizontal wells with respect to the rest of Kansas production has generally declined. The remaining 92% of oil and gas production in the state is from approximately 52,800 oil wells and 23,300 gas wells.
Figure 8a—Production from modern horizontal wells in Kansas, differentiated by year of initial production. As of February 2017, 516 wells, 496 of which target the MLP, reported production.
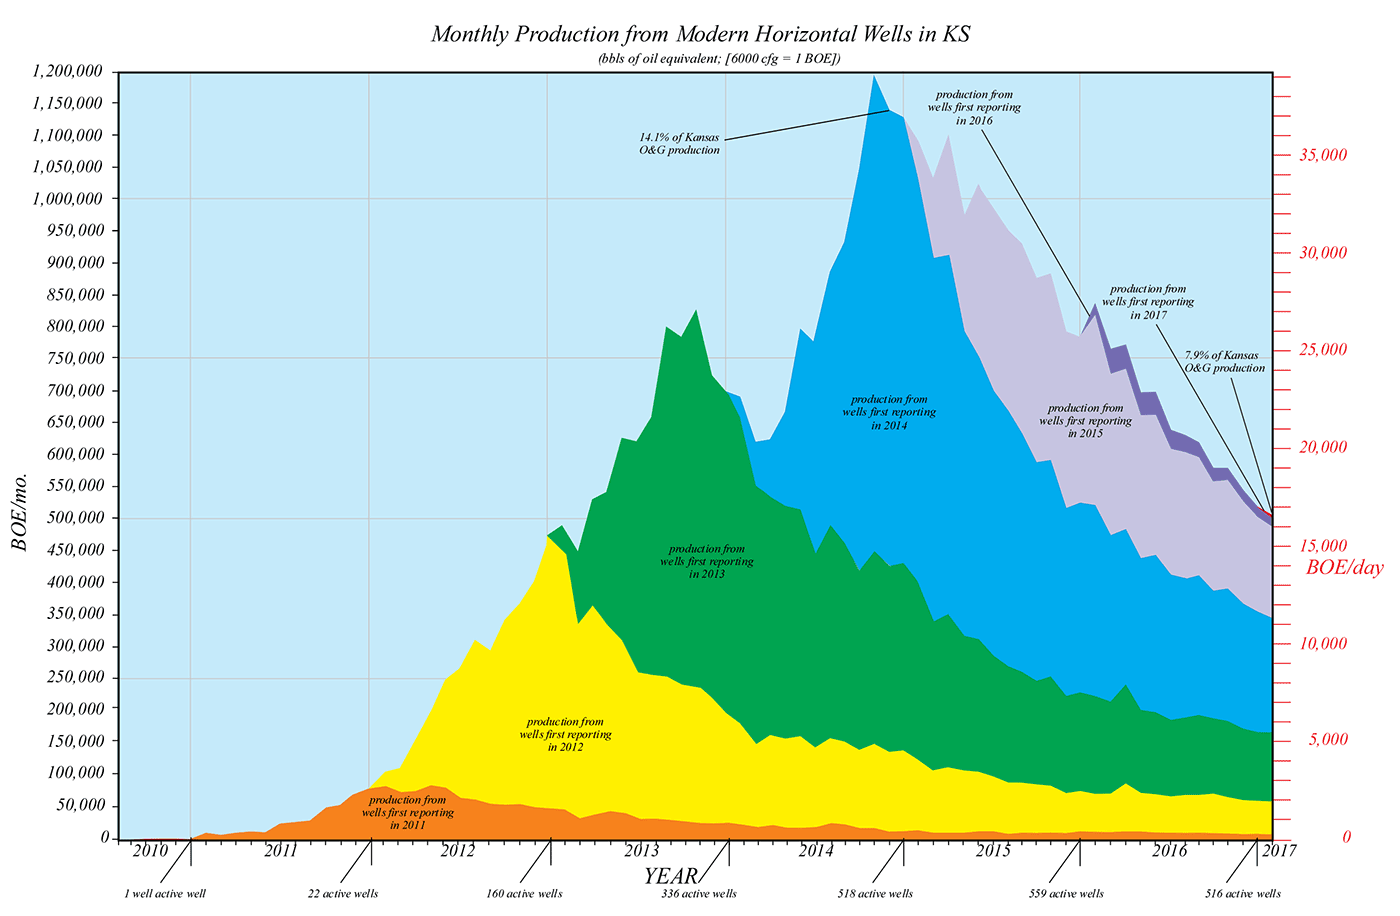
Figure 8b—Production from modern horizontal wells, differentiated by volume of oil (green) or gas (red). The gas-oil ratio of the MLP is increasing with time.
As mentioned, 2016 production by operator has yet to be compiled. However, according to KCC and KGS data, in 2015 SandRidge produced 2,945,612 bbls of oil from an inventory of vertical and horizontal wells, making the company No. 1 in oil production with 6.0% of the total oil production in the state.
With respect to natural gas in 2015, SandRidge was in second place with 30,014,788 mcf of natural gas, or 10.4% of total gas production in Kansas. No. 1 producer Linn Operating, LLC, No. 3 Pioneer Natural Resources USA, Inc., and No. 4 OXY USA are all major producers in the giant Hugoton-Panhandle Field in western Kansas.
Low prices for oil and gas in the last few years have fostered a harsh economic environment. On May 15, SandRidge joined several other energy companies that filed for bankruptcy in 2016, including, a few days earlier, Linn Operating, LLC. SandRidge claimed about $4 billion in debt and $7 billion in assets. (http://fuelfix.com/blog/2016/05/16/sandridge-energy-files-for-chapter-11-bankruptcy/#item-39118). Thus, the No. 1 oil producer, the No. 1 natural gas producer, and the No. 1 CBM producer (PostRock Energy; see page 4) all declared financial insolvency in 2016.
Modern (i.e., post mid-2010 spudded) horizontal wells in Kansas produced 139,060 bbls of oil and 2,212,048 mcf of natural gas during January 2017. Overall gas-oil ratio (GOR) for that month was 15.91 mcf/bbl. Cumulative production for the horizontal wells for September 2010 through January 2017 totaled 16,911,199 bbls and 147,774,515 mcf of natural gas. The cumulative GOR (8.74 mcf/bbl) indicates that 59% of the energy production from the new Kansas horizontal wells is attributed to natural gas. Most of this natural gas is associated with oil production. The cumulative production of the new horizontal wells since September 2010 represents ~$1.564 billion in gross income.
Production reports acquired by the KCC and subsequently published on the KGS website are subject to a four month time lag. As of January 2016, 596 horizontal wells in Kansas have produced oil or gas since September 2010. Table 3 lists operators for those wells.
Table 3—Operators of horizontal wells producing oil or gas, September 2010-January 2016.
| # of producing wells |
Percentage total production |
Company |
|---|---|---|
| 377 | 63% | SandRidge Energy |
| 70 | 12% | Shell Gulf of Mexico/Tapstone Energy |
| 42 | 7% | Unit Petroleum |
| 14 | 2% | Source Energy Midcon |
| 13 | 2% | Woolsey Operating |
| 13 | 2% | Osage Resources |
| 10 | 2% | Tug Hill Operating |
| 6 | 1% | Chesapeake Operating |
| 6 | 1% | Samuel Gary Jr. & Assoc. |
| 5 | 1% | Dorado E&P Partners |
| 5 | 1% | McElvain Energy |
| 48 | 8% | (24 other companies, none operating more than 4 wells) |
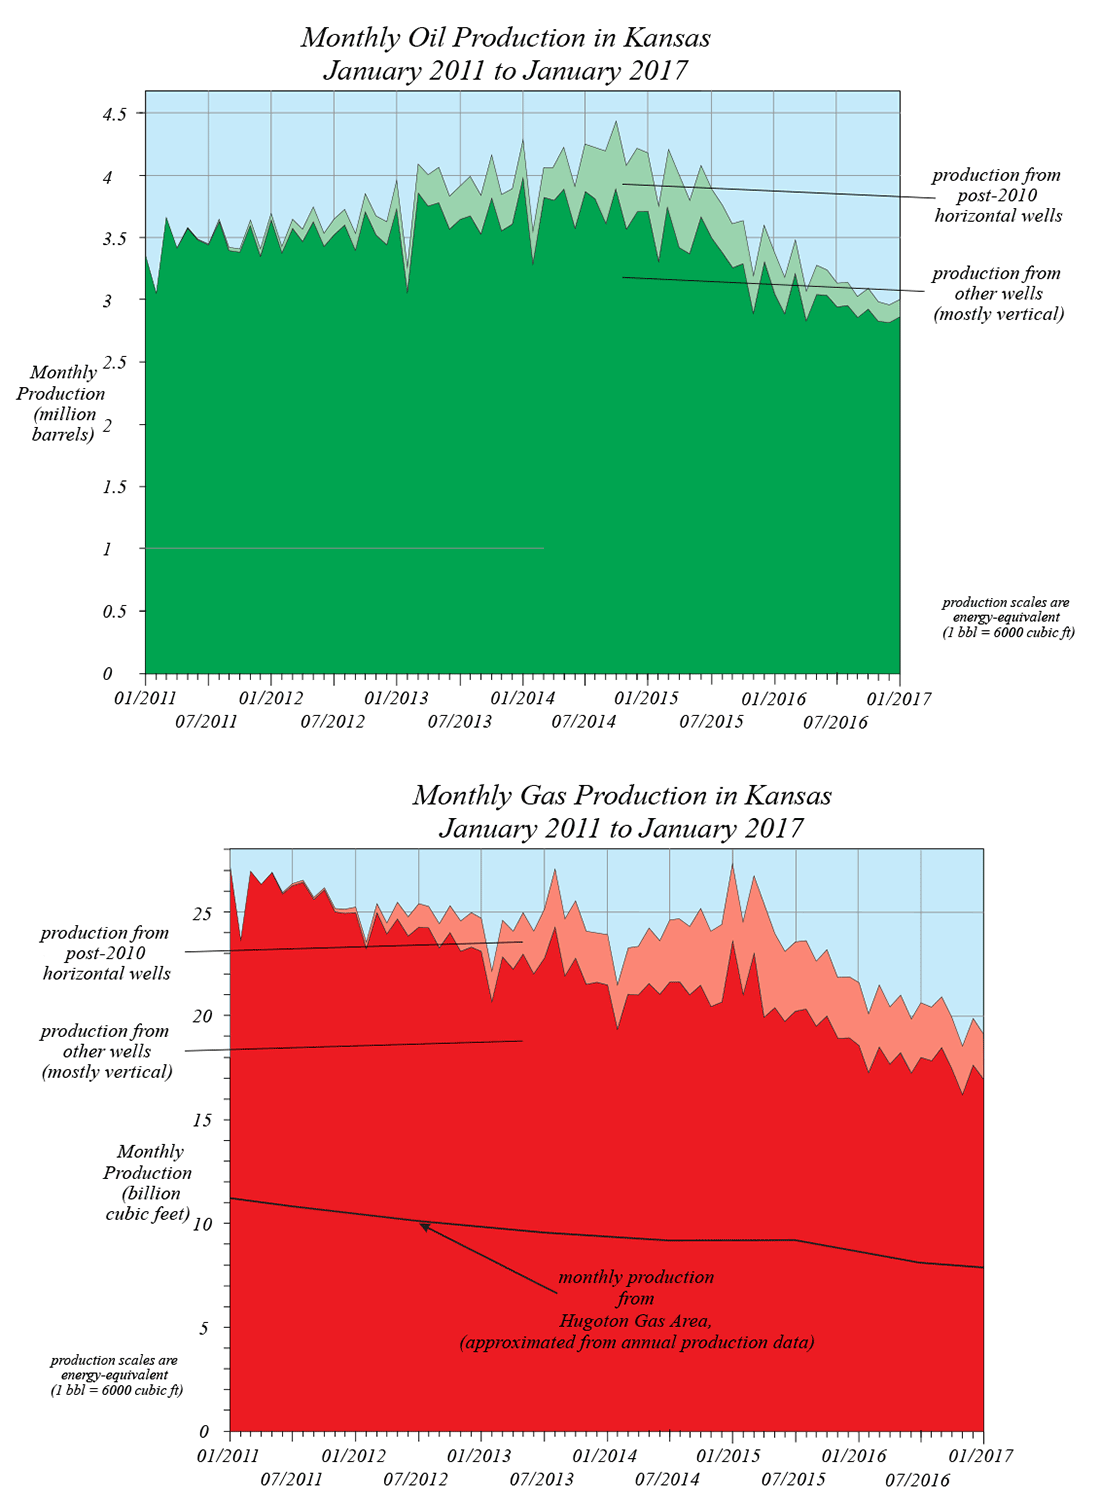
Kansas oil production generally increased from 2010 to late 2014. Additional production supplied by the new horizontal wells supplemented this increase. The new horizontal wells recorded peak production in October 2014 (fig. 8). The steady drop in natural gas production in Kansas stabilized somewhat between early 2012 and early 2015 due to the addition of natural gas production from the new horizontal wells (fig. 9). This drop in natural gas production in Kansas is largely due to the relatively low price commanded by natural gas in recent years (ergo, fewer natural gas wells and completions) and the depletion of the giant Hugoton-Panhandle Field. Natural gas and oil production in Kansas are virtually equivalent with regard to the energy content of each of these commodities (fig. 9), but the income produced by the natural gas is presently only a fraction (about one-fifth) of that produced by oil. Continued production reductions are anticipated with the price drops for crude oil and natural gas since late 2014 (see fig. 6).
Figure 9—Kansas oil and gas production, with contributions from the 596 new horizontal wells drilled since mid-2010. The vertical scale is energy equivalent, with 6,000 cubic feet of natural gas approximately equal to the BTU content of 1 barrel of oil.
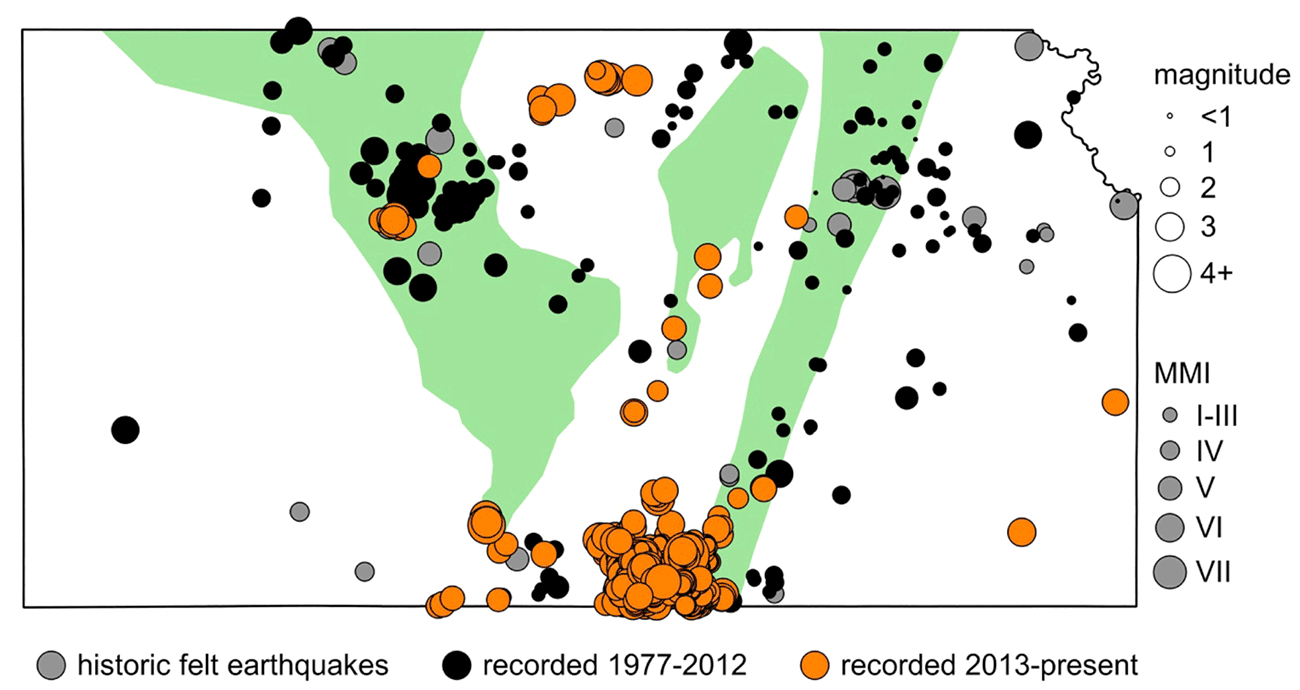
Prolific MLP horizontal wells also produce prolific amounts of saltwater. For example, cumulatively in 2015, the disposed-water to produced-oil ratio for Harper County was 16:1 (personal communication, 2015, Lynn Watney, Kansas Geological Survey). This wastewater is usually disposed of in the Arbuckle Group, which historically accepts large volumes of oil field brine and other industrial waste. Since 2013, however, eastern Harper County and western Sumner County have experienced several shallow earthquakes that are suspected to have been triggered by the prolific amount of production water sent to the Arbuckle (fig. 10). The seismicity is penecontemporaneous and geographically contiguous with a zone of recent earthquakes that continues south to Oklahoma City. Although cause-and-effect are disputed, the Kansas Corporation Commission in March 2015 ordered limits on underground oil wastewater disposal in five "areas of seismic concern" in Harper and Sumner counties. After 100 days, disposal was limited to 8,000 bbls per well per day. This order was amended in March 2016, pending statements of position from operators, to include expanded areas outside the original areas of concern. The expanded areas include Harper and Sumner counties and parts of Sedgwick and Kingman counties south of U.S. Highway 54, possibly allowing as much as 16,000 BWPD injection, but perhaps only the original 8,000 BWPD.
Figure 10—Kansas earthquakes through 2016 summarized. Recent Kansas seismicity in eastern Harper and western Sumner counties (orange dots in southern Kansas) was the target of a March 2015 ruling by the Kansas Corporation Commission to locally limit the volume of oil-field brine injected into the Arbuckle Group. (Map courtesy of Shelby Peterie, Kansas Geological Survey).
Newell, K. D., Watney, W. L., and Gerlach, P., 2014, An overview and preliminary economic assessment of horizontal wells drilled in the Mississippian Limestone Play in Kansas, 2010-2012: Kansas Geological Society, Bulletin 89, no. 1, p. 10-15.
Newell, K. D., and Yoakum, R. L., 2010, Kansas coalbed methane play; in, New Plays and Ways, D. F. Merriam, (ed.): Kansas Geological Society (Wichita, Kansas), Kansas Oil and Gas Fields, v. VI, p. 105-128.
Tedesco, S. A., 2013, Reservoir characterization and geology of the coals and carbonaceous shales of the Cherokee Group in the Cherokee basin, Kansas, Missouri, and Oklahoma, U.S.A.: unpublished Ph.D. Dissertation, Colorado School of Mines, Golden, Colorado, 2,201 p.
Shrout, J. D., and Newell, K. D., 2015, Production declines of Kansas coalbed methane wells as a function of their production rate and age: Transactions of the Kansas Academy of Science, v. 118, no. 1-2, p. 119-131.
Kansas Geological Survey
Placed online Aug. 10, 2017
Comments to webadmin@kgs.ku.edu
The URL for this page is http://www.kgs.ku.edu/Publications/OFR/2017/OFR17_31/index.html