![]()
Prev Page—Geology || Next Page—Soil
Coal
By J. E. Welch and L. L. Brady
Introduction
Since 1971 the U.S. Geological Survey and the U.S. Bureau of Mines have had an ongoing coal geochemistry program to sample and analyze the nation's coal. This type of basic data is necessary to determine the economic value of the coal and to evaluate the potential environmental effects related to coal mining, processing, and utilization, and also to determine the adaptability of the coal to beneficiation (cleaning), gasification, and liquefaction. The state geological surveys cooperate in this program by collecting and submitting samples for analysis. All the chemical analyses are stored in the U.S. Geological Survey's National Coal Resource Data System. Analytical results are also tabulated and sent to the state surveys for the samples they submit. Such arrangements make the program of mutual benefit to the parties involved. Depending on the coals that have been sampled and analyzed, these data can be used for comparison of coal on a local, state, regional, or national basis.
This section of the report consists of comparisons of the Rowe and Dry Wood coals from the mine site to each other, to southeastern Kansas coal, to Interior Province coal, and to the Rowe and Dry Wood coals from southwestern Missouri.
Most contamination from surface mining of coal at a mine site does not result from coal, but from other exposed overburden material. Most environmental contamination of soil and water directly by coal is related to coal-cleaning waste piles, coal storage piles, and fly and bottom ash piles related to coal processing and utilization. It was not an objective of the present study to investigate the redistribution of elements in the environment from the processing and utilization of the Rowe and Dry Wood coals.
Experimental Procedures
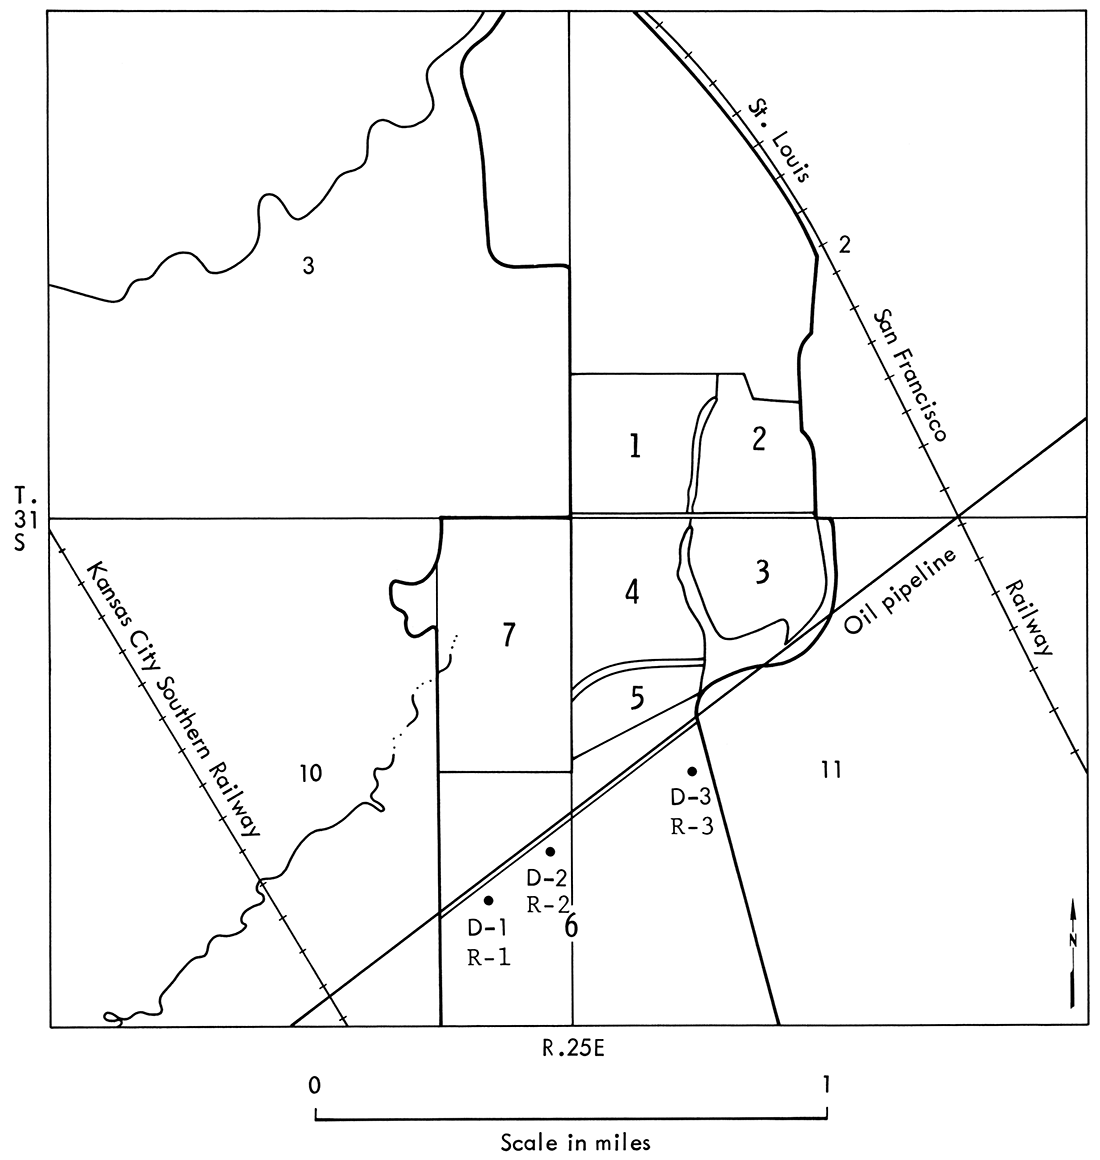
Channel samples of the Rowe and Dry Wood coals were taken from the mine highwall at the locations shown in Figure 9. Samples R-1, R-2, D-1, and D-2 were collected on January 20, 1976. Samples R-3 and D-3 were collected on March 10, 1976. Each sample weighed approximately 2 kilograms and all were sealed at the time of collection in plastic bags to prevent moisture loss. The samples were sent to the U.S. Geological Survey laboratory in Denver, Colorado, for analysis of major and minor oxides and trace elements. (The analytical methods used by the U.S. Geological Survey are described in Swanson and Huffman [1976].) The U.S. Geological Survey sent subsampies of approximately 600 grams each to the Coal Analysis Section of the U.S. Department of Energy (formerly of the Bureau of Mines, U.S. Department of the Interior), Pittsburgh, Pennsylvania, for proximate analysis (percent moisture, volatile matter, fixed carbon, and ash), ultimate analysis (percent hydrogen, carbon, nitrogen, oxygen, and sulfur), heat of combustion, and percent forms of sulfur. The analytical methods used by the Coal Analysis Section are described in U.S. Bureau of Mines Bulletin 638 (U.S Bureau of Mines, 1967).
Figure 9—Map of location of coal-sampling sites.
Rowe and Dry Wood Coals from the Mine Site
The fixed carbon, volatile matter, and heat of combustion values of the Rowe and Dry Wood coals (Table 3) were quite similar and high. Averages of these parameters on a moisture- and ash-free basis were 57.0 percent fixed carbon, 43.0 percent volatile matter, and 14,507 Btu/lb (British thermal units per pound) heat of combustion for the Rowe coal; and 57.7 percent fixed carbon, 42.2 percent volatile matter, and 14,435 Btu/lb heat of combustion for the Dry Wood coal (averages of samples D-2 and D-3). These values are typical of Cherokee Group coals in southeastern Kansas (Brady and Hatch, 1977) and rank the Rowe and Dry Wood as high-volatile A, bituminous coals (American Society for Testing Materials, 1978).
The average ash content of the Dry Wood coal on an as-received basis was 25.5 percent compared to 18.0 percent for the Rowe coal (Table 3). Both of these values are higher than the 13.7 percent average ash content of southeastern Kansas coal. The high ash contents of these 2 coals are a result of the higher-than-normal amounts of silt and clay that were deposited with the organic material that formed these particular coals. A negative result of the high ash contents of the Rowe and Dry Wood coals is lower heats of combustion. The average heat of combustion of 10,310 Btu/lb for the Dry Wood coal on an as received basis is less than the 11,473 Btu/lb for the Rowe coal and both of these values are well below the 12,177 Btu/lb average for southeastern Kansas coal.
Table 3—Proximate and ultimate analyses, and heats of combustion for the Rowe and Dry Wood coals.
| Sample Site |
Typea | Proximate Analysis (%) | Ultimate Analysis (%) | Heat of Combustion | ||||||||
|---|---|---|---|---|---|---|---|---|---|---|---|---|
| Moisture | Volatile Matter |
Fixed Carbon |
Ash | Hydrogen | Carbon | Nitrogen | Oxygen | Sulfur | Kcal/kg | Btu/lb | ||
| Rowe | ||||||||||||
| R-1 | A | 2.3 | 33.4 | 43.3 | 21.0 | 4.1 | 57.6 | 0.9 | 4.1 | 12.3 | 6,090 | 10,970 |
| B | --- | 34.2 | 44.3 | 21.5 | 3.9 | 59.0 | 0.9 | 2.1 | 12.6 | 6,240 | 11 ,230 | |
| C | --- | 43.5 | 56.5 | --- | 5.0 | 75.1 | 1.2 | 2.7 | 16.0 | 7,940 | 14,300 | |
| R-2 | A | 2.5 | 33.9 | 43.8 | 19.8 | 4.7 | 59.9 | 1 .0 | 4.4 | 10.2 | 6,290 | 11,320 |
| B | --- | 34.8 | 44.9 | 20.3 | 4.5 | 61.4 | 1.0 | 2.2 | 10.5 | 6,450 | 11,610 | |
| C | --- | 43.6 | 56.4 | --- | 5.7 | 77.1 | 1.3 | 2.8 | 13.1 | 8,100 | 14,570 | |
| R-3 | A | 3.9 | 34.6 | 48.2 | 13.3 | 4.9 | 65.6 | 1.0 | 8.4 | 6.7 | 6,740 | 12,130 |
| B | --- | 36.0 | 50.2 | 13.8 | 4.6 | 68.3 | 1 .0 | 5.1 | 7.0 | 7,010 | 12,630 | |
| C | --- | 41.8 | 58.2 | --- | 5.4 | 79.2 | 1.2 | 6.0 | 8.1 | 8,140 | 14,650 | |
| Dry Wood | ||||||||||||
| D-1b | A | 22.5 | 25.0 | 43.8 | 8.7 | 5.3 | 52.4 | 0.8 | 31.8 | 1.0 | 4,809 | 8,650 |
| B | --- | 32.3 | 56.5 | 11.2 | 3.6 | 67.7 | 1.1 | 15.2 | 1.3 | 6,210 | 11,170 | |
| C | --- | 36.3 | 63.7 | --- | 4.0 | 76.2 | 1.2 | 17.1 | 1.4 | 6,989 | 12,570 | |
| D-2 | A | 2.5 | 31.9 | 45.6 | 20.0 | 4.5 | 60.8 | 1 .0 | 5.9 | 7.9 | 6,290 | 11,330 |
| B | --- | 32.7 | 46.8 | 20.5 | 4.3 | 62.4 | 1.0 | 3.8 | 8.1 | 6,450 | 11,620 | |
| C | --- | 41.2 | 58.8 | --- | 5.4 | 78.5 | 1.3 | 4.7 | 10.1 | 8,120 | 14,620 | |
| D-3 | A | 3.7 | 28.2 | 37.0 | 31.1 | 3.8 | 47.8 | 0.8 | 3.7 | 12.8 | 5,160 | 9,290 |
| B | --- | 29.3 | 38.4 | 32.3 | 3.5 | 49.6 | 0.8 | 0.4 | 13.3 | 5,360 | 9,650 | |
| C | --- | 43.3 | 56.7 | --- | 5.2 | 73.3 | 1.2 | 0.6 | 19.6 | 7,910 | 14,250 | |
| (a) Determinations are reported 3 ways: A) as-received basis; B) moisture-free basis; and C) moisture- and ash-free basis. (b) sample D-1 was determined to be from a weathered zone. |
||||||||||||
The average sulfur content of 10.3 percent for the Dry Wood coal on an as-received basis compares quite well with the 9.7 percent for the Rowe coal (Table 3). These values are well above the 4.0 percent average sulfur content of southeastern Kansas coal. As shown by the forms of sulfur (Table 4), most of the sulfur in the Rowe and Dry Wood coals is pyritic. On as as-received basis, the average amount of total sulfur present as pyritic sulfur is 83.6 percent for the Rowe and 72.1 percent for the Dry Wood coal. The lower percentage of pyritic sulfur in the Dry Wood coal is a result of the higher organic sulfur content in this coal. Pyrite is present in these coals as bands up to 1 cm thick, as thin films along bedding planes, as filling material in fractures, as individual nodules, and as small disseminated grains.
Table 4—Air-dried loss, forms of sulfur, free swelling index, and ash-fusion temperatures for the Rowe and Dry Wood coals.
| Sample Site |
Typea | Air-dried loss (%) |
Forms of Sulfur (%) | Free Swelling Index |
Ash Fusion-Temperature, °C | ||||
|---|---|---|---|---|---|---|---|---|---|
| Sulfate | Pyritic | Organic | Initial Deformation |
Softening | Fluid | ||||
| Rowe | |||||||||
| R-1 | A | 0.7 | .70 | 10.73 | .86 | 7.5 | 1,315 | 1,375 | 1,420 |
| B | --- | .72 | 10.98 | .88 | |||||
| C | --- | .91 | 13.99 | 1.12 | |||||
| R-2 | A | 0.5 | .71 | 8.43 | 1.07 | 8.5 | 1,270 | 1,325 | 1,380 |
| B | --- | .73 | 8.65 | 1.10 | |||||
| C | --- | .91 | 10.85 | 1.38 | |||||
| R-3 | A | 1.8 | .69 | 5.18 | .85 | 9.0 | 1,170 | 1,225 | 1,290 |
| B | --- | .72 | 5.39 | .88 | |||||
| C | --- | .83 | 6.26 | 1.03 | |||||
| Dry Wood | |||||||||
| D-1b | A | 16.8 | .01 | .06 | .92 | 0 | 1,235 | 1,295 | 1,345 |
| B | --- | .01 | .08 | 1.18 | |||||
| C | --- | .01 | .08 | 1.33 | |||||
| D-2 | A | 0.5 | .48 | 5.97 | 1.41 | 8.5 | 1,175 | 1,215 | 1,265 |
| B | --- | .49 | 6.12 | 1.45 | |||||
| C | --- | .62 | 7.70 | 1.82 | |||||
| D-3 | A | 1.1 | .96 | 8.88 | 2.95 | 4.0 | 1,070 | 1,125 | 1,175 |
| B | --- | 1.00 | 9.22 | 3.06 | |||||
| C | --- | 1.47 | 13.62 | 4.52 | |||||
| (a) Determinations are reported 3 ways: A) as-received basis; B) moisture-free basis; and C) moisture- and ash-free basis. (b) Sample D-1 was determined to be from a weathered zone. |
|||||||||
The elemental compositions of the Rowe and Dry Wood coals given in Table 5 show differences within and between the coals that in part reflect variations in the transport and deposition of inorganic materials in the respective peat swamps from which these coals developed. Elements showing variations within both the Rowe and Dry Wood coals are calcium, potassium, iron, titanium, manganese, phosphorus, arsenic, boron, barium, cobalt, copper, fluoride, nickel, lead, strontium, and zinc. In addition to these elements the Dry Wood coal also showed variations in magnesium, silver, cadmium, gallium, mercury, lanthanum, neodymium, and yttrium.
Table 5—Major, minor, and trace-element composition of the Rowe and Dry Wood coals.a
| Sample Site |
Si % |
Al % |
Ca % |
Mg % |
Na % |
K % |
Fe % |
Ti % |
Cl % |
Mn ppm |
P ppm |
Ag ppm |
As ppm |
B ppm |
|---|---|---|---|---|---|---|---|---|---|---|---|---|---|---|
| Rowe | ||||||||||||||
| R-1 | 1.8 | 1.1 | .064 | .036 | .019 | .15 | 7.5 | .053 | .038 | 101 | 414 | 0b | 41 | 9 |
| R-2 | 2.3 | 1.2 | .059 | .045 | .021 | .14 | 6.3 | .068 | .036 | 69 | 394 | 0 | 39 | 12 |
| R-3 | 1.7 | 1.1 | .14 | .038 | .020 | .095 | 4.9 | .044 | .028 | 54 | 306 | 0 | 25 | 27 |
| Dry Wood | ||||||||||||||
| D-1d | 2.2 | 1.2 | .48 | .14 | .048 | .16 | 2.3 | .088 | .023 | 222 | 253 | .8 | 4 | 8 |
| D-2 | 3.5 | 2.3 | .47 | .052 | .017 | .21 | 5.3 | .073 | .042 | 81 | 460 | .4 | 27 | 10 |
| D-3 | 3.2 | 1.7 | .60 | .077 | .017 | .23 | 7.0 | .056 | .064 | 124 | 710 | 0 | 31 | 0 |
| Sample Site |
Ba ppm |
Be ppm |
Cd ppm |
Ce ppm |
Co ppm |
Cr ppm |
Cu ppm |
F ppm |
Ga ppm |
Ge ppm |
Hg ppm |
La ppm |
Li ppm |
Mo ppm |
| Rowe | ||||||||||||||
| R-1 | 19 | 3 | <.19 | 0 | 13 | 13 | 40 | 40 | ---c | 9 | .21 | 0 | 9.6 | 0 |
| R-2 | 27 | 3 | <.18 | 0 | 5 | 12 | 31 | 55 | 5 | 12 | .20 | 0 | 24 | 0 |
| R-3 | 70 | 2 | .2 | 0 | 10 | 14 | 42 | 30 | 4 | 14 | .14 | 0 | 12 | 0 |
| Dry Wood | ||||||||||||||
| D-1 | 80 | 2 | .9 | 0 | 6 | 23 | 37 | 105 | 3 | 6 | .46 | 8 | 5.6 | 2 |
| D-2 | 31 | 2 | 16 | 0 | 63 | 15 | 42 | 75 | 10 | 4 | .23 | 15 | 12 | 0 |
| D-3 | 32 | 1.5 | 158 | 0 | 32 | 16 | 75 | 65 | 32 | 6 | .83 | 22 | 10 | 0 |
| Sample Site |
Nb ppm |
Nd ppm |
Ni ppm |
Pb ppm |
Sb ppm |
Sc ppm |
Se ppm |
Sr ppm |
Th ppm |
U ppm |
V ppm |
Y ppm |
Yb ppm |
|
| Rowe | ||||||||||||||
| R-1 | 0 | -- | 56 | 169 | .9 | 2 | 3.1 | 56 | <3.0 | .9 | 19 | 9 | -- | |
| R-2 | 0 | -- | 27 | 215 | .6 | 2 | 2.7 | 36 | <3.0 | .6 | 18 | 12 | -- | |
| R-3 | 0 | -- | 28 | 167 | .6 | 2 | 3.3 | 42 | <3.0 | .8 | 28 | 14 | -- | |
| Dry Wood | ||||||||||||||
| D-1 | 2 | 23 | 23 | 52 | 1.3 | 8 | 3.2 | 80 | <3.0 | 6.7 | 34 | 80 | 8 | |
| D-2 | 0 | 42 | 105 | 48 | 1.7 | 4 | 4.5 | 31 | <3.0 | 1.6 | 31 | 63 | 6 | |
| D-3 | 0 | 0 | 97 | 145 | 1.5 | 3 | 3.0 | 97 | <3.0 | 1.7 | 32 | 48 | -- | |
| Sample Site |
Zn ppm |
Zr ppm |
||||||||||||
| Rowe | ||||||||||||||
| R-1 | 38 | 9 | ||||||||||||
| R-2 | 16 | 18 | ||||||||||||
| R-3 | 142 | 14 | ||||||||||||
| Dry Wood | ||||||||||||||
| D-1 | 89 | 17 | ||||||||||||
| D-2 | 5,335 | 21 | ||||||||||||
| D-3 | 50,968 | 16 | ||||||||||||
| (a) AS, F, Hg, Sb, Se, Th, and U values from direct determinations on oven air-dried (32°C) coal <80 mesh); other values calculated from analyses of ash. (b) None detected. (c) Not determined. (d) Sample D-1 was from a weathered zone. |
||||||||||||||
Compared to the Rowe coal, the Dry Wood coal contains higher amounts of 31 of the 43 elements analyzed. Of these 31 elements those showing significantly higher amounts are calcium, manganese, phosphorus, cadmium, cobalt, copper, fluoride, gallium, mercury, lanthanum, nickel, strontium, and zinc. The Rowe coal contains higher amounts of 8 elements. These are sodium, arsenic, boron, barium, beryllium, germanium, lithium, and lead. Of these 8 elements only 3 (boron, germanium, and lead) show significantly higher amounts. Elements analyzed for, but not detected, in both coals were cerium, molybdenum, and niobium. These 2 coals contain nearly equal amounts of iron.
A convenient way of measuring the relative enrichment of elements in coal is by comparison to their average crustal abundance. This is done by looking at values calculated by dividing an element's average concentration in coal by that element's average crustal abundance. These are known as enrichment factors. Elements enriched in the Rowe and Dry Wood coals are shown in Table 6.
Table 6—Elements enriched in the Rowe and Dry Wood coals with respect to their average composition in the earth's crust.a
| Element | Enrichment Factor | |
|---|---|---|
| Rowe | Dry Wood | |
| Fe | 1.1 | 1.1 |
| Cl | 2.6 | 4.1 |
| As | 19.4 (6.6)b | 16.1 |
| B | 1.9 (5 ) | |
| Cd | 435 | |
| Co | 1.9 | |
| Ga | 1.4 | |
| Ge | 8.0 | 3.3 |
| Hg | 2.2 (1.2) | 6.6 |
| Ni | 1.3 | |
| Pb | 14.7 (1.5) | 7.7 |
| Sb | 3.5 (4) | 8.0 |
| Se | 60 (56) | 74 |
| Y | 1.7 | |
| Zn | 402 | |
| (a) Calculated using values from Taylor, 1964. (b)Numbers in parentheses are reported enrichment values for Interior Province coal (from Commission on Natural Resources, 1979). |
||
The Rowe coal is slightly enriched in iron, chloride, boron, mercury, and antimony; moderately enriched in germanium; and markedly enriched in arsenic, lead, and selenium. The Dry Wood coal is slightly enriched in iron, chloride, cobalt, gallium, germanium, and nickel; moderately enriched in mercury, lead, and antimony; and markedly enriched in cadmium, arsenic, selenium, and zinc. Of the elements listed above, those of concern from a health and environmental aspect that show significantly marked enrichment are arsenic, cadmium, germanium, mercury, lead, antimony, selenium, and zinc. These are all potentially hazardous elements but with varying degrees of concern. Those of greatest concern are arsenic, cadmium, mercury, lead, and selenium. Zinc is of moderate concern, germanium is of minor concern, and antimony is of no immediate concern (U.S. National Committee for Geochemistry, 1980).
As shown in Table 5, the Dry Wood coal contains extremely high amounts of cadmium and zinc. The higher-than-normal amounts of these elements in the Dry Wood coal have been documented previously (Hatch, Avcin, and others, 1976). These higher amounts of cadmium and zinc seem to be related to sphalerite mineralization in the Tri-State Mining District (southeastern Kansas, southwestern Missouri, and northeastern Oklahoma). The association of cadmium and zinc in sphalerite-filled fractures in Illinois coals has been observed and discussed by Hatch, Gluskoter, and Lindahl (1976) and Gluskoter and others (1977).
Comparison of Rowe and Dry Wood Coals from Kansas with Interior Province Coals
Table 7 compares the average proximate and ultimate analyses, heats of combustion, and forms of sulfur (on an as-received basis) of the Rowe and Dry Wood coals from Kansas with Interior Province coal. Table 8 compares their average elemental compositions. The element averages for Interior Province coal are based on 143 coal samples (Swanson and others, 1976). Of the 143 samples, 118 (82 percent) were from the Western Region of the Province (Iowa, Nebraska, Missouri, Kansas, Oklahoma, and Arkansas). Of the remaining 25 samples, 3 were from the Northern Region of the Province (Michigan) and 22 were from the Eastern Region (Indiana). The averages for proximate and ultimate analyses, heats of combustion, and forms of sulfur for Interior Province coal are based on only 90 samples , The reduction in the number of samples resulted from the common practice by the Coal Analysis Section of the U.S. Department of Energy of compositing samples from the same mine location (outcrop, mine highwall, or drill core) or the same coal bed within an area. Since the majority of the Interior Province samples are from the Western Region, the averages better reflect the coal from that Region; and it would be more appropriate to refer to the values as representative of Western Interior Province coal.
Table 7—Average proximate and ultimate analyses, and forms-of-sulfur for the Rowe and Dry Wood coals from Kansas and Interior Province coal on an as-received basis. [Note: Kansas Rowe values were averaged from 3 samples (R-1, 2, and 3) and Kansas Dry Wood values were averaged from 2 samples (D-2 and D-3); sample D-1 was from a weathered zone. Interior Province values were averaged from 90 coal samples (Swanson and others, 1976).]
| Coal | Proximate Analysis (%) | Ultimate Analysis (%) | Heat of Combustion | ||||||||
|---|---|---|---|---|---|---|---|---|---|---|---|
| Moisture | Volatile Matter |
Fixed Carbon |
Ash | Hydrogen | Carbon | Nitrogen | Oxygen | Sulfur | Kcal/kg | Btu/lb | |
| Rowe | 2.3 | 33.9 | 45.1 | 18.0 | 4.6 | 61.0 | 1.0 | 5.6 | 9.7 | 6,373 | 11,473 |
| Dry Wood | 3.1 | 30.0 | 41.3 | 25.5 | 4.1 | 54.3 | .9 | 4.8 | 10.3 | 5,725 | 10,310 |
| Interior Province | 7.2 | 32.2 | 48.0 | 12.6 | 4.9 | 65.2 | 1.2 | 12.2 | 3.9 | 6,431 | 11,580 |
| Coal | Forms of Sulfur (%) | ||
|---|---|---|---|
| Sulfate | Pyritic | Organic | |
| Rowe | .70 | 8.11 | .93 |
| Dry Wood | .72 | 7.42 | 2.18 |
| Interior Province | .27 | 2.37 | 1.25 |
Table 8—Average major, minor, and trace-element composition of the Rowe and Dry Wood coals from Kansas and Interior Province coal.a,b
| Coal | Si % |
Al % |
Ca % |
Mg % |
Na % |
K % |
Fe % |
Ti % |
Mn ppm |
As ppm |
B ppm |
Ba ppm |
Be ppm |
|---|---|---|---|---|---|---|---|---|---|---|---|---|---|
| Rowe | 1.9 | 1.1 | .088 | .042 | .020 | .13 | 6.2 | .055 | 75 | 35 | 19 | 39 | 2.5 |
| Dry Wood | 3.3 | 2.0 | .53 | .064 | .017 | .22 | 6.1 | .064 | 102 | 29 | 5 | 31 | 1.7 |
| Interior Province | 2.0 | .97 | 1.2 | .089 | .035 | .16 | 3.3 | .052 | 138 | 21 | 100 | 70 | 3.0 |
| Coal | Cd ppm |
Co ppm |
Cr ppm |
Cu ppm |
F ppm |
Ga ppm |
Hg ppm |
Li ppm |
Mo ppm |
Nb ppm |
Ni ppm |
Pb ppm |
Sb ppm |
| Rowe | <.19 | 9 | 13 | 38 | 42 | 4 | .18 | 15 | 0c | 0 | 37 | 184 | .7 |
| Dry Wood | 87 | 47 | 16 | 58 | 70 | 21 | .53 | 11 | 0 | 0 | 101 | 96 | 1.6 |
| Interior Province | 7.1 | 7 | 15 | 20 | 71 | 5 | .14 | 11 | 5 | 1.5 | 30 | 55 | 1.7 |
| Coal | Sc ppm |
Se ppm |
Sr ppm |
Th ppm |
U ppm |
V ppm |
Y ppm |
Yb ppm |
Zn ppm |
Zr ppm |
|||
| Rowe | 2 | 3.0 | 45 | <3.0 | .8 | 22 | 12 | 0 | 65 | 14 | |||
| Dry Wood | 4 | 3.7 | 64 | <3.0 | 1.6 | 31 | 55 | 3 | 28,151 | 18 | |||
| Interior Province | 3 | 4.6 | 50 | 5.2 | 3.3 | 20 | 10 | .7 | 373 | 15 | |||
| (a) As, F, Hg, Sb, Se, Th, and U are from direct determination on oven air-dried (32°) coal <80 mesh); other values calculated from analyses of ash. (b) Kansas Rowe values were averaged from 3 samples (R-1, 2, and 3), and Kansas Dry Wood samples were averaged from 2 samples (D-2 and D-3); sample D-1 was from a weathered zone. Interior Province values were averaged from 143 coal samples (Swanson and others, 1976). (c) None detected. |
|||||||||||||
The 25.5 percent average ash content of the Dry Wood coal is twice that of the 12.6 percent average of Interior Province coal. Its average carbon content is 10.9 percent less than the Province average, while that of the Rowe coal is only 4.2 percent less. Because of its higher ash content the Dry Wood coal has a lower average heat of combustion than Interior Province coal, while the average for the Rowe coal is essentially the same. The Rowe coal contains 5.8 percent more average total sulfur than the Province average and the Dry Wood contains 6.4 percent more. Most of the sulfur found in Interior Province coal is present as pyritic sulfur, and the Rowe and Dry Wood coals are no exception. However, their average concentrations of pyritic sulfur are 3 times that of Interior Province coal.
Both the Rowe and Dry Wood average more iron, copper, mercury, nickel, and lead than Interior Province coal. The Dry Wood coal also contains more silicon, aluminum, potassium, titanium, cadmium, cobalt, gallium, strontium, vanadium, yttrium, ytterbium, and zinc.
To date the only trace elements documented to be enriched in Interior Province coal in relation to their average crustal abundance are arsenic, boron, mercury, molybdenum, lead, antimony, and selenium (Commission on Natural Resources, 1979). The average enrichment values for these elements in Interior Province coal are shown in parentheses in Table 6 along with those for the Rowe and Dry Wood coals at the mine site. Comparisons of these enrichment values show the Rowe coal is more enriched in arsenic, mercury, and lead than Interior Province coal by factors of 2.9, 1.8, and 9.8, respectively. The Dry Wood coal is enriched more in arsenic, mercury, lead, and antimony by factors of 2.4, 5.5, 5, and 2, respectively.
Comparison of Rowe and Dry Wood Coals from Kansas and Missouri
Table 9 compares the average proximate and ultimate analyses and heats of combustion (on an as-received basis) of the Rowe and Dry Wood coals from the mine site and from Barton County in southwestern Missouri. [Note: It must be noted here that Missouri's spelling of the Dry Wood coal is as one word, "Drywood." For uniformity and to avoid confusion, the spelling in this report will be as two words, "Dry Wood."] Except for the 4.0 percent average higher content of sulfur in the Rowe coal from Kansas, there are essentially no differences in the above parameters for this coal from the 2 states. As shown in Table 10, the sulfur in the Rowe coal from both states is mostly pyritic. Of the 4.0 percent greater amount of sulfur in the Rowe coal from Kansas, 3.6 percent is pyritic sulfur.
Table 9—Average proximate and ultimate analyses, and heats of combustion for the Rowe and Dry Wood coals from Kansas and Missouri on an as-received basis. [Note: Missouri Rowe and Dry Wood values were averaged from 3 samples for each coal, from data taken from Wedge and Hatch, 1980; Kansas Rowe values were averaged from 3 samples (R-1, 2, and 3), and Kansas Dry Wood values were averaged from 2 samples (D-2 and D-3); sample D-1 was from a weathered zone.]
| Coal | Proximate Analysis (%) | Ultimate Analysis (%) | Heat of Combustion | ||||||||
|---|---|---|---|---|---|---|---|---|---|---|---|
| Moisture | Volatile Matter |
Fixed Carbon |
Ash | Hydrogen | Carbon | Nitrogen | Oxygen | Sulfur | Kcal/kg | Btu/lb | |
| Rowe | |||||||||||
| Kansas | 2.3 | 33.9 | 45.1 | 18.0 | 4.6 | 61.0 | 1.0 | 5.6 | 9.7 | 6,373 | 11,473 |
| Missouri | 2.4 | 33.2 | 46.1 | 18.3 | 4.7 | 64.3 | 1.1 | 5.9 | 5.7 | 6,560 | 11,810 |
| Dry Wood | |||||||||||
| Kansas | 3.1 | 30.0 | 41.3 | 25.5 | 4.1 | 54.3 | .9 | 4.8 | 10.3 | 5,725 | 10,310 |
| Missouri | 2.3 | 33.3 | 49.3 | 15.1 | 4.8 | 67.3 | 1.1 | 6.4 | 5.3 | 6,847 | 12,323 |
Compared to the Dry Wood coal from Missouri, the Kansas Dry Wood contains an average 10 percent more ash and 13 percent less carbon. The higher ash content results in a lower average heat value of 2,013 Btu/lb for the Kansas Dry Wood coal. The average sulfur content of the Dry Wood coal from Kansas is 5.0 percent more than that of the Missouri Dry Wood. As calculated from the forms of sulfur given in Table 10, 3.0 percent of this greater amount is pyritic sulfur. This is because the Kansas Dry Wood coal has a high organic-sulfur content.
Table 10—Average air-dried loss,forms of sulfur, free swelling index, and ash fusion temperatures for the Rowe and Dry Wood coals from Kansas and Missouri on as as-received basis. [Note: Missouri Rowe and Dry Wood values were averaged from 3 samples for each coal from data taken from Wedge and Hatch, 1980; Kansas Rowe values were averaged from 3 samples (R-1, 2, and 3), and Kansas Dry Wood values were averaged from 2 samples (D-2 and D-3); sample D-1 was from a weathered zone.]
| Coal | Air-dried loss (%) |
Forms of Sulfur (%) | Free Swelling Index |
Ash Fusion-Temperature, °C | ||||
|---|---|---|---|---|---|---|---|---|
| Sulfate | Pyritic | Organic | Initial Deformation |
Softening | Fluid | |||
| Rowe | ||||||||
| Kansas | 1.0 | .70 | 8.11 | .93 | 8.3 | 1,252 | 1,308 | 1,363 |
| Missouri | 1.0 | .29 | 4.46 | .91 | 7.7 | 1,273 | 1,343 | 1,400 |
| Dry Wood | ||||||||
| Kansas | .8 | .72 | 7.42 | 2.18 | 6.2 | 1,122 | 1,170 | 1,220 |
| Missouri | .7 | .27 | 4.37 | .66 | 7.8 | 1,202 | 1,250 | 1,293 |
The average elemental compositions of the Rowe and Dry Wood coals from the mine site and Missouri are compared in Table 11. The Rowe coal from Kansas averages more iron, manganese, arsenic, lead, strontium, and zinc than the Missouri Rowe. However, the Rowe coal from Missouri contains more cobalt, lithium, molybdenum, selenium, uranium, vanadium, and zircon.
The Dry Wood coal from Kansas averages more calcium, iron, manganese, arsenic, cadmium, cobalt, copper, gallium, mercury, lanthanum, neodymium, nickel, lead, strontium, yttrium, and zinc than the Missouri Dry Wood. The Dry Wood coal from Missouri does, however, contain more boron and selenium.
Table 11—Average major, minor, and trace-element composition of the Rowe and Dry Wood coals from Kansas and Missouri.a,b
| Coal | Si % |
Al % |
Ca % |
Mg % |
Na % |
K % |
Fe % |
Ti % |
Cl % |
Mn ppm |
P ppm |
Ag ppm |
As ppm |
B ppm |
|---|---|---|---|---|---|---|---|---|---|---|---|---|---|---|
| Rowe | ||||||||||||||
| Kansas | 1.9 | 1.1 | .088 | .042 | .020 | .13 | 6.2 | .055 | .034 | 75 | 371 | 0c | 35 | 19 |
| Missouri | 3.2 | 1.7 | .12 | .066 | .024 | .29 | 3.1 | .094 | ---d | 38 | --- | .1 | 16 | 17 |
| Dry Wood | ||||||||||||||
| Kansas | 3.3 | 2.0 | .53 | .064 | .017 | .22 | 6.1 | .064 | .053 | 102 | 585 | .2 | 29 | 5 |
| Missouri | 2.5 | 1.2 | .064 | .051 | .015 | .21 | 3.1 | .070 | --- | 27 | --- | .1 | 10 | 15 |
| Coal | Ba ppm |
Be ppm |
Cd ppm |
Ce ppm |
Co ppm |
Cr ppm |
Cu ppm |
F ppm |
Ga ppm |
Ge ppm |
Hg ppm |
La ppm |
Li ppm |
Mo ppm |
| Rowe | ||||||||||||||
| Kansas | 39 | 2.5 | <.19 | 0 | 9 | 13 | 38 | 42 | 4 | 12 | .18 | 0 | 15 | 0 |
| Missouri | 35 | 2 | <.18 | --- | 12 | 19 | 30 | 49 | 8 | 10 | .14 | <9 | 28 | 5 |
| Dry Wood | ||||||||||||||
| Kansas | 31 | 1.7 | 87 | 0 | 47 | 16 | 58 | 70 | 21 | 5 | .53 | 19 | 11 | 0 |
| Missouri | 28 | 1 .5 | <.15 | 0 | 15 | 15 | 16 | 80 | 7 | 6 | .13 | 2 | 13 | 0 |
| Coal | Nb ppm |
Nd ppm |
Ni ppm |
Pb ppm |
Sb ppm |
Sc ppm |
Se ppm |
Sr ppm |
Th ppm |
U ppm |
V ppm |
Y ppm |
Yb ppm |
|
| Rowe | ||||||||||||||
| Kansas | 0 | --- | 37 | 184 | .7 | 2 | 3.0 | 45 | <3.0 | .8 | 22 | 12 | 0 | |
| Missouri | 2 | --- | 45 | 60 | .8 | 4 | 8.2 | 20 | <3.0 | 8.0 | 35 | 9 | 1 | |
| Dry Wood | ||||||||||||||
| Kansas | 0 | 21 | 101 | 96 | 1.6 | 4 | 3.7 | 64 | <3.0 | 1.6 | 31 | 55 | 3 | |
| Missouri | 1 .5 | 0 | 40 | 32 | .4 | 4 | 6.4 | 20 | <3.0 | 1.2 | 32 | 7 | .5 | |
| Coal | Zn ppm |
Zr ppm |
||||||||||||
| Rowe | ||||||||||||||
| Kansas | 65 | 14 | ||||||||||||
| Missouri | 19 | 20 | ||||||||||||
| Dry Wood | ||||||||||||||
| Kansas | 28,151 | 18 | ||||||||||||
| Missouri | 16 | 19 | ||||||||||||
| (a) As, F, Hg, Sb, Se, Th, and U are from direct determinations on oven-dried (32°C) coal <80 mesh); other values calculated from analyses of ash. (b) Missouri Rowe and Dry Wood values were averaged from 4 samples for each coal from data taken from Wedge and Hatch, 1980; Rowe values were averaged from 3 samples (R-1, 2, and 3), Kansas Dry Wood values were averaged from 2 samples (D-2 and D-3); sample D-1 was from a weathered zone. (c) None detected. (d) Not determined. |
||||||||||||||
Summary
The Rowe and Dry Wood coals from the mine site were ranked as high-volatile A, bituminous coals. The average ash content of 25.5 percent for the Dry Wood coal is greater than the 18.0 percent for the Rowe coal and both values are higher than the 13.7 percent average of southeastern Kansas coal. As a result these 2 coals have lower average heats of combustion than the average southeastern Kansas coal. The average amounts of total sulfur in the Rowe and Dry Wood coals are 2.4 and 2.6 times higher than the 4.0 percent average of southeastern Kansas coal. Most of the sulfur is pyritic. In the Rowe coal 83.6 percent of the sulfur is pyritic and in the Dry Wood coal 72.1 percent is pyritic. Compared to the Rowe coal, the Dry Wood coal contains higher amounts of 31 of the 43 elements analyzed. Of these 31 elements, those showing significantly higher amounts are calcium, manganese, phosphorus, cadmium, cobalt, copper, fluoride, gallium, mercury, lanthanum, nickel, strontium, and zinc. Of the 8 elements that have higher concentrations in the Rowe coal, only 3—boron, germanium, and lead—show significantly higher amounts. Trace elements markedly enriched in the Rowe coal (on an average basis) in relation to their crustal abundance are arsenic, lead, and selenium. In addition to being markedly enriched in arsenic and selenium, the Dry Wood coal is also markedly enriched in cadmium and zinc. All the above-mentioned trace elements are potentially hazardous in varying degrees to human health and the environment. The extremely high amounts of cadmium and zinc in the Dry Wood coal seem to be related to sphalerite mineralization in the Tri-State Mining District.
The average ash content of 25.5 percent for the Dry Wood coal from Kansas is twice the 12.6 percent average of Interior Province coal. The average carbon content of the Kansas Dry Wood is 10.9 percent less than the Province average. As a result the Kansas Dry Wood has a lower average heat of combustion than Interior Province coal. Both the Rowe and Dry Wood coals contain more average total sulfur than Interior Province coal by 5.8 and 6.4 percent respectively and their average pyritic sulfur contents are both 3 times the Province average. Both the Rowe and Dry Wood coals average more iron, copper, mercury, nickel, and lead than Interior Province coal. Additionally, the Dry Wood coal also contains more silicon, aluminum, potassium, titanium, cadmium, cobalt, gallium, strontium, vanadium, yttrium, ytterbium, and zinc. Comparisons of reported average enrichment values of elements in Interior Province coal based on crustal abundance and those calculated for the Rowe and Dry Wood coals at the mine site show the Rowe coal is more enriched in arsenic, mercury, and lead by factors of 2.9, 1.8, and 9.8, respectively. The Dry Wood coal is more enriched in arsenic, mercury, lead, and antimony by factors of 2.4, 5.5, 5, and 2, respectively.
Compared to the Rowe coal from Missouri on an average basis, the Kansas Rowe contains 4.0 percent more sulfur, of which 3.6 is pyritic sulfur, and more iron, manganese, arsenic, lead, strontium, and zinc. The Missouri Rowe contains more cobalt, lithium, molybdenum, selenium, uranium, vanadium, and zircon. The Dry Wood coal from Kansas averages 10 percent more ash, 13 percent less carbon, 5 percent more sulfur, and more calcium, iron, manganese, arsenic, cadmium, cobalt, copper, gallium, mercury, lanthanum, neodymium, nickel, lead, strontium, yttrium, and zinc than the Missouri Dry Wood. However, the Missouri Dry Wood contains more boron and selenium.
Prev Page—Geology || Next Page—Soil
Kansas Geological Survey, Geology
Placed on web Oct. 25, 2018; originally published 1982.
Comments to webadmin@kgs.ku.edu
The URL for this page is http://www.kgs.ku.edu/Publications/Bulletins/MRS7/04_coal.html