![]()
Prev Page—Introduction || Next Page—Coal
Geology
by L. L. Brady, W. W. Hambleton, and D. A. Grisafe
Introduction
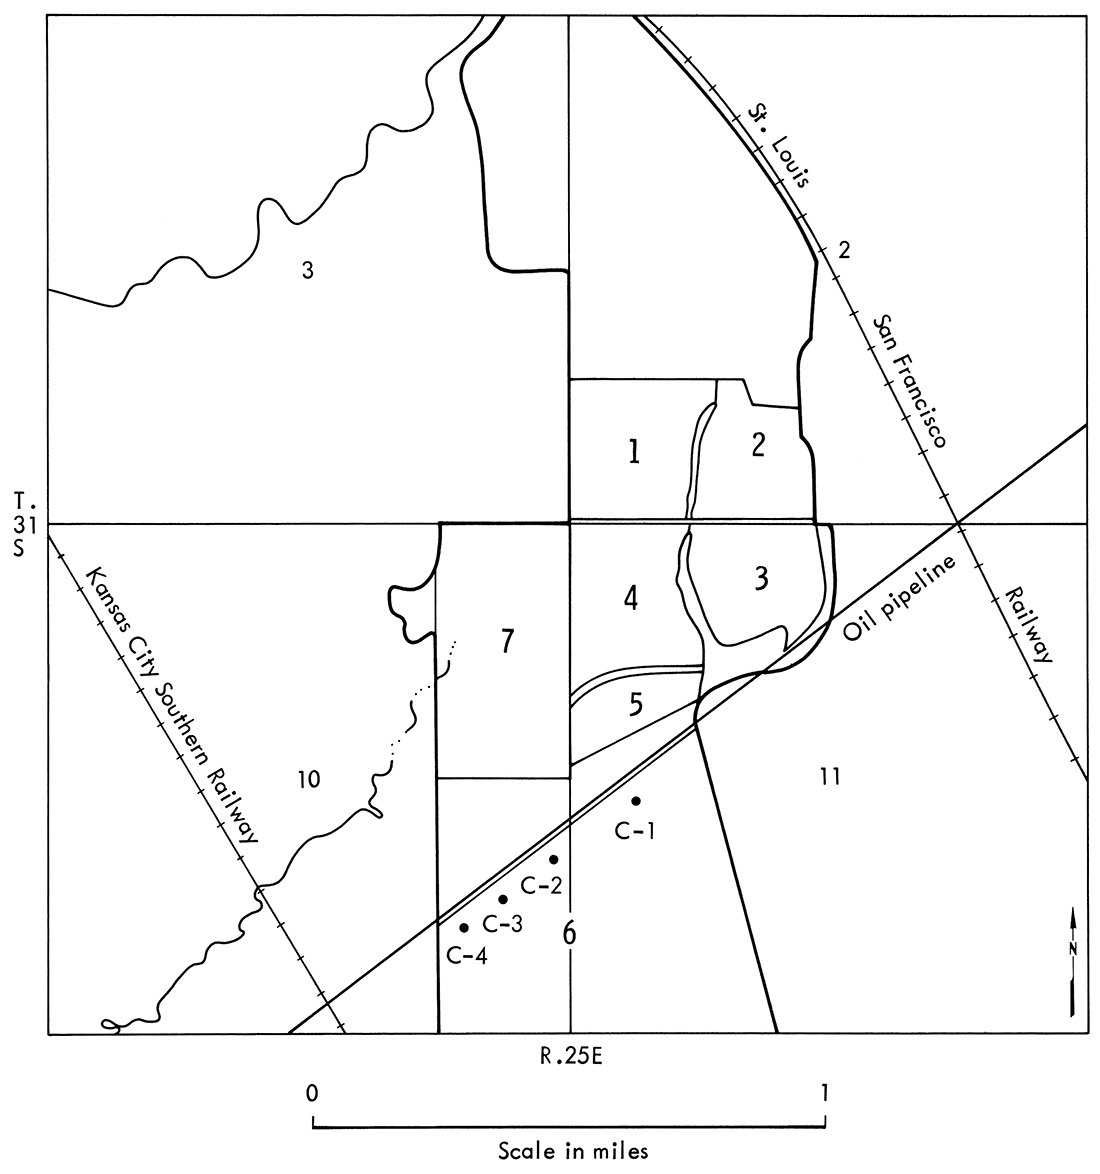
The geology of the unmined area was determined from 3 sources. In August 1975, the Kansas Geological Survey bored 4 nearly complete 4-inch cores in the southern unmined area (Field 6), located south of the Texaco-Cities Service oil pipeline. In addition, drill records for 109 borings that covered the entire unmined area were provided by the Clemens Coal Company. Also, at the time mining commenced south of the oil pipeline, stratigraphic sections were described from the mine highwall. These stratigraphic sections coincided approximately with the location of the Kansas Geological Survey boreholes.
Experimental Procedures
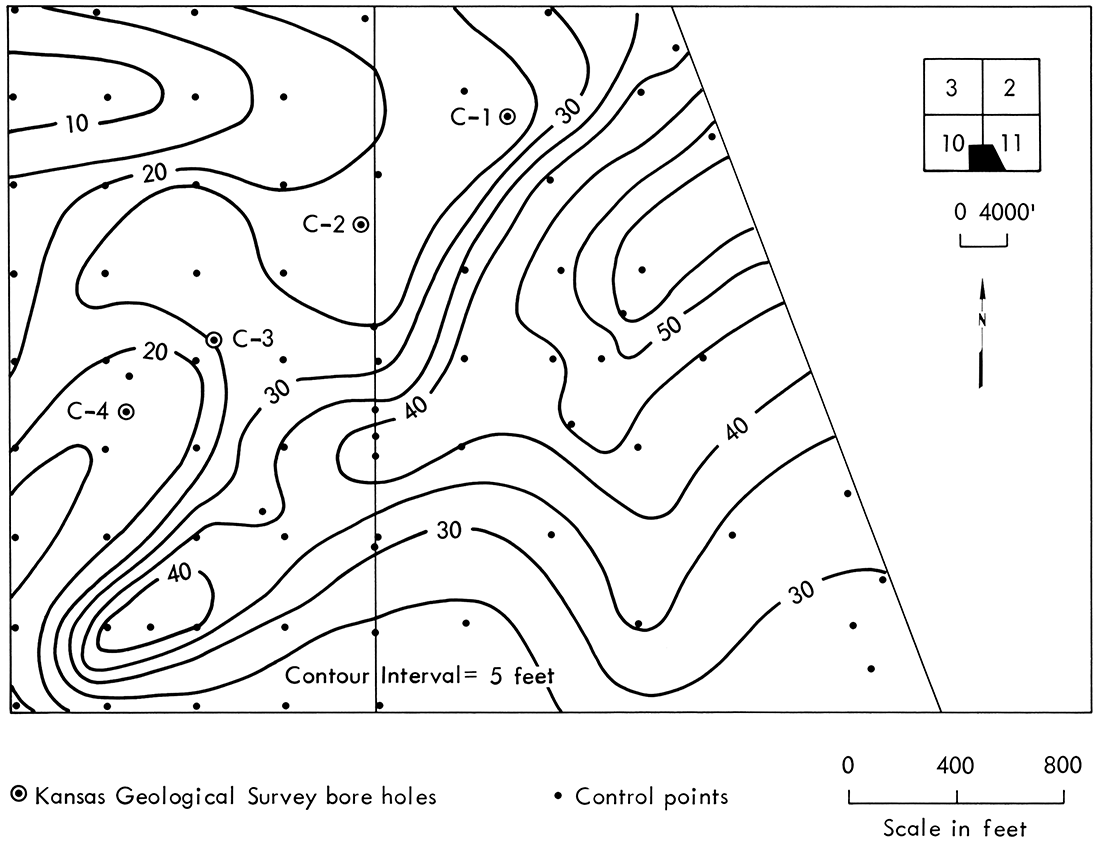
Borings of the soil and rock overlying the coal beds were drilled by the Kansas Geological Survey with a 4-inch-diameter core barrel with a carbide-tipped bit. Locations of the boreholes are shown in Figure 3 with descriptions given in Appendix A. The entire length of rock core C-2 was sawed to obtain a quarter section for mineralogical and chemical analysis. This section was divided into 11 units, based upon identifiable stratigraphic change. Samples of these units were dried, pulverized to a fine powder in a pan mill, and further crushed using an alumina mortar and pestle. The resulting powder was screened through a 200-mesh (75 micron) sieve and pressed into pellets on a Carver press at 10,000 psi. The mineralogy of the pellets was then analyzed with a Norelco x-ray diffractometer using CuKα radiation and a single-crystal monochromator.
Figure 3—Map of location of rock-core sampling sites.
Elemental composition of the pellets was determined by x-ray fluorescence spectrometry. A scan of the spectra was recorded and the peak height of the strongest line of each element in a sample was measured. The concentration of each element was determined from a standard curve prepared from the scans of a multi-element standard diluted to different concentrations with silica. Values of copper, zinc, nickel, rUbidium, strontium, barium, and zirconium were corrected for matrix effects using scattered radiation as an internal standard.
Stratigraphy and Structure
The rock units of the mine site consist of shale, siltstone, sandstone, coal, underclay, and several thin beds of clay-ironstone nodules of the Krebs Formation, Cherokee Group, which is the lowest major division of the Desmoinesian Stage of the Middle Pennsylvanian Series. A composite section (Fig. 4) that was measured along the highwall of the mine (NE, SE, SE, Sec. 10, T. 31 S., R. 25 E.) is representative of the general stratigraphy of the mine site. Additional stratigraphic information was derived from the 4 bore holes drilled by the Kansas Geological Survey prior to mining.
Figure 4—Composite stratigraphic section at mine highwall, NE, SE, SE, Sec. 10, T. 31 S., R. 25 E., March 23, 1976.
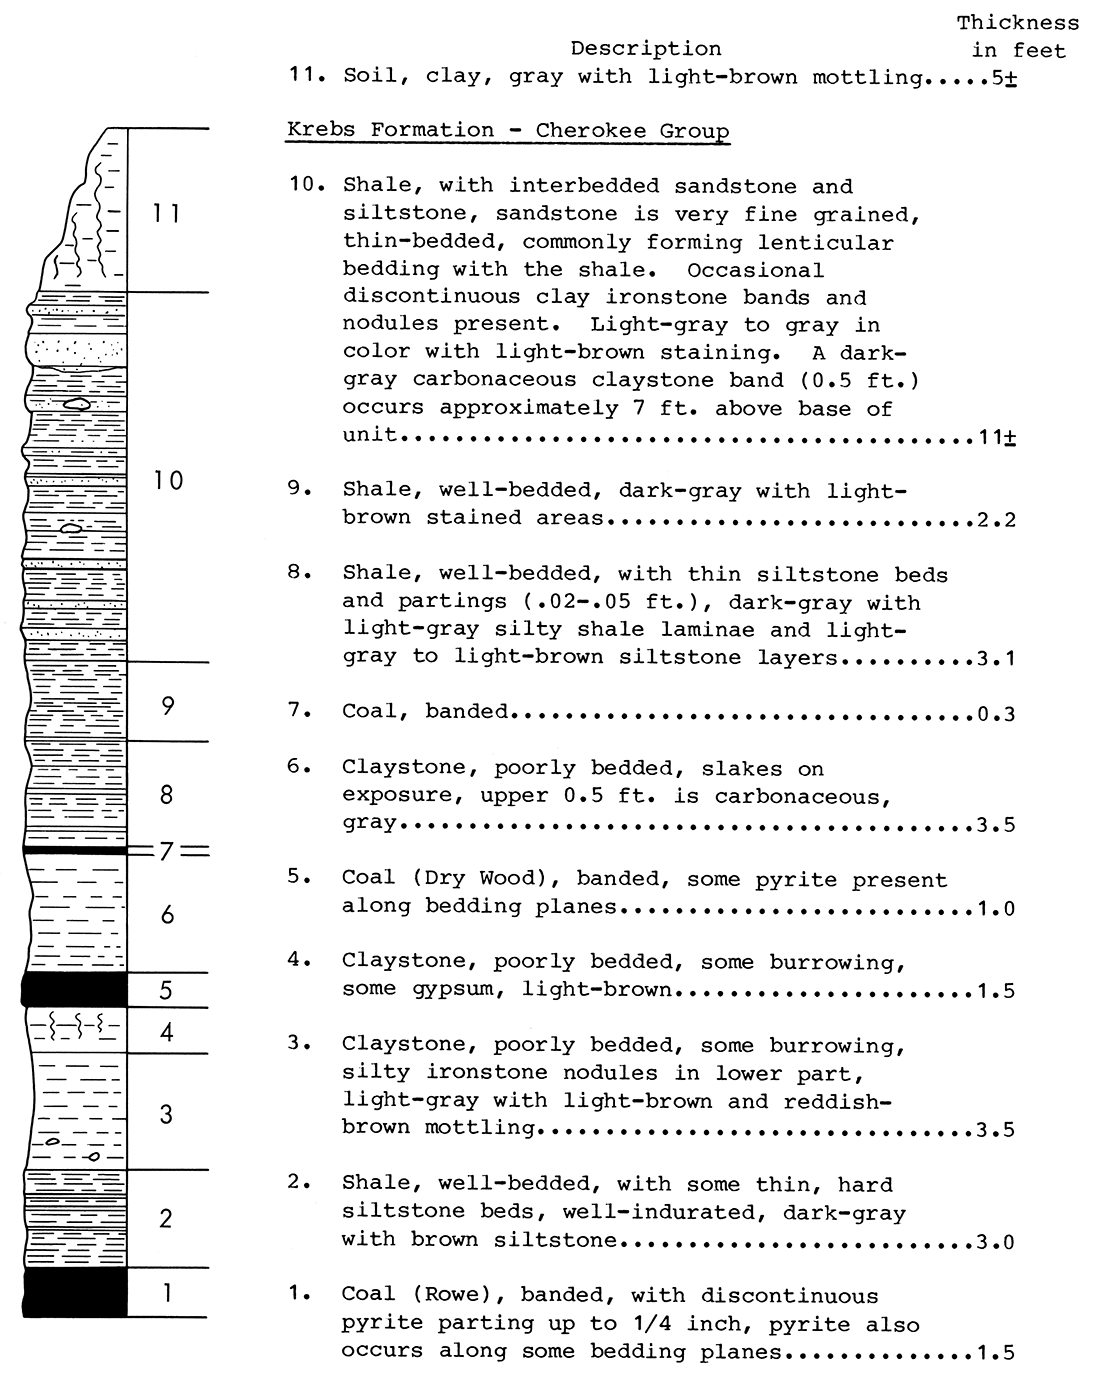
The lowermost unit shown on the composite section is the Rowe coal, which ranges in thickness from 14 to 18 inches. The coal is banded and contains pyrite and gypsum along cleats and bedding planes. Strata beneath the Rowe coal, as interpreted from the deepest core (core C-4), include at least 8 feet of dark-gray shale, as well as a thin siltstone. The shale contains light-brown nodules, which also occur in the form of thin clay-ironstone bands, 0.3 to 1.4 cm wide. The upper 1.5 feet of the shale unit contain interbedded thin laminae of siltstone, 0.1 to 0.5 cm wide. Overlying the shale unit and grading downward is a light-gray, well-consolidated siltstone that is present in all the cores. The siltstone is extensively burrowed, and contains abundant carbonaceous material.
Strata between the Rowe coal and overlying Dry Wood coal consist mostly of shale and underclay beds. This interval ranges from 6 to 9 feet in thickness. The shale is finely laminated, very carbonaceous, and contains light-brown clay-ironstone lenses, 1 to 3 cm wide. Color of the shale interval grades from dark-gray to black in the lower part to a brownish-gray in the upper part. The lighter-colored shale contains irregular laminae, with burrowing evident. The underclay below the Dry Wood coal ranges from 1.5 to 3 feet in thickness. It is poorly consolidated, and slakes extensively when exposed. The Dry Wood coal ranges in thickness from 0.25 to 1.25 feet, is banded, and has some pyrite along bedding planes.
Above the Dry Wood coal is a dark-gray, poorly bedded carbonaceous shale that is several feet thick. In some places, a thin coal is found above this shale. Locally this coal is known as the "Pilot coal." Above this coal is a dark-gray silty shale with interbedded light-gray shale and very finely laminated siltstone.
The upper part of the shale interval also contains interbedded sandstone that is very fine grained and light-brown in color. Evidence of burrowing is present, as are a number of iron-rich zones. This sandstone is considered to be equivalent to the Bluejacket Sandstone, which can be traced over a wide area of southeastern Kansas. In an evaluation of the Bluejacket Sandstone for heavy-oil potential, Ebanks and others (1977) recognized the presence of 2 distinct intervals of sandstone occurrence and referred to these sandstone intervals as the upper and lower Bluejacket Sandstone intervals. Based on their work, the Bluejacket Sandstone that is present in the cores, and was observed in the mine highwall, would be equivalent to the lower Bluejacket Sandstone.
Where the "pilot coal" is thin or absent, the Bluejacket Sandstone is thick, suggesting a pre-Bluejacket erosional surface. A light-brown, finely laminated shale lies above the Bluejacket Sandstone, and lenticular laminae of light-gray, fine-grained sandstone are interbedded within the shale. Burrows and iron oxide nodules also are present within the shale.
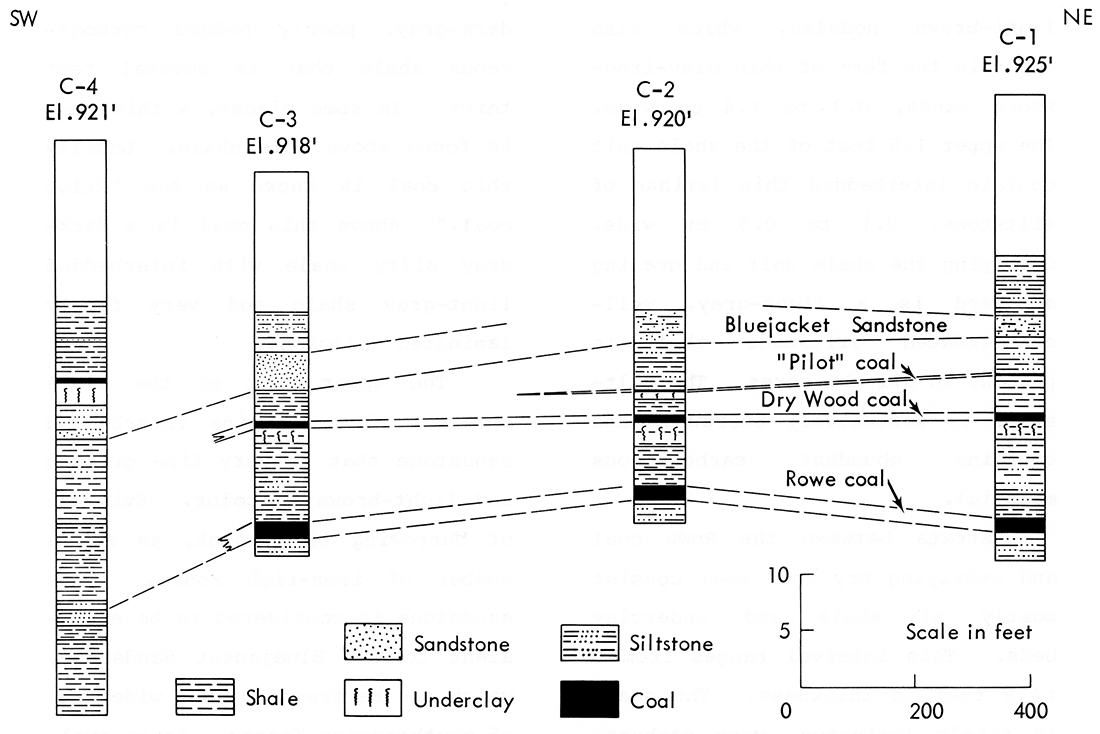
A cross section drawn from the 4 boreholes is shown in Figure 5. The lithologic descriptions of rock cores C-1 and C-2 (Appendix A) resemble the composite stratigraphic section of Figure 4. An appreciable thickening of the interval between the Rowe and Dry Wood coals to the east is noticeable. Rock core C-3 exhibits the thickening of the Bluejacket· Sandstone and the disappearance of the "Pilot coal" as mentioned earlier. All 3 coals are missing from rock core C-4, and stratigraphic correlation with the other 3 cores is somewhat difficult. The base of the sandy unit is considered to be stratigraphically equivalent to the base of the Bluejacket Sandstone. Because a siltstone is present beneath the Rowe coal in the other 3 cores, the appearance of a similar siltstone in core C-4 is considered to be in position below the missing Rowe coal.
Figure 5—Cross section of stratigraphy along the line of rock cores at the mine site (northeast to southwest).
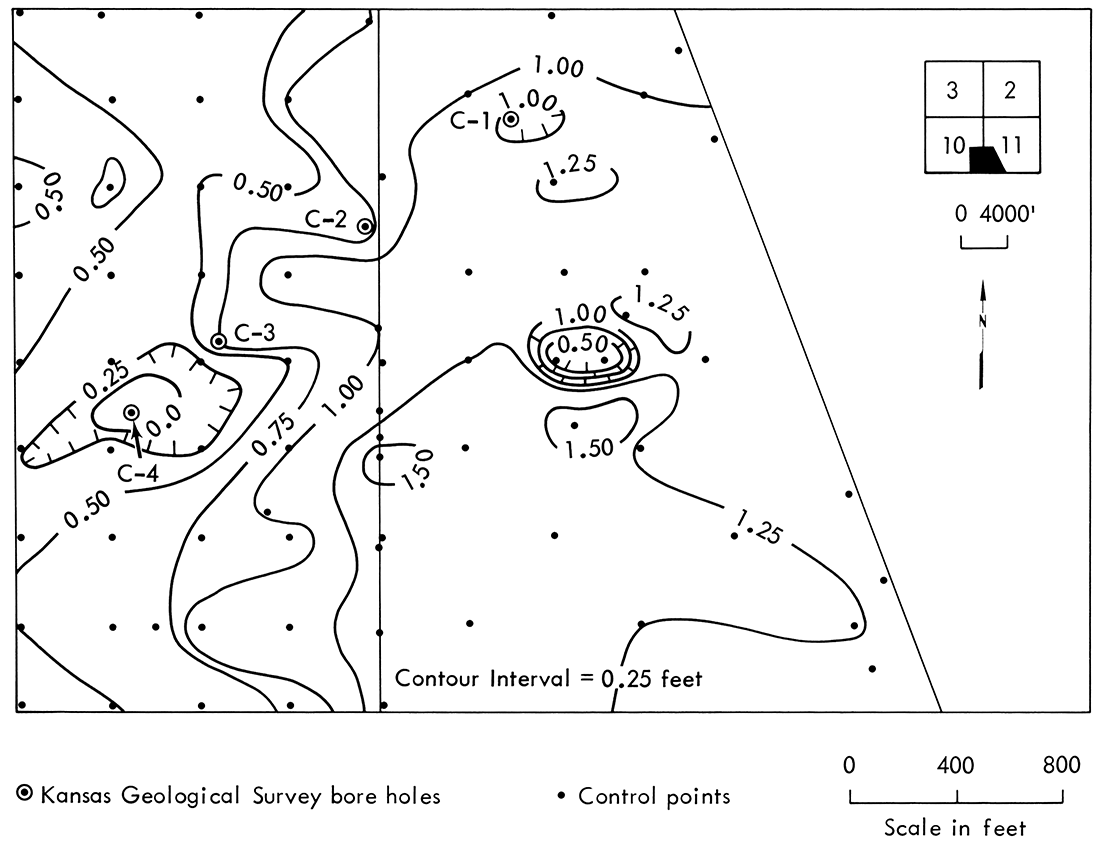
The structural and stratigraphic relations are further illustrated by Clemens Coal Company drill records. These records and the Kansas Geological Survey boreholes were used to construct isopach maps of the thickness of the Rowe and Dry Wood coals, shown in Figures 6A and 6B respectively. The Rowe coal, where present, ranges in thickness from 0.85 to 1.85 feet, as shown by Clemens Coal Company data. However, Kansas Geological Survey borehole data show the Rowe coal is absent in the west-central section of the mine site. The Rowe coal is thickest to the southeast and thins slightly to the west. Circular depressions and ridges represent the typical small rolls that occur in the coal beds in southeastern Kansas. A karst surface on older Mississippian rocks may be responsible, in part, for the typical circular depressions. The Dry Wood coal ranges in thickness from 0.25 to 1.25 feet, and also thins toward the west, according to Clemens Coal Company drill records. However, Kansas Geological Survey borehole data also show the Dry Wood coal to be absent in the west-central section of the mine site.
Figure 6A—Map of the thickness of the Rowe coal, E2, SE, Sec. 10 and W2, SW, Sec. 11, T. 31 S., R. 25 E. Data from Clemens Coal Company drilling records.
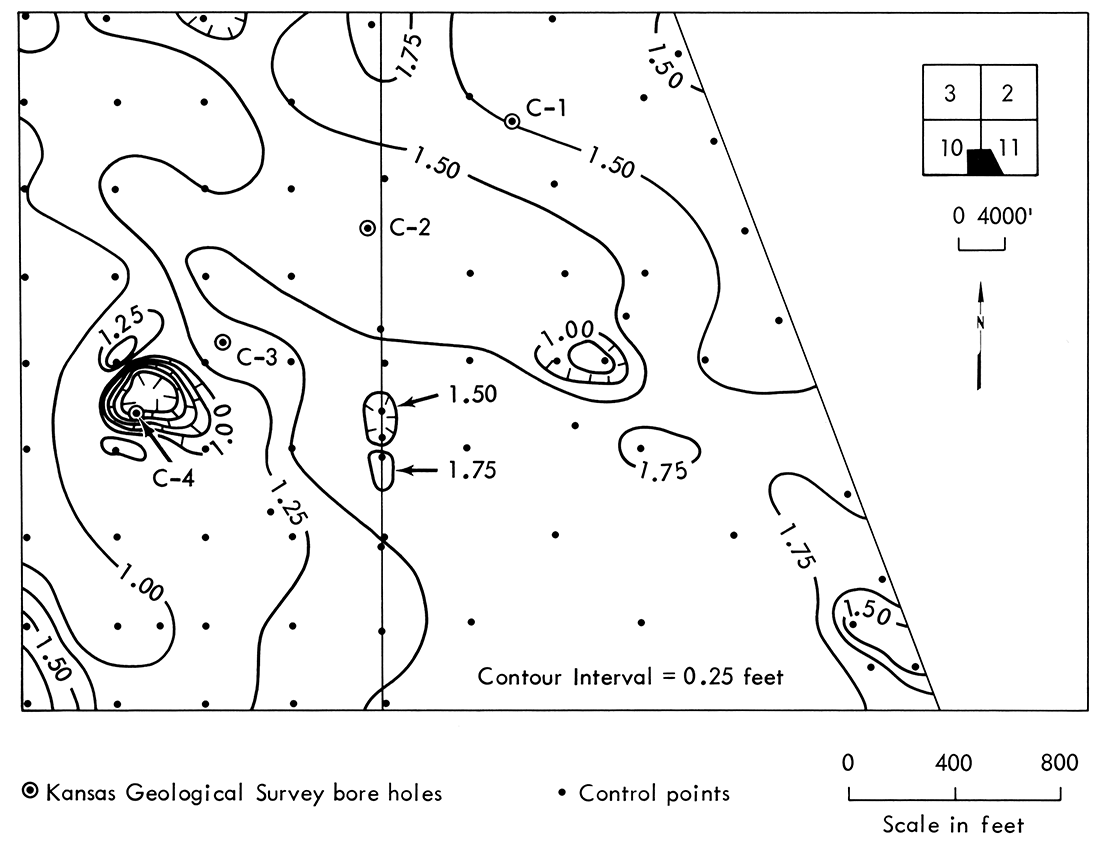
Figure 6B—Map of the thickness of the Dry wood coal, E2, SE, Sec. 10 and W2, SW, Sec. 11, T. 31 S., R. 25 E. Data from Clemens Coal Company drilling records.
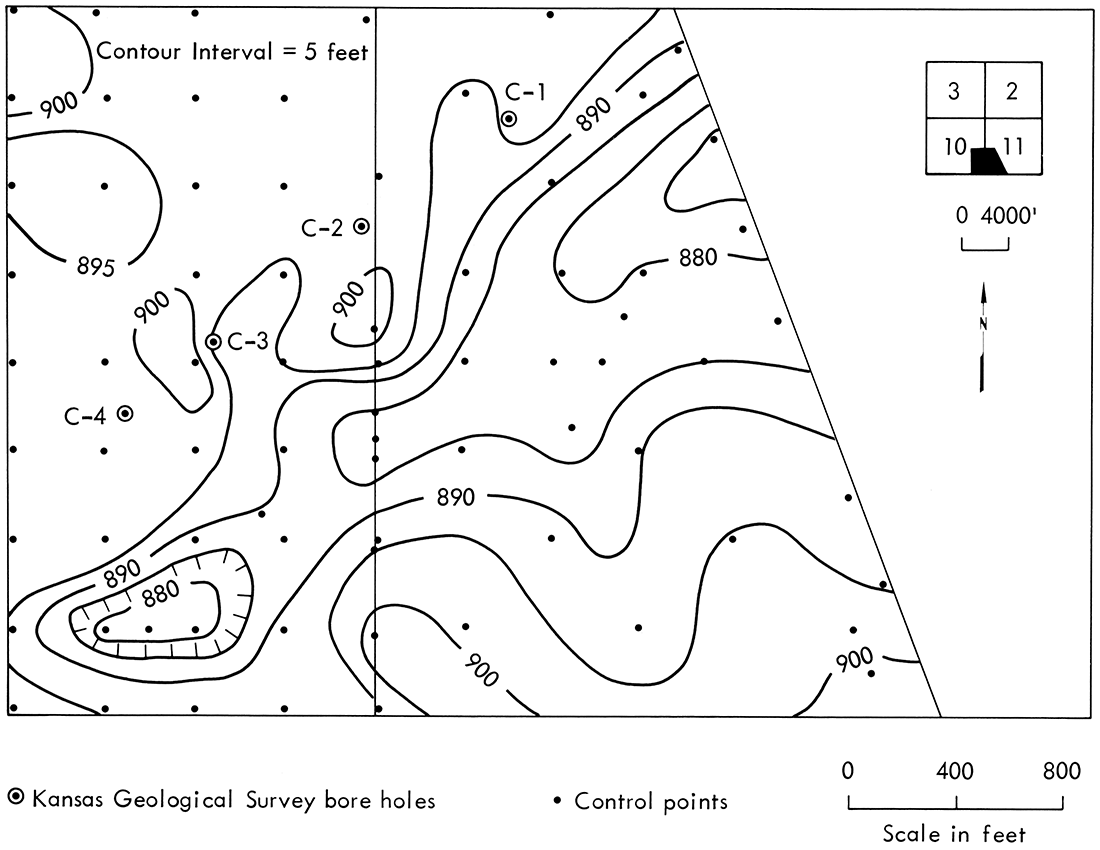
Structure maps were drawn of the top of the Rowe and Dry Wood coals and these are shown in Figures 7A and 7B respectively. Elevation of the Rowe coal ranged from 870 to 890 feet above mean sea level; the Dry Wood coal ranged in elevation from 870 to 900 feet. The most prominent feature on both structure maps is a southwesterly trending trough or syncline across the area. There is suggestion that the syncline also plunges to the northeast.
Figure 7A—Structure map of the top of the Rowe coal, E2, SE, Sec. 10 and W2, SW, Sec. 11, T. 31 S., R. 25 E. Data from Clemens Coal Company drilling records.
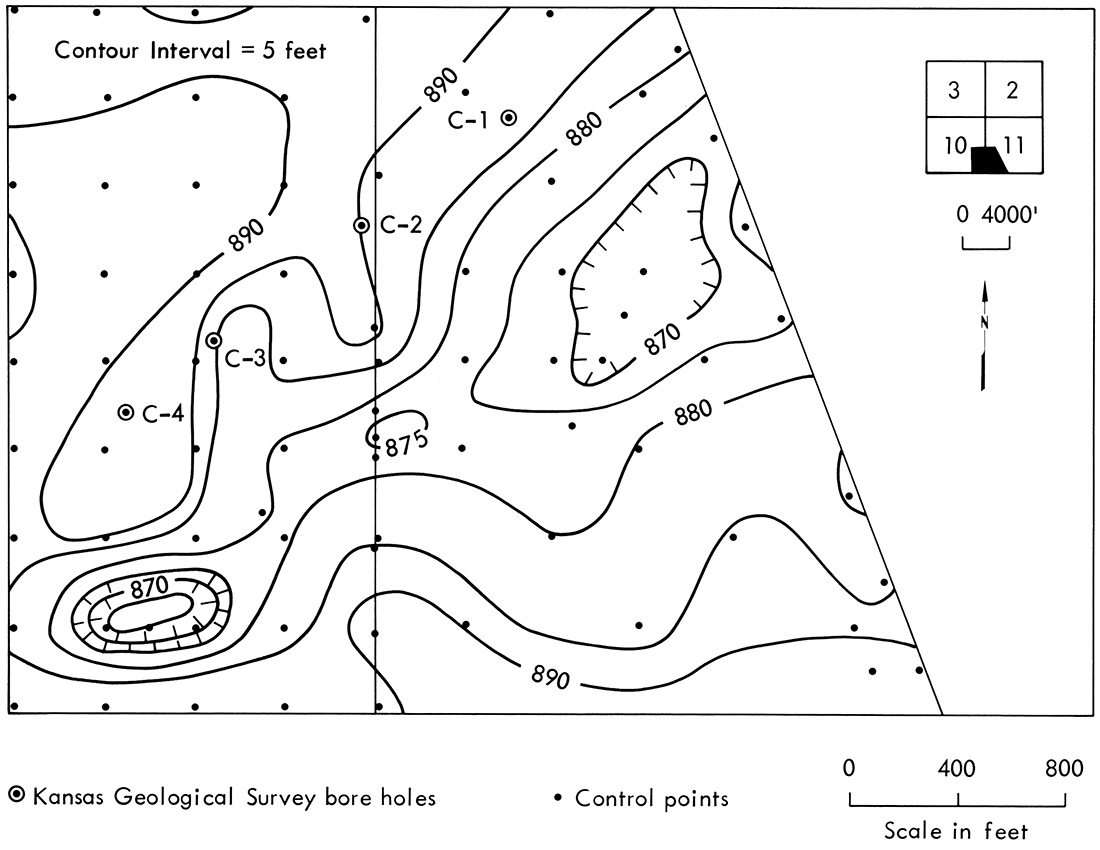
Figure 7B—Structure map of the top of the Dry Wood coal, E2, SE, Sec. 10 and W2, SW, Sec. 11, T. 31 S., R. 25 E. Data from Clemens Coal Company drilling records.
Overburden thickness maps for the Rowe and Dry Wood coals are shown in Figures 8A and 8B respectively. Overburden thickness for the Rowe coal ranges from 20 feet in the northwest to 65 feet in the east-central section of the mine site. The Dry Wood has a minimum overburden thickness of 10 feet and a maximum of 55 feet. Overburden thicknesses are greatest in the synclinal areas. As a result, the deeper parts of the syncline have not been mined because the increased overburden thickness makes mining uneconomical.
Figure 8A—Map of the thickness of overburden above the Rowe coal, E2, SE, Sec. 10 and W2, SW, Sec. 11, T. 31 S., R. 25 E. Data from Clemens Coal Company drilling records.
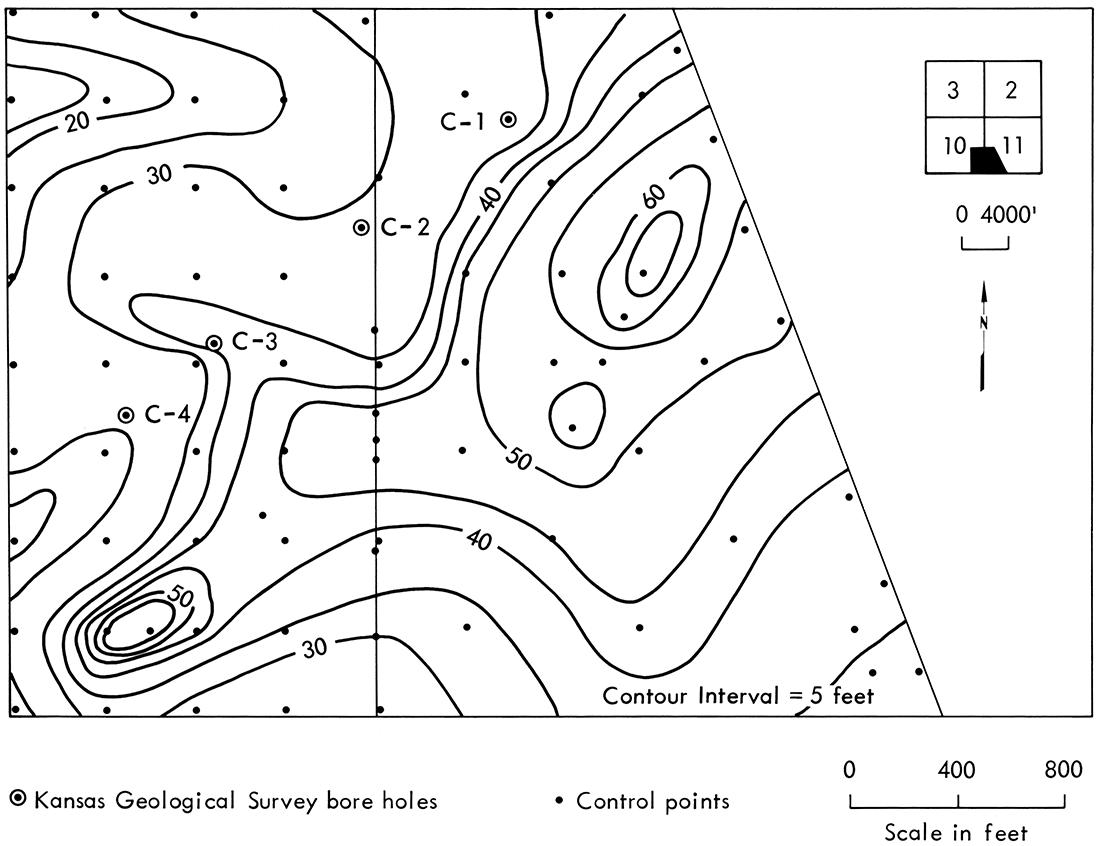
Figure 8B—Map of the thickness of overburden above the Dry Wood coal, E2, SE, Sec. 10 and W2, SW, Sec. 11, T. 31 S., R. 25 E. Data from Clemens Coal Company drilling records.
Mineralogy and Chemistry
Mineralogical and chemical characterizations of the rock units were determined from samples of rock core C-2, which were subjected to x-ray diffraction and x-ray fluorescence analyses.
X-ray diffraction analysis of rock core C-2 from 15 to 35 feet (Table 1) indicates the rock units consist predominantly of quartz, feldspar, and clay. Many of the rock units contain small amounts of calcite, iron oxides, and pyrite. For purposes of this study, only clay-mineral groups are distinguished. Any clay giving a 7Å basal reflection is assumed to be kaolinite; a 10Å reflection, illite; and a 14Å reflection, montmorillonite. All rock units were found to contain kaolinite and illite. Also, an appreciable amount of montmorillonite was found in some of the rock units.
Table 1—Major line intensities of principal minerals from x-ray diffraction analysis of rock core C-2.a
| Depth (feet) |
Q | F | M | I | K | Q+F | M+I+K | Q+F / M+I+K | Lithology |
|---|---|---|---|---|---|---|---|---|---|
| 15-18 | 78 | 35 | 12 | 56 | 53 | 113 | 121 | 0.93 | Siltstone |
| 18-19.8 | 49 | 20 | 10 | 61 | 55 | 69 | 126 | 0.55 | Shale |
| 19.8-22.3 | 38 | 12 | 10 | 61 | 68 | 50 | 139 | 0.36 | Shale |
| 22.3-22.5 | "Pilot coal" | ||||||||
| 22.5-22.7 | 72 | 17 | 0 | 71 | 48 | 89 | 119 | 0.75 | Silty—Non-slaking "underclay" |
| 22.7-24.6 | 48 | 12 | 0 | 60 | 71 | 60 | 131 | 0.46 | Slakable underclay |
| 24.6-25.3 | Dry Wood coal | ||||||||
| 25.3-27.6 | 37 | 10 | 0 | 46 | 78 | 47 | 124 | 0.38 | Slakable underclay |
| 27.6-28.8 | 39 | 7 | 9 | 52 | 75 | 46 | 136 | 0.34 | Shale |
| 28.8-29.7 | 46 | 10 | 13 | 65 | 87 | 56 | 165 | 0.34 | Shale |
| 29.7-31.3 | 47 | 8 | 8 | 55 | 62 | 55 | 125 | 0.44 | Shale |
| 31.3-32.5 | Rowe coal | ||||||||
| 32.5-32.7 | 35 | 10 | 0 | 10 | 44 | 45 | 54 | 0.83 | Silty-slaking "underclay" |
| 32.7-34.7 | 86 | 12 | 0 | 39 | 42 | 98 | 81 | 1.21 | Siltstone |
| (a) Non-plastic minerals: Q = Quartz, F = Feldspar. Plastic minerals: M = Montmorillonite, I = Illite, and K = Kaolinite |
|||||||||
Initial visual inspection of rock core C-2 led to classification of most units as clay and shale. Observations supported by x-ray diffraction analysis suggest that some of the units are more properly categorized as siltstone. Units containing the most non-plastic minerals (quartz and feldspar) as compared with plastic minerals (kaolinite, illite, and montmorillonite) were determined by measuring major diffraction-line intensities. Table 1 lists the measured line intensities and the ratio of non-plastic to plastic minerals. These ratios in turn were used to identify silty material or siltstone for the lithology column. Although these characterizations are somewhat uncertain because of the range in crystallinity and particle size of the clay minerals, the ratios are useful in showing the error in referring to a unit below a coal seam as "underclay" when such a unit may be quite silty and may be a siltstone. The silty "underclay" found immediately below the "Pilot" and Rowe coals is a good example of this.
The results of the x-ray fluorescence analysis of rock core C-2 from 15 to 35 feet are shown in Table 2. All elements show a wide range in concentration except titanium, which is relatively constant with depth. Rock units 1, 3, 7, and 9 are highest in manganese (expressed as MnO), with the largest values found above the "Pilot" and Rowe coals. By contrast, the lowest manganese value is found above the Dry Wood coal. In general, the samples found to be high in manganese were also found to have a relatively high iron content (expressed as Fe2O3).
Table 2—Semiquantitative analysis of trace elements of rock core C-2 by x-ray fluorescence spectrometry. ppm is parts per million (µg/g). BD is Below Detection Limit.
| Depth (feet) |
Sample No. |
Fe2O3 % |
MnO % |
TiO2 % |
Cu ppm |
Zn ppm |
Ni ppm |
Rb ppm |
Sr ppm |
Ba ppm |
Zr ppm |
|---|---|---|---|---|---|---|---|---|---|---|---|
| 15-18 | 1 | 8.3 | 0.17 | 0.9 | BD | 240 | 80 | 60 | 110 | 400 | 360 |
| 18-19.8 | 2 | 6.5 | 0.04 | 1.0 | BD | 70 | 70 | 100 | 140 | 200 | 360 |
| 19.8-22.3 | 3 | 7.8 | 0.29 | 1.0 | 60 | 100 | 80 | 100 | 100 | 400 | 240 |
| 22.3-22.5 | "Pilot coal" | ||||||||||
| 22.5-22.7 | 4 | 1.5 | 0.02 | 1.0 | 110 | 80 | 140 | 150 | 420 | 800 | 690 |
| 22.7-24.6 | 5 | 2.0 | 0.01 | 1.1 | BD | 40 | 110 | 220 | 210 | 500 | 310 |
| 24.6-25.3 | Dry Wood coal | ||||||||||
| 25.3-27.6 | 6 | 3.8 | 0.08 | 1.1 | BD | 40 | 110 | 160 | 150 | 500 | 300 |
| 27.6-28.8 | 7 | 8.7 | 0.25 | 1.0 | BD | 60 | 80 | 90 | 390 | 600 | 140 |
| 28.8-29.7 | 8 | 3.6 | 0.02 | 1.1 | 100 | 80 | 120 | 190 | 150 | 500 | 310 |
| 29.7-31.3 | 9 | 6.4 | 0.29 | 1.0 | BD | 50 | 110 | 140 | 130 | 400 | 270 |
| 31.3-32.5 | Rowe coal | ||||||||||
| 32.5-32.7 | 10 | 6.4 | 0.03 | 1.1 | 160 | 40 | 190 | 140 | 880 | 500 | 390 |
| 32.7-34.7 | 11 | 2.2 | 0.06 | 1.0 | 70 | 30 | 90 | 110 | 60 | 200 | 790 |
| Detection Limit | 20 | 10 | 10 | 10 | 10 | 100 | 20 | ||||
Prev Page—Introduction || Next Page—Coal
Kansas Geological Survey, Geology
Placed on web Oct. 25, 2018; originally published 1982.
Comments to webadmin@kgs.ku.edu
The URL for this page is http://www.kgs.ku.edu/Publications/Bulletins/MRS7/03_geol.html