Kansas Geological Survey, Bulletin 82, pt. 3, originally published in 1949
Next page--Data Tables, References
Originally published in 1949 as part of Kansas Geological Survey Bulletin 82, pt. 3. This is, in general, the original text as published. The information has not been updated.
Late Pleistocene loesses, classed as Loveland, Peoria, and Bignell silt members of the Sanborn formation, and their contained fossil soils (Loveland and Brady) constitute the most widespread ceramic raw material in Kansas. The silt deposits were made by the action of winds on stream-borne sediments during intervals of northern and mountain glaciation. The silts were modified by weathering processes that produced deep soils on former upper surfaces, now buried by younger deposits. These silts and soils were sampled at 46 localities extending from the Missouri River on the east to the Colorado State line. Ceramic tests on 318 samples and chemical analyses of 52 samples are reported. Spectrographic analyses supplement the ceramic and chemical data. The data show a high degree of uniformity from east to west but the greater effect of weathering in the eastern part of the State has increased the clay content and plastic properties. The Loveland is especially suitable for manufacture of brick, tile, and light-weight ceramic aggregates. The Peoria silt (exclusive of the Brady soil) is suitable for manufacture of dense "ceramic slag." At many localities the entire thickness of the Sanborn formation, including the fossil soils, may be utilized as raw material for brick, tile, and both light and heavy ceramic aggregates.
The most widespread ceramic raw material in Kansas is late Pleistocene loess, or windblown silt. Loess mantles the upland areas of approximately two-thirds of the northern half of the State. It ranges in thickness from maxima of 195 feet in Doniphan County near the Missouri Valley and 90 feet in Cheyenne County near the Arikaree Valley, to discontinuous patches only a few feet thick. These silts present several advantages for use by ceramic industries: (1) they are distributed across the entire 400-mile length of the State; (2) they occur immediately below the surface; (3) their unconsolidated nature permits excavation by inexpensive methods; (4) they are highly homogenous and uniform; and (5) the variety of products that can be manufactured from them ranges from brick and structural tile to constructional aggregates.
During the past several years the State Geological Survey of Kansas has made ceramic tests of loess at scattered localities. During the summer of 1948 an inventory of this material in the northern half of the State was undertaken. Samples were collected and stratigraphic sections measured from surface exposures, and in areas lacking adequate exposures, samples were obtained by hand augering. The localities for which data are reported here are shown in Figure 1, and distribution of relatively thick loess deposits is shown on the generalized map (Fig. 2).
Figure 1--Map of northern Kansas showing localities sampled. An east-west sample traverse was made through the northern tier of counties and three north-south traverses were made perpendicular to it. Silt members of the Sanborn formation only were sampled; symbols indicate members present at each locality.
Figure 2--Map of northern Kansas showing generalized thickness of loess deposits, Only relatively un eroded upland areas were considered and thicknesses were projected across valley areas, many of which are devoid of loess. Areas where an upland loess mantle of less than 10 feet thickness occurs were judged to be of little commercial significance and are not shown on the map.
It is the purpose of this report to present the results of these studies. The origin and stratigraphy of the loesses and buried soils are described. These data are necessary to predict the character of the material between localities tested, to serve as a guide for prospecting for deposits in untested areas, and to aid in the proper development of pits where the characters of the buried soils and several zones in the loess differ slightly. Complete chemical analyses (Table 1, Figs. 4, 6, and 7) and qualitative spectrographic analyses (Table 2) were made of samples from seven localities. Ceramic tests were made on samples from all 46 localities shown in Figure 1, and these data are presented in Tables 3 and 4, and Figures 5, 6, 7, 8, 9, and 10.
The loesses that constitute the near surface material in much of northern Kansas are late Pleistocene in age and are classed as Loveland, Peoria, and Bignell silt members of the Sanborn formation (Frye and Fent, 1947; Frye, Swineford, and Leonard, 1948). Although continental glaciers twice invaded northeastern Kansas during early Pleistocene time, late Pleistocene ice sheets did not reach into Kansas, Their existence farther north, however, is recorded in stream deposited sediments along present and former valleys and the extensive sheets of eolian silts over the upland areas and high terrace surfaces. A generalized composite section of the Pleistocene deposits of northern Kansas is shown in Figure 3.
Figure 3--Generalized composite section of northern Kansas Pleistocene deposits. The section shows the relation of the three silt members of the Sanborn formation, considered in this report, to the older units of the Pleistocene in this part of the State. Terrace deposits to which formal stratigraphic names have not been applied are not shown, although they are, for the most part, correlatives of the several sand and gravel members placed in the section,
The term loess has been used by different workers in widely divergent senses. Many definitions incorporate origin and partly for that reason the classification of the Kansas Geological Survey lists the three units described here as silt members. Silt deposits that display stratigraphic continuity are considered as constituting one member even though eolian, fluvial, and colluvial origins may all be represented. The definition of loess recently proposed by Flint (1947, p. 175) is suitable to the purposes of this report. It is as follows:
Loess, then, is a buff-colored nonindurated sedimentary deposit consisting predominantly of particles of silt size. Commonly it is non-stratified, homogeneous, calcareous, and porous, and it may possess a weak vertical structure resembling jointing.
The northern Kansas loesses are typical of loess elsewhere in being well sorted silt. Size analyses made of samples from several localities in northern and central Kansas (Swineford and Frye, 1945; Frye, 1945; Frye and Fent, 1947) show that 50 to 75 percent of the samples falls within the diameter range 0.01 to 0.05 mm. Commonly less than 2 percent consists of grains whose diameter is greater than 0.125 mm. A few samples contain a significant number of grains from 0.25 to 0.125 mm in diameter and traces were found to occur in the diameter range of 1.0 to 0.5 mm, From 2 to 8 percent of the sample commonly consists of particles with diameters of less than 0.00195 mm.
Except for relatively slight modification in the weathering profiles the loesses across the northern half of Kansas display a remarkable degree of uniformity and homogeneity in texture, structure, and appearance, Although quartz grains predominate in the coarser sizes and clay minerals in the finer sizes, minor amounts of other minerals are present.
The chemical composition of the loesses is important in evaluating ceramic utilization and also serves as an aid to stratigraphic correlation. Chemical analyses of 51 samples from seven localities are given in Table 1 and are shown graphically in Figures 4, 6, and 7. Spectrographic analyses of many of the same samples are given in Table 2. The silica content ranges from 65 to 79 percent, the larger quantities generally occurring in the weathering profiles or buried soils. Alumina ranges from 9 to 15 percent, and iron (Fe2O3) from 1.5 to 4 percent. Lime (CaO) presents the widest range of the constituents reported, from less than 1 to more than 6 percent, and indicates the effects of solution on the zones sampled. Magnesia (MgO) and potash (K2O) are relatively more constant and generally total less than 5 percent of the sample.
Two types of variation in the chemical composition are predictable. The most important and most pronounced of these is vertical variation through the several stratigraphic units and their weathering profiles. The second, less distinct, is regional variation from east to west,
Loess occurs typically as a mantle on upland divide areas and high terrace surfaces. This topographic situation, above valley rims that are commonly held up by resistant strata in the bedrock, results in poor exposures. At many places where wide areas are mantled by loess, such as the tabular upland divides underlain by Greenhorn limestone in Lincoln and Mitchell Counties, loess produces a gently rising slope above the valley bluffs and its presence, though it is locally more than 20 feet thick (Pl. 2), can be detected only by boring.
The general distribution of loess more than 10 feet thick in northern Kansas is shown in Figure 2. In preparing the map, the total thickness of the three members occurring in upland situations was used. Valley areas were ignored and information from the cooperative Ground Water Division and from A. Byron Leonard was utilized to supplement data for the 46 localities listed here.
Each of the three members presents a different distribution pattern. The Loveland is relatively thin along the Missouri Valley, the maximum thickness being 15 feet, but is present at all localities studied. It was not recognized in Nemaha and eastern Marshall Counties, but was found, generally 5 to more than 15 feet thick, at localities from northeastern Washington County westward to Rawlins County. In western Rawlins County and in Cheyenne and Wallace Counties, stratigraphic equivalents to the Loveland soil were observed developed on sandy silt and stratified silt. Loveland silt as much as 100 feet thick is thought to occur in abandoned valleys in McPherson, Rice (Fent, In press), and Republic Counties.
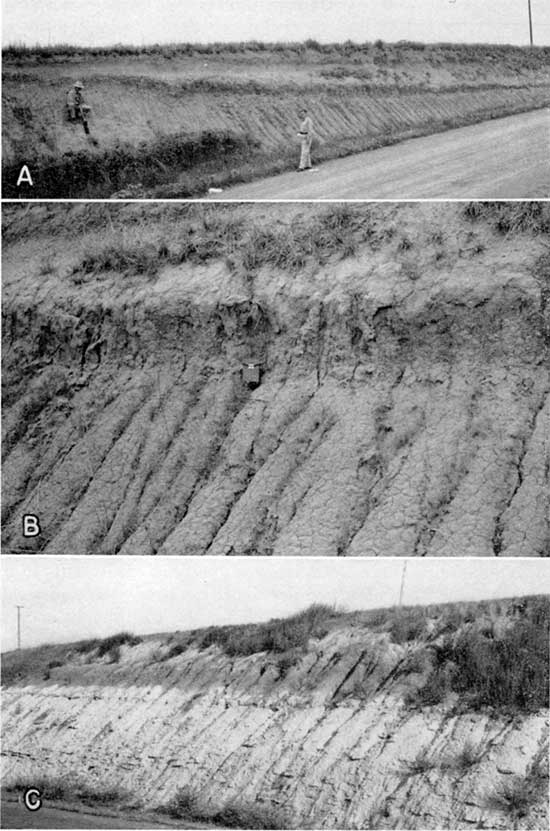
The Peoria silt is the most widespread member of the Sanborn formation. It was recognized at 41 of the 46 localities studied and may be present at the remaining 5 localities where differentiation of the Sanborn was not attempted. Along the Missouri Valley it ranged in thickness from 10 to more than 35 feet in exposures studied, and greater thicknesses have been penetrated by test drilling in northeastern Doniphan County. Westward across Brown, Nemaha, Marshall, and Washington Counties isolated patches of Peoria cap hilltops and divides and some upland flats are more extensively blanketed. Westward from eastern Republic County the Peoria thickens from an average of about 10 feet to locally more than 30 feet along the bluffs of Republican River Valley. A belt of relatively thick Peoria occurs along Republican Valley as far south as Clay Center. Westward, 5 to 10 feet of Peoria overlies Loveland on the flat Carlile shale plain and similarly caps the escarpment at the eastern margin of the Fort Hays limestone. A similar loess blanket covers much of Jewell, Mitchell, Smith, Osborne, Phillips, and Rooks Counties, generally becoming progressively thinner southward from Nebraska. From northwestern Phillips County across Norton, Decatur, and Rawlins Counties the Peoria thickens from 20 feet to more than 40 feet, but thins southward from Rawlins and Decatur Counties across Thomas and Sheridan Counties, diminishing to 10 feet or less in northern Logan, Gove, and Trego Counties.Plate 1--Fossil soils. A, Peoria silt, Brady soil, and Bignell silt exposed in road cut, north of Speed, Phillips County (loc. 17). B, Brady soil in road cut, same locality as A, C, Loveland silt and soil on Greenhorn limestone, overlain by Peoria silt in cut along U.S. Highway 36, eastern Republic County (loc) . Photos by A. R. Leonard.
The thickest Peoria silt observed in outcrop occurs in northwestern Cheyenne County along the south side of the Arikaree Valley where 90 feet was measured in canyons in sec. 17, T. 1 S., R. 14 W. Southward across the western end of the State the Peoria thins from maxima along Arikaree and Republican Valleys to 15 to 25 feet in southern Cheyenne County and remains within this range across Sherman, Wallace, and Greeley Counties. In central Kansas, south from Lincoln County, Peoria silt commonly does not exceed 10 feet in thickness, but more than 20 feet occurs at some places in central Rice County (Fent, In press).
The Bignell silt member presents still another distribution pattern. In northeastern Doniphan County, along the Missouri River bluffs, 35 feet of Bignell has been measured, but westward it has not been recognized over a distance of nearly 200 miles. It occurs extensively but is quite thin in Rice and McPherson Counties in central Kansas and westward from Phillips County to the Colorado State line. The average thickness measured at 9 localities in northwestern Kansas is 4.6 feet, and the range is from 2 to 8 feet. The widespread loess blanket rests indiscriminately on Permian and Cretaceous rocks, Ogallala sediments, Pleistocene terrace deposits, and glacial till.
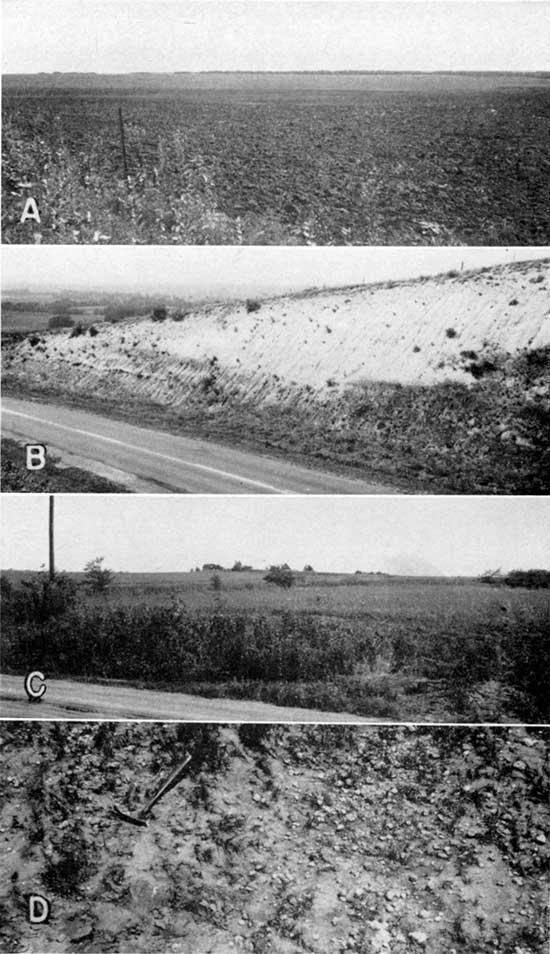
Plate 2--Sanborn formation and loess topography. A, Loess mantled topography, northeastern Washington County. Taken from locality 34 where 6.5 feet of Peoria and 13 feet of Loveland overlying Dakota formation were penetrated by augering. B, Sanborn formation exposed above Ogallala formation in road cut along U.S. Highway 36 (loc. 9), sec. 2, T. 3 S., R. 33 W., Rawlins County; 35 feet of Peoria resting on Loveland soil and 5 feet of Bignell exposed in cut. C, Loess mantled upland topography, northern Marshall County (loc. 35) in sec. 13, T. 1 S., R. 7 E. Six feet of Peoria and 5 feet of Loveland were penetrated by augering, overlying Permian rocks. D, Caliche nodules of Loveland soil profile in road cut at crest of south bluff of Solomon Valley south of Beloit (about 2 miles north of loc. 24), Mitchell County. Carlile shale below Loveland. Photos by Frye.
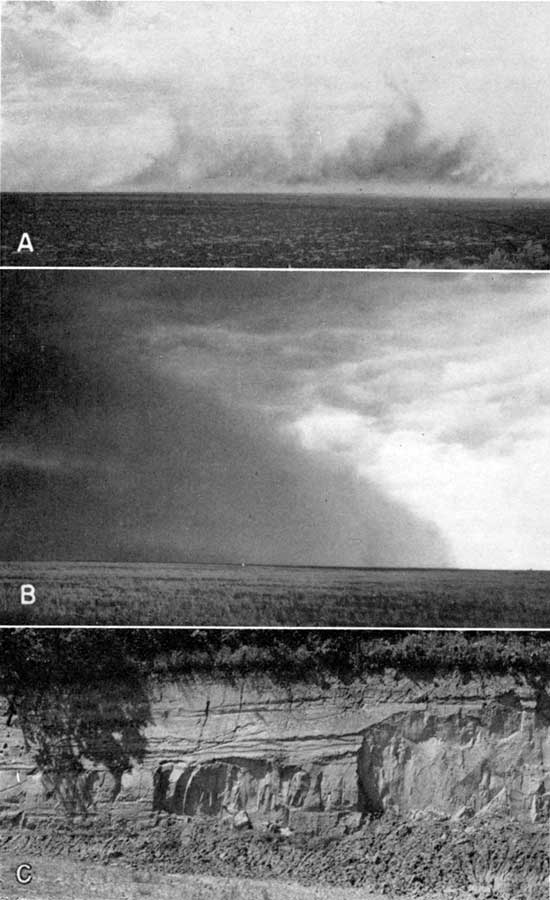
For the past 50 years (Haworth, 1897, p. 276) the extensive upland silt deposits of northwestern Kansas have been thought to be of eolian origin. Recent studies (Swineford and Frye, 1945; Frye, 1945; Schultz and Stout, 1945; Frye and Fent, 1947; Condra, Reed, and Gordon, 1947; Frye and Leonard, 1949) show that the extensive upland silt blanket of the central Great Plains can be explained only as a deposit made by wind, and that silt deposits on some valley sides are properly considered colluvial (Russell, 1944) and in some valley bottoms fluvial in origin as described by Elias (1931). During the past half century dust storms in dry periods have transported and deposited significant quantities of silt (Pl. 3A and B), which in some places has added from a fraction of an inch to a few feet of modern deposits to the older loess sheets.
Although the eolian origin of the widespread loesses is judged to be established, the immediate source of the silt is more obscure. Progressive change in texture, thickness, and calcium carbonate content have been used (Smith, 1942) to indicate source area of loess in Illinois. In the Kansas region sufficient size analyses and calcium carbonate determinations have not been made to clearly indicate source. However, measurements of thickness of each of the three stratigraphic units, together with their distribution patterns, seem to furnish adequate data to permit delineation of source areas.
A long period of weathering and erosion followed deposition of the Loveland prior to Peorian deposition. The deep Loveland soil indicates that this interval greatly exceeded the total of all subsequent intervals of weathering and erosion. The distribution pattern of the eroded Loveland member is not as significant as are the patterns of the two younger members, Furthermore major modifications of drainage (Frye, 1945a; Fent, In press) occurred prior to Loveland deposition and several large valley segments, abandoned by through-flowing drainage, served as catchment areas for Loveland loess depositions. In general, the Loveland is thickest and most extensive in the central and north-central parts of the State. This area occurs to the east-northeast of the extensive sand dune tracts south of Kinsley, Larned, and Great Bend, and in the vicinity of Hutchinson. As these dunes in part rest on deposits correlated with the Meade formation of Kansan and Yarmouthian age they represent a possible source of Loveland silt.
Plate 3--High Plains dust blows and Doniphan County loess. A, Dust blowing from a field east of Plains, northwestern Meade County, Kansas, 1940. B, Dust storm front approaching from the west, north of Plains, northwestern Meade County, Kansas, 1940. C, Bignell (35 feet thick) and upper Peoria silt members exposed in Cen. sec, 6, T. 2 S., R. 30 E., Doniphan County (loc. 41). Photos by Frye.
The Peoria silt has been less extensively removed by erosion and its distribution constitutes more convincing evidence as to its source. It is the Peoria that is most widespread, generally thickest, and the pattern of distribution of late Pleistocene loesses shown in Figure 2 is largely distribution of Peoria. Study of Figure 2 in conjunction with a drainage map of the Kansas-Nebraska-Colorado region reveals several pertinent relationships.
Along the northeastern edge of Kansas the relation of loess to the position and trend of Missouri River Valley (Frye and Leonard, 1949) is clearly evident. Thick loess caps the valley bluffs and westward from the valley the upland blanket thins to discontinuous thin patches. The loesses attain their maximum thickness in the eastward loop of the valley that encloses much of Doniphan County. The total thickness of loess penetrated in test holes in this area reaches a maximum of 195 feet and the Peoria member is commonly 30 to 60 feet thick. Clearly, the source of these silts is the flood plain of Missouri River. Silt is not now being blown in quantity from this flood plain and therefore significant changes must have occurred in the environment since the deposition of Peoria and Bignell loesses, That the climate was not more arid than now is attested by the fossil snails within the deposits (Frye and Leonard, 1949). The great volume of loess requires a sizable source and such a source is provided by the quantities of sediments inferred to have moved down the Missouri in the retreating phases of the late Pleistocene ice sheets. Iowan ice stood across the valley in northeastern Nebraska (Flint, 1947a), Tazewellian ice approached it in South Dakota, and Mankatoan ice covered central and northern Iowa (Kay and Graham, 1943). During the retreat of these ice sheets Missouri River was a principal avenue of discharge of water and sediment. In the melting season of the year flood waters intermittently covered the entire valley floor and on the retreat of each flood a surface of fresh sediment extended from valley wall to valley wall of the aggrading valley. As soon as the top few inches of this sheet of new sediment was thoroughly dry and until a cover of vegetation developed it constituted an excellent source of fine sediment for eolian transport. The well-vegetated valley sides constituted equally excellent traps for the wind transported silt. A prevailing west-northwest wind during deposition is suggested by the thick loess south of the valley where it trends east for about 15 miles, and by the shift of localization of thick loess to the eastern, or Missouri, side of the valley south of this area.
Westward from Missouri Valley for more than 100 miles the upland mantle of loess is thin and discontinuous. A glance at a drainage map shows that the major rivers of this area--Blue, Nemaha, and Delaware---all head south of the Platte and east of the Republican. Their sediment load could have been affected neither by the retreat of continental or mountain glaciers during late Pleistocene time. The distribution of loess is quite independent of these valleys.
The Republican Valley presents a striking contrast to the Blue, Nemaha, and Delaware (Fig. 2). Thick Peoria loess occurs to the south and southeast of the Republican throughout its entire distance across southern Nebraska and across Kansas to its juncture with Kansas River. In Republic County the Peoria exceeds 30 feet in thickness along the east side of the valley and in northern Cheyenne County 90 feet of Peoria was measured south of Arikaree River, a tributary to Republican River. As the Platte Valley farther north in Nebraska was also a prolific loess source, some of the Peoria in north-central and northwestern Kansas may have been transported from the Platte across the relatively narrow Platte-Republican divide. Auger borings, test hole data, and measured sections show that there is little if any thickening of loess adjacent to the valleys of the Solomon and Saline River systems. They are judged to have lacked outwash and not to have constituted sources for the late Pleistocene loesses.
The more gradual thinning of the loess away from source valleys in the High Plains area than along the Missouri and eastern part of the Republican may be due to different types of vegetative cover and more subdued valley walls. The High Plains before the advent of agriculture were covered by short grass whereas the bluffs of the Missouri Valley, and to a lesser extent the eastern part of the Republican, were forested.
The Peoria of west-central and central Kansas does not display a close relationship to major valleys. Rather, it has its greatest development to the east-northeast of extensive sand dune tracts, south of which it is thin and discontinuous. In Rice County (Fent, In press) the genetic association of Bignell and probably Peoria loess to sand dune fields is demonstrable. A shift in prevailing effective wind direction is thus indicated from west-northwest in northern Kansas to west-southwest in southern Kansas. Studies of sand dune morphology by H. T. U. Smith (oral communication) are not contradictory to such a conclusion.
The Bignell loess reflects the same source along Missouri Valley as the Peoria and attains a maximum thickness of more than 35 feet in northeastern Doniphan County. In north-central and northeastern Kansas, however, Bignell loess does not exhibit the same relation to Republican Valley as does the Peoria; in fact it is commonly absent along the valley bluffs. This, together with its thin and discontinuous nature and common occurrence in areas where the configuration of the underlying Brady soil suggests a slight sag on the Peoria surface, indicates that the Bignell was never a continuous mantle over this part of the Kansas High Plains. It may have been derived either from a more distant source, such as the Platte Valley to the north or the sand hills to the south, or from local blowing of the underlying Peoria (Pl. 3).
This change in distribution pattern suggests a change in the abundance of source sediments in the Republican Valley between deposition of Peoria and Bignell, and leads to speculation concerning the late Pleistocene history of Republican River. Again, a drainage map suggests the possibility of piracy by Platte and Arkansas tributaries of former headwaters of the Republican system in the area now included in the Colorado piedmont. Further speculation as to the date of such piracy leads one to consider the possibility of its occurrence after Peoria deposition and before Bignell deposition.
Buried soil profiles, or profiles of weathering, constitute the most ready means of stratigraphic classification and correlation of the upland loesses and the only marked variance in lithology in the general body of upland silt. In evaluating these fossil soils it is necessary to consider the entire thickness of the profile of weathering. The profiles show distinct though gradational zonation of physical and chemical characters which is the product of alteration of the initial deposit by downward percolating solutions, plants, animals, and other processes. The thickness of these soil profiles ranges from more than 30 feet in the Missouri Valley area to less than 1 1/2 feet in western Kansas. Although the characteristics of the profiles were largely produced by weathering after deposition of the containing loess unit, this fact should not be overlooked; weathering proceeded simultaneously with deposition and therefore in areas of slow accumulation of thin loess, generally distant from the source, some weathering effects, particularly low relative CaCO3 and high percentage of clay, typify the entire deposit (Smith, 1942, p. 172). The parent material of the fossil soils in upland situations is essentially uniform across the State and the interval of weathering of anyone soil was generally the same. It is judged therefore that variations in character of each fossil soil are due to differences in local topography, cover of vegetation, and climate (Byers, Kellog, Anderson, and Thorp, 1938). As local topographic variables were not radically different from east to west, and as regional changes in flora are importantly influenced by climate, the change in average morphology of a fossil soil from east to west is largely a reflection of climatic change across this belt.
Loveland soil has been observed from the Missouri bluffs in Doniphan County to Rawlins County, and as far south as Rice County in central Kansas (Fig. 1). Chemical analyses show little significant change in the upper layer of this soil from east to west, but suggest a progressive increase in CaCO3 in the lower part of the profile (Fig. 4). Along Missouri Valley the Loveland weathering profile is thick and the silt member is commonly leached and oxidized to a pale reddish-brown color throughout. The upper layer of the soil is light to moderate brown but is not blackened by organic material. In Doniphan County caliche nodules 2 to 3 inches in diameter were observed in the upper leached part of the Kansas till below Loveland soil and are judged to indicate the zone of Loveland caliche accumulation. The clay content of the upper part of the profile is relatively high but the zone of clay concentration is not as clearly defined as it is farther west in this same soil. Vertical profiles of chemical composition and physical properties (Fig. 7) show a sharp break at the top of the Loveland and base of the overlying Peoria.
Figure 4--Graphs showing geographic variations in chemical composition of loess and buried soils.
Figure 5--Graph showing geographic variations in selected ceramic properties of loess and buried soils.
Westward the Loveland soil is well exposed in Clay (loc. 32) and Republic (loc. 30, 31) Counties (Pl. lC). The section is thin at these localities and, although the upper part of the soil is dark reddish brown to brownish black and more conspicuous in the field, the chemical profiles (Figs. 6 and 7) do not show as sharp a break at the top of the soils as at localities to the east and west. From Jewell County across Smith and Phillips Counties to Norton County the upper part of the soil is dark reddish brown to brownish black in color and makes a conspicuous band on freshly plowed slopes and in exposures. A zone of clay accumulation occurs in the lower part of the dark layer and lower, shown strikingly by the drying shrinkage and P.C.E. curves in Figure 6 (loc. 14), and a prominent caliche zone occurs at still greater depth (Pl. 2D). The silt is commonly a pale reddish-brown color' below the dark layer as a result of deep oxidation of iron. In western Norton County the entire profile is 3 to 4 feet thick, and westward in Rawlins and Decatur Counties it becomes thinner and the upper layer lighter in color. The character of the caliche zone ranges from a thick band of large nodules to a few scattered small nodules, and its development was probably influenced importantly by local topography of the former soil surface and conditions of subsoil drainage.
Figure 6--Graphs showing vertical variations in selected chemical constituents and ceramic properties of loess and soils at localities 3, 7, 14, and 21. Weathering profiles are prominently shown both by chemical analyses and physical properties.
Figure 7--Graphs showing vertical variations in selected chemical constituents and ceramic properties of loess and soils at localities 30, 32, and 41. Large caliche nodules in the zone of lime accumulation of the fossil soils were not included in the samples. Note transition zone at base of the Bignell silt at locality 41.
The Brady soil occurs in three relatively isolated regions. Although not traceable from one to the other it can be demonstrated as representing the same horizon by stratigraphic position and the faunas contained in the Peoria silt and overlying Bignell silt, The Brady soil profile exposed in the Missouri bluffs (loc. 41) in the northeastern corner of Kansas (Pl. 3C) is as much as 15 feet thick and is shown by chemical profile (Fig. 7). CaCO3 is leached to a depth of nearly 15 feet; a prominent caliche zone occurs at the base of the leached zone; clay concentration below the top of the profile is indicated by higher linear shrinkage and P.C.E. and by lower fired absorption (Fig. 7). That the initial deposition of the overlying Bignell was slow followed by more rapid deposition is shown by low CaCO3 content in the lower part.
In central Kansas the Brady soil and Bignell silt were sampled only in Rice County (loc. 21) where they are quite thin. The chemical profile at that locality is anomalous although the low alkali content of the Brady soil suggests leaching (Fig. 6). CaCO3 derived from leaching of Brady and modern soils is partly concentrated below the Peoria in the Loveland soil, the high clay content of which is indicated by high drying and fired shrinkage and low fired absorption. Loveland caliche occurs as large nodules in the underlying soil on the Dakota formation.
In northwestern Kansas Brady soil was studied in Phillips (Pl. lA and B), Norton, Decatur, Rawlins, Cheyenne, Thomas, Logan, and Greeley Counties (locs. 1, 3, 4, 7, 9, 12, 14, and 17). In all these localities the profile is from 1 1/2 to 3 feet thick and is distinguished by a grayish-brown to brownish-black upper layer, thin zone of clay accumulation, and small scattered caliche nodules in the lower part. Chemical and physical properties profiles (Fig. 6) for localities 3, 7, and 14 all illustrate the effects of weathering. In each case CaCO3 has been leached from the upper part of the profile and concentrated at greater depth, and a high alumina content and drying shrinkage with low fired absorption in the upper part of the soil indicates a concentration of clay. Iron shows no effect of weathering or a slight increase in the upper part of the profile. Silica in the Brady, as in the Loveland profile, shows little effect of weathering and its percentage increase or decrease is a reflection of the gross removal or addition of the other more mobile constituents.
The ceramic properties of the samples tested were determined by methods recommended by the Committee on Standards of the American Ceramic Society (Watts and others, 1928) and standards designated by the American Society for Testing Materials (1944) (designation C 20-41). The following minor deviation from standards were considered advisable: the test bricks were molded 3/4 x 3/4 x 3 inches rather than the usual 1 1/8 x 1 1/8 x 3 1/2 or 7 inches; and the pyrometric cone equivalent (P.C.E.) was determined in a Globar heated electric furnace rather than in the commonly used gas furnace, and at a much slower rate of heating than that designated in A.S.T.M. standards in order to avoid bloating of the clay cones. Methods and standard procedures for clay testing are described in detail by Plummer and Romary (1947).
The firing ranges given for the various samples tested should be considered as applicable only to the use of the materials in the manufacture of brick, hollow tile, and similar heavy clay products. The lower limit of the firing range is the temperature at which the saturation coefficient is reduced to a value less than 0.80, or the absorption (determined by immersion in boiling water for 5 hours) does not exceed 20 percent. The upper limit of the firing range is the temperature to which the test brick can be fired without warping, sticking, or bloating.
The laboratory samples of the raw loess for chemical and spectrographic analysis were ground to pass an 80-mesh screen. The prepared samples were then analyzed for: water (105 to 140 degrees centigrade), loss on ignition, SO3, P2O5, SiO2, Al2O8, Fe as Fe2O3, TiO2, CaO, MgO, and K2O (Na2O was determined as by difference from 100 percent). The samples were analyzed in sets of six as follows: one set for water, loss on ignition, and sulfates; one set for P2O5; and one set for the remainder of the determinations. Loss on ignition was determined by obtaining the net loss of weight after heating to 1000 degrees centigrade in a small Hoskins electric muffle. Sulfate was determined by leaching the ignited samples with HCl followed by precipitation in a large volume with barium chloride. The phosphate was determined by leaching the raw sample with 10 percent by volume of nitric acid followed by precipitation with ammonium molybdate. The remainder of the determinations were made following the general procedure for silicate analysis (Hillebrand and Lundell, 1946; Kolthoff and Sandell, 1946; and Scott, 1939) with the exception of TiO2, which was done gravimetrically (Runnels and Dubins, 1949). The results of chemical analyses are given in Table 1.
The qualitative spectrographic analyses were produced with a one and one-half meter applied Research Laboratory grating spectrograph. The spectrograms were inspected visually with a comparator, and the results are given in Table 2.
Table 1--Chemical analyses of loess and buried soils from northern Kansas.
| Locality No. | Sample | SiO2 | Al2O8 | Fe2O3 | TiO2 | CaO | MgO | P2O5 | SO3 | K2O | Na2O* | Igt. Loss | H2O 105 to 140° |
|---|---|---|---|---|---|---|---|---|---|---|---|---|---|
| 3 | A | 67.19 | 13.61 | 3.55 | 0.84 | 3.76 | 1.99 | Tr. | Tr. | 2.94 | 1.37 | 4.75 | 0.97 |
| B | 65.37 | 11.61 | 3.10 | 1.69 | 5.85 | 1.79 | 0.10 | Tr. | 2.89 | 1.45 | 6.15 | 0.86 | |
| C | 65.37 | 12.00 | 3.41 | 0.83 | 5.88 | 1.89 | Tr. | 0.05 | 2.78 | 1.14 | 6.60 | 0.73 | |
| D | 69.88 | 14.03 | 4.24 | 0.90 | 1.42 | 1.67 | Tr. | 0.05 | 2.88 | 0.91 | 3.59 | 1.26 | |
| E | 67.78 | 12.55 | 3.47 | 0.58 | 4.35 | 1.64 | Tr. | 0.05 | 2.78 | 1.41 | 5.34 | 0.90 | |
| F | 68.66 | 12.27 | 2.59 | 0.95 | 4.57 | 1.54 | Tr. | 0.05 | nd. | 4.11 | 5.21 | 0.72 | |
| 7 | A | 69.99 | 12.00 | 2.84 | 0.67 | 4.21 | 1.62 | nd. | 0.09 | 2.86 | 1.15 | 4.57 | 0.19 |
| B | 67.62 | 11.03 | 2.86 | 1.22 | 5.57 | 1.55 | 0.24 | 0.06 | 3.47 | 0.71 | 5.91 | 0.42 | |
| C | 70.62 | 12.13 | 3.07 | 0.99 | 3.36 | 1.42 | 0.10 | 0.06 | 3.19 | 0.23 | 4.93 | 0.49 | |
| D | 68.25 | 10.91 | 2.49 | 1.01 | 6.41 | 1.27 | 0.26 | 0.06 | 2.97 | 0.48 | 6.15 | 0.46 | |
| 14 | A | 69.44 | 11.22 | 2.67 | † | 5.77 | 1.20 | 0.09 | Tr. | 2.47 | 1.79 | 5.35 | 0.35 |
| B | 70.92 | 13.11 | 3.97 | 1.49 | 1.74 | 0.08 | Tr. | 2.80 | 2.62 | 3.27 | 0.79 | ||
| C | 71.35 | 14.60 | 3.53 | 1.90 | 0.99 | 0.08 | Tr. | 2.50 | 1.36 | 3.69 | 0.94 | ||
| D | 72.35 | 13.56 | 3.46 | 2.04 | 1.77 | 0.14 | Tr. | 2.78 | 0.24 | 3.66 | 0.83 | ||
| E | 70.16 | 14.02 | 2.70 | 2.87 | 2.22 | 0.15 | Tr. | 2.19 | 0.97 | 4.12 | 0.67 | ||
| F | 68.39 | 12.38 | 3.56 | 0.54 | 3.32 | 1.79 | 0.16 | 0.05 | 2.57 | 1.75 | 5.54 | 0.67 | |
| G | 70.05 | 12.99 | 3.91 | 1.02 | 1.63 | 1.55 | 0.14 | Tr. | 3.31 | 0.98 | 4.42 | 0.68 | |
| H | 69.62 | 11.91 | 3.60 | 0.79 | 2.29 | 1.28 | 0.14 | Tr. | 3.22 | 1.89 | 5.26 | 0.70 | |
| I | 69.97 | 11.60 | 3.27 | 0.49 | 3.47 | 1.65 | 0.17 | 0.05 | 2.99 | 0.99 | 5.40 | 0.49 | |
| J | 71.22 | 12.78 | 3.25 | 0.73 | 2.32 | 1.51 | 0.15 | 0.00 | 3.29 | 0.42 | 4.48 | 0.42 | |
| 21 | A | 78.95 | 9.23 | 2.45 | 1.16 | 1.03 | 0.82 | 0.05 | 0.05 | nd. | 4.49 | 1.77 | 0.19 |
| B | 73.66 | 11.11 | 2.68 | 1.36 | 2.33 | 1.03 | 0.05 | 0.05 | nd. | 3.51 | 4.22 | 0.41 | |
| C | 74.69 | 11.21 | 3.65 | 0.74 | 1.31 | 1.07 | Tr. | 0.05 | nd. | 4.11 | 3.12 | 0.28 | |
| D | 76.66 | 12.04 | 3.36 | 1.09 | 0.91 | 1.01 | Tr. | 0.05 | nd. | 1.36 | 3.47 | 0.28 | |
| E | 72.87 | 11.84 | 3.20 | 1.41 | 0.84 | 1.11 | Tr. | 0.00 | nd. | 4.24 | 4.49 | 0.40 | |
| 30 | A | 71.01 | 12.39 | 3.79 | 0.95 | 2.27 | 1.68 | 0.10 | 0.14 | 2.29 | 1.30 | 4.18 | 0.29 |
| B | 73.30 | 12.01 | 3.79 | 1.12 | 0.48 | 1.69 | 0.07 | 0.02 | 2.51 | 1.03 | 3.55 | 0.28 | |
| C | 71.45 | 11.59 | 4.02 | 1.66 | 0.93 | 1.12 | 0.08 | 0.02 | 3.13 | 1.74 | 4.34 | 0.25 | |
| D | 71.01 | 12.70 | 3.89 | 0.54 | 1.52 | 1.81 | 0.15 | 0.10 | 2.31 | 2.28 | 3.84 | 0.20 | |
| E | 68.36 | 12.22 | 4.31 | 1.13 | 1.64 | 2.63 | 0.15 | 0.14 | 1.89 | 2.51 | 5.17 | 0.22 | |
| 32 | A | 77.32 | 10.83 | 2.52 | 1.22 | 1.49 | 0.86 | 0.14 | Tr. | 2.87 | 1.12 | 1.77 | 0.29 |
| B | 77.64 | 10.38 | 2.53 | 0.88 | 1.22 | 0.74 | 0.14 | 0.15 | 3.23 | 1.32 | 1.83 | 0.25 | |
| C | 78.62 | 10.24 | 2.35 | 0.94 | 1.34 | 0.70 | 0.08 | 0.20 | 3.23 | 0.56 | 1.74 | 0.08 | |
| D | 77.95 | 10.18 | 2.59 | 0.72 | 0.86 | 0.70 | Tr. | Tr. | 3.02 | 1.38 | 2.60 | 0.18 | |
| E | 76.69 | 10.80 | 2.79 | 0.92 | 0.93 | 0.86 | Tr. | 0.07 | 3.68 | 0.50 | 2.76 | 0.21 | |
| F | 75.86 | 10.79 | 2.94 | 0.83 | 1.32 | 0.89 | 0.11 | Tr. | 3.18 | 1.77 | 2.31 | 0.23 | |
| G | 74.75 | 10.96 | 2.80 | 1.17 | 1.75 | 1.19 | 0.15 | Tr. | 3.27 | 1.75 | 2.36 | 0.39 | |
| 41 | A | 75.63 | 11.95 | 2.77 | 2.17 | 1.27 | 0.14 | Tr. | 2.64 | 0.59 | 2.98 | 0.39 | |
| B | 76.80 | 12.05 | 2.75 | 0.98 | 0.96 | 0.09 | Tr. | 2.59 | 1.39 | 2.48 | 0.30 | ||
| C | 76.58 | 12.05 | 3.03 | 1.17 | 1.08 | 0.17 | Tr. | 2.90 | 0.82 | 2.37 | 0.26 | ||
| D | 71.21 | 10.11 | 2.61 | 3.70 | 2.62 | 0.15 | Tr. | 2.35 | 1.62 | 5.78 | 0.13 | ||
| E | 71.62 | 11.61 | 2.92 | 3.55 | 2.08 | 0.16 | Tr. | 2.00 | 1.54 | 4.68 | 0.55 | ||
| F | 73.33 | 12.00 | 3.02 | 2.67 | 1.06 | 0.08 | Tr. | 2.55 | 1.48 | 3.89 | 0.47 | ||
| G | 76.79 | 10.85 | 2.87 | 1.10 | 1.15 | 0.13 | Tr. | 2.58 | 2.39 | 2.27 | 0.35 | ||
| H | 77.38 | 11.82 | 2.72 | 0.95 | 1.26 | 0.09 | Tr. | 2.69 | 0.77 | 2.41 | 0.40 | ||
| I | 76.78 | 10.47 | 3.32 | 1.30 | 1.02 | 0.97 | 0.10 | Tr. | 2.41 | 1.44 | 2.29 | 0.40 | |
| J | 76.99 | 11.14 | 2.86 | 0.80 | 0.98 | 1.01 | 0.08 | 0.02 | 2.21 | 1.39 | 2.60 | 0.60 | |
| K | 68.02 | 10.82 | 2.76 | 4.87 | 3.22 | Tr. | Tr. | nd. | 3.31 | 7.00 | 0.57 | ||
| L | 69.11 | 10.80 | 3.15 | 4.22 | 2.51 | 0.17 | 0.06 | 2.52 | 1.61 | 6.02 | 0.45 | ||
| N | 68.83 | 11.09 | 3.04 | 4.16 | 2.41 | 0.15 | 0.06 | 2.63 | 1.68 | 6.10 | 0.45 | ||
| P | 65.39 | 10.15 | 3.25 | 6.15 | 2.97 | 0.15 | 0.04 | 2.26 | 1.53 | 8.26 | 0.08 | ||
| R | 66.58 | 11.06 | 3.20 | 5.60 | 2.50 | 0.15 | 0.20 | 2.84 | 0.28 | 7.74 | 0.25 | ||
|
† Included with alumina. * Undetermined difference reported as Na2O. |
|||||||||||||
Table 2--Qualitative spectrographic analyses of selected samples of loess and buried soil from northern Kansas. (Analyses by A. C. Reed in the laboratories of the State Geological Survey of Kansas.)
| Locality No. |
Sample | Si | P | Mn | Mg | Fe | Al | V | Cu | Na | Ag | Zn | Ti | Zr | K | Ca | Cr |
|---|---|---|---|---|---|---|---|---|---|---|---|---|---|---|---|---|---|
| 3 | A | * | * | 8 | * | * | * | 5 | - | * | 4 | 6 | * | 6 | * | * | 3 |
| B | * | * | 8 | * | * | * | 4 | - | * | 4 | - | * | 6 | * | * | 4 | |
| C | * | * | 7 | * | * | * | 3 | - | * | - | - | * | 4 | * | * | - | |
| D | * | * | 9 | * | * | * | 6 | 4 | * | 5 | - | * | 6 | * | * | 4 | |
| E | * | * | 7 | * | * | * | 4 | - | * | 2 | - | * | 6 | * | * | - | |
| F | * | * | 7 | * | * | * | 4 | - | * | 2 | - | * | 4 | * | * | - | |
| 7 | A | * | * | 6 | * | * | * | 4 | 4 | * | - | 4 | * | 7 | * | * | 3 |
| B | * | * | 9 | * | * | * | 6 | 6 | * | - | 6 | * | 7 | * | * | 4 | |
| C | * | * | 8 | * | * | * | 6 | 6 | * | - | 5 | * | 6 | * | * | 4 | |
| D | * | * | 8 | * | * | * | 6 | 5 | * | - | 6 | * | 7 | * | * | 4 | |
| 14 | A | * | * | 6 | * | * | * | 6 | - | * | - | * | 4 | * | * | 4 | |
| B | * | * | 7 | * | * | * | 7 | - | * | - | - | * | 4 | * | * | 4 | |
| C | * | * | 7 | * | * | * | 7 | - | * | - | - | * | 4 | * | * | 4 | |
| D | * | * | 7 | * | * | * | 7 | - | * | - | - | * | 4 | * | * | 4 | |
| E | * | * | 6 | * | * | * | 6 | - | * | - | * | 4 | * | * | 4 | ||
| F | * | * | 7 | * | * | * | 6 | - | * | - | * | 7 | * | * | 4 | ||
| G | * | * | 8 | * | * | * | 7 | - | * | - | - | * | 8 | * | * | 4 | |
| H | * | * | 8 | * | * | * | 7 | - | * | - | - | * | 8 | * | * | 4 | |
| I | * | * | 8 | * | * | * | 7 | - | * | - | - | * | 8 | * | * | 4 | |
| J | * | * | 7 | * | * | * | 7 | - | * | - | - | * | 8 | * | * | 4 | |
| 21 | A | * | * | 6 | * | * | " | 6 | 4 | * | - | - | * | - | * | * | 4 |
| B | * | * | 6 | * | * | * | 6 | 5 | * | - | - | * | - | * | * | 5 | |
| C | * | * | 7 | * | * | * | 5 | 5 | * | - | - | * | 5 | * | * | 6 | |
| D | * | * | 4 | * | * | * | 5 | 5 | * | - | - | * | - | * | * | 2 | |
| E | * | * | 6 | * | * | * | 7 | 5 | * | - | - | * | - | * | * | 5 | |
| 30 | A | * | * | 6 | * | * | * | 6 | - | * | - | - | * | 6 | * | * | 4 |
| B | * | * | 6 | * | * | * | 5 | - | * | - | - | * | 5 | * | * | 4 | |
| C | * | * | 7 | * | * | * | 6 | - | * | - | - | * | 7 | * | * | 4 | |
| D | * | * | 6 | * | * | * | 5 | - | * | - | - | * | 6 | * | * | 4 | |
| E | * | * | 7 | * | * | * | 6 | - | * | - | - | * | 7 | * | * | 4 | |
| 32 | A | * | * | 7 | * | * | * | 9 | 6 | * | - | 5 | * | 7 | * | * | 7 |
| B | * | * | 5 | * | * | * | 3 | 5 | * | - | 3 | * | 3 | * | * | 3 | |
| C | * | * | 6 | * | * | * | 5 | 6 | * | - | 4 | * | - | * | * | 4 | |
| D | * | * | 6 | * | * | * | 5 | 6 | * | - | 4 | * | 4 | * | * | 5 | |
| E | * | * | 4 | * | * | * | - | 5 | * | - | 2 | * | - | * | * | - | |
| F | * | * | 6 | * | * | * | 5 | 6 | * | - | 4 | * | 3 | * | * | 2 | |
| G | * | * | 5 | * | * | * | 5 | 6 | * | - | 4 | * | - | * | * | - | |
| 41 | B | * | * | 7 | * | * | * | 4 | - | * | - | - | * | 6 | * | * | 4 |
| E | * | * | 7 | * | * | * | 5 | - | * | - | - | * | 8 | * | * | 5 | |
| F | * | * | 7 | * | * | * | 7 | - | * | - | - | * | 6 | * | * | 5 | |
| G | * | * | 6 | * | * | * | 6 | - | * | - | - | * | 6 | * | * | 7 | |
| H | ,. | * | 7 | * | * | * | 5 | - | * | - | - | * | 6 | * | * | - | |
| I | * | * | 7 | * | * | * | 6 | - | * | - | - | * | 6 | * | * | 5 | |
| J | * | * | 6 | * | * | * | 3 | - | * | - | - | * | 5 | * | * | 4 | |
| P | * | * | 9 | * | * | * | 8 | 1 | * | 2 | - | * | 9 | * | * | 8 | |
| Symbols used: *--Analyzed chemically. l0--Strongest, broadest lines; line reversal. 9--Extremely broad and black lines. 8--Very black lines. 7--Black lines. 6--Elements present in amounts usually reported as traces. 5--Lines are positive but small. 4--Lines are weak. 3--Lines are hard to see. 2--Lines are extremely weak. 1--Lines are nearly indiscernible. (-)--Elements not detected. |
|||||||||||||||||
The Loveland member, as sampled for this investigation, includes only clays and silts from the thick soil profile, and the Loveland samples tested generally contain more clay than the samples tested from the Bignell and Peoria members.
The higher clay content in connection with other effects of weathering results in a material that is relatively plastic, with a higher drying shrinkage, longer firing range, and higher pyrometric cone equivalent (Tables 3, 4, 6, and 7; Figures 6, 7, 8, 9, and 10). The rates of change in size and in percentage absorption over equivalent ranges of temperature are less in the Loveland test bricks than in those made from either Peoria or Bignell silts.
Over the geographic range of sampling the Loveland member shows little variation in ceramic properties as a whole, although samples from a few localities show rather extreme variations. The Loveland soil at locality no. 41 (Doniphan County) is extremely lean and crumbly, whereas in some of the north-central localities the Loveland is very plastic and sticky.
Within the Loveland soil the upper layer commonly is the most plastic and clayey with the longest firing range and the highest pyrometric cone equivalent. In general the clayey, plastic quality, with accompanying ceramic properties, decreases with increasing depths below the upper layer ("A" and upper "B" horizons of the fossil soil profile). Zones of lime accumulation also show decided differences, not so much in plastic and dry properties as in the firing characteristics. With these materials the firing range is usually quite short and the P.C.E. low. These characteristics are clearly demonstrated in Figure 6 (loc. 14 and 30), Figure 7 (loc. 41), and Figure 8 (loc. 18 and 34). In the case of a few samples the lime content was sufficiently high to cause disintegration of the fired test bricks due to hydration.
Figure 8--Graph showing vertical variations of ceramic properties at several temperatures for localities 1, 8, 18, and 34. A relatively high clay content is shown for the thin deposits at locality 34 in Washington County. An unusually high CaCO" content in the Loveland soil "C horizon" in shown by the low P.C.E. in locality 18 in Phillips County.
In summary, the Loveland soil, as compared to the other silt members of the Sanborn formation, is relatively clayey and plastic, and the soil profile considered as a whole is quite uniform over the geographic range of sampling. Within the profile differences in the "A", "B", and "C" horizons are well defined and consistent, although varying in thickness and degree of development from locality to locality.
At any one locality the entire section of the Peoria silt sampled is usually very uniform both in appearance and ceramic properties. Considered as a whole the Peoria has a relatively low clay content, and contains a relatively high percentage of disseminated calcium carbonate, averaging 5.15 percent for the samples analyzed as compared to an average of 3.06 percent for the upper Brady soil and 2.48 percent for the upper "Loveland" soil (Table 5). As should be expected in this case the material tends to be lean, and to have a somewhat lower drying shrinkage than the Loveland and Brady soils. Likewise the firing range is relatively short and the pyrometric cone equivalent low and rather close to the upper end of the firing range.
Consideration of the Peoria silt in detail, however, reveals pronounced variations from locality to locality. Generally, but not invariably, the clay content and plasticity increase from west to east as do the firing shrinkage, firing range, and P.C.E. Consistent with the above observations of data the absorptions are lower within the same temperature range. This west-east variation is clearly shown in Figure 9.
Figure 9--Graph showing comparison of selected firing characteristics of Loveland silt with Peoria and Bignell silts. Entire thickness of units averaged for each locality. Note that absorptions of both Loveland and Peoria-Bignell are progressively lower from west to east and the firing ranges are progressively longer from west to east.
At some localities the Peoria is extremely silty, containing so little plastic material that it was difficult to mold the test bricks. At other localities, especially in the north-central to eastern area, the Peoria silt is plastic, smooth, and has excellent working properties.
Although the Peoria is texturally a silt, as ceramic material it is a natural clay "body" containing varying proportions of clay and finely divided nonplastics. If all the nonplastics were removed the resulting clay would be too much like a bentonite to be of practical ceramic use.
Examination of the test data (Table 3) reveals that 69 of 130 samples were judged to be "plastic" or "fairly plastic," whereas 61 samples were judged to be "lean" or "very lean." More of the samples were "fairly plastic" than "plastic." The best working properties are usually found in a fairly plastic clay.
If the greater part of the alumina content of the Peoria silt samples is assigned to the illite clay minerals, the clay content will range from 40 percent to 55 percent--a common range for ceramic "bodies."
The Brady soil, although much thinner, is analogous to the Loveland soil, and the ceramic tests on both show them to be very similar. Both are relatively clayey and plastic, with other ceramic properties such as long firing range and high P.C.E., consistent with this condition. The Brady shows less geographic variation in ceramic properties than the Loveland. At most localities sampled the Brady is a good ceramic material, and where it occurs, it will usually improve the quality of the Peoria member as a whole.
The Bignell member is similar in all respects to the Peoria silt. Because of this, plus the fact that the Bignell is quantitatively unimportant, detailed comparisons have not been made between it and other members of the Sanborn formation.
In northeastern Kansas, near Missouri River, as much as 35 feet of Bignell silt has been measured. The ceramic properties of the upper 30 feet of the Bignell at locality 41 indicate that this material is one of the best suited to the production of ceramic aggregate and railroad ballast.
It is probable that the modern soil developed on the Bignell should be given ceramic consideration. Although no samples of the modern soil were collected it can be safely assumed that it is similar to the Brady, and for most uses its addition to the underlying materials would improve their ceramic quality.
In comparison to the complete range possible in clays the ceramic properties of the Sanborn formation are uniform throughout the stratigraphic and geographic range from which samples were tested. In comparison to other types of Kansas clay the ceramic properties of the Sanborn approach average values. The firing range is moderately short and covers an intermediate range of temperatures. Within the range of firing temperatures changes in shrinkage and absorption are fairly rapid, especially at the upper end of the firing range. Overall firing shrinkage is comparatively high. In most respects the clays of the Sanborn compare rather closely in ceramic characteristics with the Pennsylvanian shales of Kansas. The Permian shales tend to fire over lower and shorter temperature ranges, whereas the clays of the Dakota formation have a relatively higher drying shrinkage, and a much longer firing range over a much higher range of temperatures. Comparisons of the ceramic properties of the Sanborn formation and those of other types of Kansas clays are given in Table 6, and are shown graphically in Figure 10.
Figure 10--Graph showing typical firing characteristics of Sanborn formation silts, Permian and Pennsylvanian shales, and Dakota formation siliceous fireclay. Data for Loveland are averages from 19 localities, and for PeoriaBignell are averages from 23 localities. Permian shale represents averages of five localities in Kingman, McPherson, and Reno Counties, and Pennsylvanian shale, seven localities in Allen, Anderson, Douglas; and Shawnee Counties.
In respect to the saturation coefficient (ratio of absorption after five hours immersion in boiling water to absorption after 24 hours immersion in cold water) Sanborn clays differ decidedly, but not radically from other types' of clays tested in our laboratory. The saturation coefficient for the Sanborn materials is consistently lower both at low and high absorption values. This is characteristic of silty, unconsolidated clays, and is decidedly in favor of the Sanborn materials in that the lower the value of the saturation coefficient the more resistant the material is to freezing and thawing.
The clay and silts of the Sanborn differ from other types of Kansas clay chiefly in the characteristics of the raw material. The Sanborn materials tend to be harsh, sticky, and somewhat spongy in the plastic state. These characteristics are due in part to the silt content, but not entirely. Pennsylvanian shales and Dakota clays containing the same percentage of non plastic ingredients do not exhibit these properties to the same degree. It is possible that these characteristics are due both to the nature of the clay mineral content, presumably a highly plastic species of illite, and to a small percentage of silica gel or colloidal silica.
Although these raw properties are a disadvantage in working the materials, it is probable that they inevitably accompany the high dry strength and low saturation coefficient of the fired samples.
The Sanborn clays and silts are most suitable for use in manufacturing relatively coarse and low-cost products wherein minimum mining costs, low firing temperatures, and standard methods of production are applicable. Two general types of product are included in this class--structural shapes and ceramic aggregates. The structural shapes include brick and hollow tile, and the ceramic aggregates include (1) a dense, hard product suitable for use as concrete aggregate, road surfacing material, railroad ballast, and riprap, and (2) light-weight concrete aggregate of which Haydite is an example.
The stiff-mud extrusion method of forming is generally preferred for manufacturing brick and structural tile. A relatively plastic material is required for stiff-mud extrusion. For this reason use of the Sanborn for the manufacture of brick and tile is somewhat restricted, especially in areas where the available materials are all or chiefly the less plastic Peoria and Bignell silts. For example, the stiff-mud process probably would not be suitable for processing the materials at localities 6, 10, 29, and 41. It is probable that the dry-pressing process, or possibly soft-mud molding, could be used on the less plastic clays, but due to the abundance of more suitable materials there would be little point in using anything but the best.
Other characteristics desirable in a clay to be used in the manufacture of brick and tile include attractive fired color, long firing range, and a P.C.E. relatively far above the upper limit of the firing range. The fired color is a good shade of red in all but a few of the samples tested, and in no way restricts the choice of materials. Likewise, the saturation coefficient is remarkably low--in many cases less than 0.80 with absorptions exceeding 20 percent. Near the upper limit of the firing range the saturation coefficient usually ranges from 0.35 to 0.45. A.S.T.M. standard designation C 62-41T sets 0.80 as the upper limit for the saturation coefficient. In general a fired clay product having a saturation coefficient below 0.80 will withstand severe exposure to freezing and thawing (Stull and Johnson, 1940; McMahon and Amberg, 1947; Plummer and Hladik, 1948). This desirable feature is outstanding in the materials tested from the Sanborn formation, and is not restricted either stratigraphically or geographically.
Longer firing ranges, with the p.e.E. well above the upper limits of the range, are more common to the Loveland and Brady soils than to the other units of the Sanborn, but in a few cases the firing range of the Peoria and Bignell exceed that of the Loveland or Brady at other localities. At some localities a Peoria unit with a moderately short firing range can be combined with a Loveland soil having a longer range to produce a satisfactory blend. The Peoria silt where plastic enough for extrusion has good working properties. It has less tendency to be sticky and tough and would probably require less power on the auger than the materials from the Loveland soil.
Zones of lime accumulation, especially caliche, should be avoided for use in brick and tile. In most cases this would cause little difficulty because the most prominent caliche zones are found near the lower part of the Loveland soil and need not be mined. Where present in the Brady it would commonly occur near the surface, if at all, and could be eliminated as overburden.
A casual inspection of the data in Tables 1 and 2 indicates that at localities 14, 21, 22, 24, 25, 27, 31, 33, 34, 35, 39, 43, and 45 the entire section sampled, with the possible exception of the lower part of the Loveland soil, is suitable for use in the manufacture of brick and tile.
The ceramic characteristics of a material suitable for the manufacture of light-weight aggregates are somewhat similar to those required for brick and tile. Plastic and dry properties are, of course, of no importance, but a clay or silt with a long firing range is more likely to produce a bloated product than one with a short firing range. The reason for this is that clays with a long firing range contain a highly viscous rather than a fluid glass at elevated temperatures. If the high viscosity is maintained after the material is partially fluid the gases formed in the process of heating do not escape, but remain trapped, forming bubbles or vesicles in the semi-molten mass.
Materials low in clay content, high in silica, and high in calcium carbonate and alkalies produce a relatively fluid mass at elevated temperatures and normally are not suitable raw materials for the production of light-weight aggregates. On the contrary such materials are exactly suited to the manufacture of a dense product.
The idea of producing a dense ceramic material from clays and silts for use as concrete aggregates, road materials, railroad ballast, and riprap was developed in the ceramics laboratory of the State Geological Survey, and the product given the name "ceramic slag" for convenience of reference. A rather detailed study of possible raw materials and methods of production was made. The results of this study are summarized in a previous Survey report (Plummer and Hladik, 1948).
Briefly, the method of production recommended consists of heating the unprocessed raw material in a rotary kiln. For some uses the material need be heated only to a temperature just above complete vitrification, or about one cone above the upper limit of the firing range given tor structural clay products in Table 4. At this temperature particles of the material are only partially agglomerated or nodulized, and if the raw material is friable a fairly high percentage of fines may be produced if special precautions are not taken. If a more angular product with large maximum sizes and no fines is required, the clay or silt is carried to a temperature at which the materials are softened with the heat and sufficiently glassy and plastic to roll into a solid cylinder or lump in the rotary kiln. The temperature required in this case is at or slightly above the pyrometric cone equivalent.
The firing range for "ceramic slag" is altogether different from that given in Table 4. In this table the firing range is intended for structural clay products which must come out of the kiln undistorted by the combination of softening by the heat and a heavy load imposed by the setting, especially in the lower courses of the kiln. The firing range for "ceramic slag" begins about one cone above the upper limit for structural clay products and extends to the pyrometric cone equivalent of the material, or slightly higher.
The ceramic properties of materials suitable for the production of "ceramic slag" are radically different from those required for brick and tile, or light-weight aggregate. For "ceramic slag" the material should have a short firing range (as interpreted for structural clay products) and a low p.e.E. Particularly, the temperature interval between complete vitrification and initial fusion should be as short as possible. This interval is in effect the firing range for "ceramic slag." If the material has a long firing range it will not become sufficiently fluid to close up the gaps between chunks of the raw material, and to squeeze out evolved gases. If such a material is carried to a sufficiently high temperature a tough vesicular product--a high grade light-weight aggregate--is produced. The tendency to bloat can be corrected to some extent by slow heating to permit complete oxidation and subsequently firing for a long period at or near the pyrometric cone equivalent of the material, taking precautions not to carry the charge much above that temperature to avoid further bloating. If a light-weight product is desired the method is reversed.
In general the Peoria silt is the unit of the Sanborn most suitable for the production of ceramic slag. Zones of lime accumulation in the Loveland and Brady soils will produce an excellent ceramic slag, but in most places are either too thin or are covered with too much overburden to be considered separately.
To judge from the data given in Table 4 the materials especially suited to the production of ceramic slag occur at the following localities: 1, 2 (upper 20 feet), 3 to 8 inclusive, 11, 17 (lower 16 feet; probably the upper 9 feet could be avoided at lower levels), and the upper 30 feet of 41. Tests designed specifically to determine the suitability of materials for ceramic slag production would doubtless reveal that most of the material at localities not specifically mentioned as suited to the production of brick and tile could be used as a ceramic slag raw material.
Next page--Data Tables, References
Kansas Geological Survey, Ceramic Utilization of Northern Kansas Pleistocene Loesses and Fossil Soils
Placed on web Feb. 11, 2013; originally published in October 1949.
Comments to webadmin@kgs.ku.edu
The URL for this page is http://www.kgs.ku.edu/Publications/Bulletins/82_3/index.html