![]()
Prev Page--Geology || Next Page--Chemical Character
Source, Occurrence, and Movement of the Ground Water
Throughout most of the land area of the earth the rock formations in a certain zone are fully saturated with water. The lower limit of this zone is found at a variable but generally great depth, below which the pressure is so great that pores capable of holding water cannot exist in the rocks. The upper surface of the zone of saturation is known as the water table, and in different places it may lie at the surface or at depths as much as several hundred feet below the surface, depending on the character or the rocks and the climate. The water in the upper part of the zone of saturation is generally replenished from precipitation, some of which reaches the water table by percolation downward through the soil. Normally the water that reaches the water table moves slowly toward the streams and discharges into them. Before all the ground water above stream level can be drained away, more water is generally added from the surface, keeping the water table somewhat above stream level in the inter-stream tracts, though fluctuating as the recharge is momentarily more or less than the discharge. Owing to the continuous process of draining and the intermittent nature of recharge, the water table is in continuous fluctuation.
The ground water in the alluvium of the Kansas and Missouri River Valleys consists largely of water that has fallen in the form of rain and snow and has percolated through the soil and subsoil materials to the water table. In areas of heavy pumping of ground water, as in parts of the Kansas River area In Kansas City, Kansas, the water table may be lower than the water surface in the river and the aquifer may receive recharge from the river.
The water in the alluvium occurs in the interstices between particles of clay, silt, sand, and gravel. The rate at which water moves through these materials depends on the hydraulic gradient, or slope of the water table, and on the size and shape of the interstices. The amount of water available for pumping also depends on the thickness of the saturated alluvium. Water moves freely through coarse gravels even under low hydraulic gradients, whereas it moves with extreme slowness through compact clay even under high hydraulic gradients. Although considerable quantities of water may move through beds of compact clay over very long periods of time, these deposits are regarded as being essentially impervious, and their importance with respect to ground water in some places is merely that they may serve as confining beds for water in adjacent beds of more permeable material.
The approximate rate of movement of the water through the gravel, sand, and silt can be obtained by application of the following formula given by Wenzel (1942, p. 71, equation 49): v = (PI / p). Where v is the average velocity of the ground water, P is the coefficient of permeability, I is the hydraulic gradient, and p is the porosity. If P is defined in Meinzer's units (gallons per day per square foot under a hydraulic gradient of 100 percent and a temperature of 60° F.), if I is given in feet per mile, and if p is given in percentage, v will be given in feet per day by the following formula: v = (PI / 365p).
The coefficient of permeability of the water-bearing material at well 16, as determined by a pumping test, is about 3,000 gallons a day per square foot. The hydraulic gradient is about 5 feet to the mile. For an assumed porosity of 30 percent the average velocity of the ground water can be computed by the above formula as follows:v = (3,000 x 5) / (395 X 30) = 1.3 feet per day.
For silt having a coefficient of permeability of 10 gallons a day per square foot and a porosity of 30 percent the ground water would have a velocity of about 0.05 inch per day under a hydraulic gradient of 5 feet to the mile.
The depths to water level in the wells and test holes that were measured during the course of this investigation are given in Table 9 and are also shown on Plate 1. The depths to water level in many of the test holes are shown on the cross sections in Plate 1 and are also given in logs of wells and test holes at the end of this report.
The water table in the Fairfax District lies from about 6 to 15 feet below the land surface, but it may be considerably lower in local cones of depression near pumped wells. In the East Armourdale and Central Districts the water table generally is about 20 to 36 feet below the land surface, but at a few local points of heavy pumping it is somewhat lower. In the West Armourdale and Argentine Districts it ranges from 12 to 27 feet below the land surface and in the valley west of Argentine it ranges from about 10 to 30 feet below the land surface. In the valley west of Argentine the depth to the water table depends more on the topography and drainage than on the utilization of ground water.
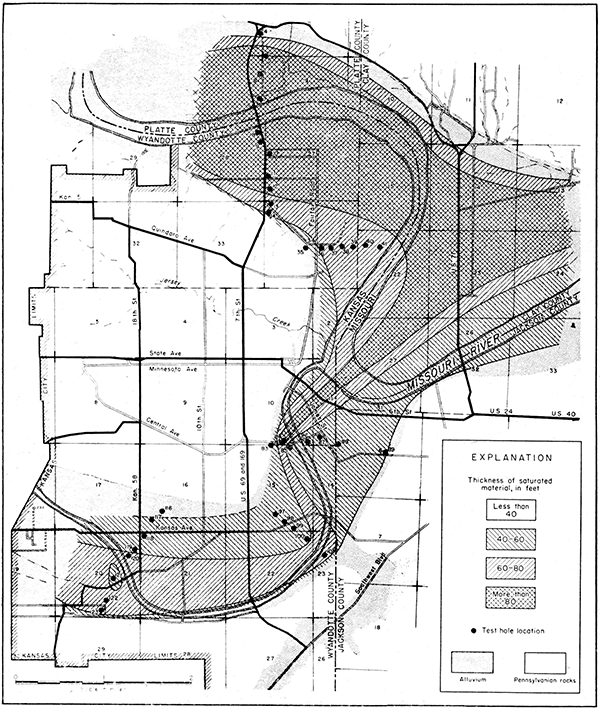
The approximate thickness of the saturated alluvium in the Kansas and Missouri River Valleys is shown in Figure 5. The Missouri Valley includes a large area having a saturated thickness of more than 80 feet, and at test hole 9 the saturated thickness is more than 100 feet. A narrow strip having a saturated thickness of more than 80 feet extends up the Kansas Valley as far as Central Avenue. Other factors being equal, the largest yields from wells would be expected in the area having a saturated thickness of more than 80 feet. Most of the alluvium in the Kansas Valley in Kansas City, Kansas, has a saturated thickness ranging from 40 to 60 feet, but in a strip extending from the Argentine District to the Missouri Valley the saturated thickness ranges from 60 to 80 feet. The thickness of the saturated alluvium decreases toward the edges of the valleys, where along narrow strips it ranges from a featheredge to 40 feet.
Figure 5--Thickness of the saturated alluvium in the Kansas and Missouri River Valleys in the Kansas City, Kansas, area.
Permeability of the Water-bearing Materials
The permeability of water-bearing materials may be determined by laboratory tests of samples of the materials, by determinations of ground-water velocity in the field, and by pumping tests made on wells that draw water from the materials.
The pumping-test method, which was the only method applied in this area, was used to determine the permeability of the alluvium in the Fairfax District. The particular technique used consists of pumping a well that penetrates water-bearing material whose permeability is to be determined, and observing the decline of the water level in several observation wells near the pumped well. The method is based on the consideration that, after approximate equilibrium is established in the shape of the water table around a pumped well, equal quantities of water move toward the well in a given unit of time through a successive series of coaxial cylindrical surfaces around the well. Because the areas of the large cylinders through which the water percolates are greater than the areas of the smaller cylinders, the velocity of the ground water passing through them is proportionately less, and the hydraulic gradients are proportionately smaller. According to Darcy's fundamental law the discharge, Q, through any of the concentric cylindrical sections of water-bearing material, is equal to PiA, and the permeability of the material, P, equals (Q / iA) where i is the hydraulic gradient at a point on the cone of depression around the discharging well and A is the area of the cylindrical surface at the point where i is determined. Wenzel (1942, pp. 77-79) presents the following formula, known as the Thiem formula, for determining the permeability of water-bearing materials:
P = [Q (loge r2 - loge r1)] / π (h22 - h12)
where Q is the discharge of the pumped well, and h1 and h2 are the thicknesses of the saturated material at two observation wells located at distances of r1 and r2, respectively, from the pumped well. In the above equation (h22 - h12) = (h2 + h1) (h2 - h1) = 2m (h2 - h1) where m is the average thickness of the saturated water-bearing material. It is taken as the average thickness of the saturated material at the observation wells after the water levels have declined to an approximate "equilibrium" condition. Then:
P = [Q (loge r2 - loge r1)] / 2π m (h2 - h1)
If the rate of pumping is given in gallons a minute and the logarithms are converted to base 10, the above formula for the permeability in Meinzer's units becomes:
P = [527.7q (log10 r2 - log10 r1)] / m (h2 - h1)
= (527.7q Δ log10 r) / (m Δ h)
The coefficient of permeability as defined by Meinzer is expressed as the number of gallons of water a day, at 60° F., that is conducted laterally through each mile of the water-bearing bed under investigation (measured at right angles to the direction of flow) for each foot of thickness of the bed, and for each foot per mile of hydraulic gradient (Stearns, 1927, p. 148). The value of (Δ log10 r) / (Δ h) is obtained by making use of the straight line relation that exists when the altitudes or drawdowns of the water levels in the observation wells are plotted on a linear scale against the distances of the observation wells from the pumped well on a logarithmic scale. The value of (Δ log10 r) / (Δ h) is given by the slope of the straight line. If values of (Δ log10 r) / (Δ h) are selected from the straight line with values of r between 10 and 100 feet (or between 100 and 1,000 feet), (Δ log10 r) becomes unity, and the formula becomes: P = (527.7q) / (m Δ h).
Pumping tests were made on well 16 (Pl. 1) by the Corps of Engineers, U. S. Army, during January and February, 1944, and on well 49 (plant well 6) at the Phillips Petroleum Company by Layne-Western Company in July 1941.
Pumping Test on Well 16
A series of pumping tests was made on well 16 (Pl. 3) by the Corps of Engineers in January and February, 1944. The data for these tests were kindly made available by the Corps of Engineers. The well is located about 350 feet east of the south end of the bridge across the Missouri River on U. S. Highways 69 and 169 and about 160 feet (south) from the landward toe of the levee along Missouri River. Well 16 was constructed especially for these tests and was later filled in. It was drilled to a depth of 95 feet and was cased with 12-inch porous concrete drain tile. The saturated alluvium was about 105 feet thick at the well.
Plate 3--A, Pumping test on well 16 in the Fairfax District, facing east from the bridge on U. S. Highways 69 and 169. B, Close-up view showing tops of three observation wells that are located at each point and the electrical apparatus for measuring the water levels.
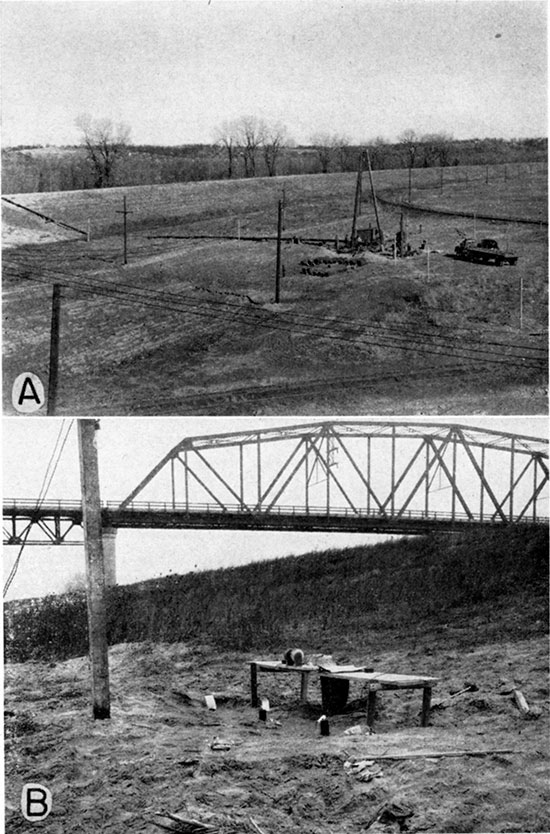
Thirty-eight observation wells were constructed along three equally spaced radial lines (A, B, and C) extending out from the pumped well. Line A extended to the north and was perpendicular to the river, line B extended to the southeast, and line C extended to the southwest. The observation wells in each line were located at distances of 5, 15, 35, 75, and 155 feet from the pumped well. The observation wells at each of these points were sunk to three different depths roughly representing penetrations of 25, 50, and 75 percent of the saturated thickness (Pl. 3). The pumped well penetrated approximately 70 percent of the saturated thickness, and a series of pumping tests was performed using the well at this depth. Then the well was plugged at several depths in succession, and the tests repeated at each of these depths to determine the effects of the partially penetrating well. Each series of tests included pumping the well at different discharge rates until the water levels in the observation wells reached equilibrium. The altitudes of the water levels for approximate equilibrium conditions in the observation wells having a penetration of 50 percent are given in Table 2 for 14 of the tests.
Table 2--Altitudes of water levels in observation wells during pumping test on well 16. (Add 720 to the altitudes given below to convert them to feet above mean sea level.)
| Test No. | 1 | 2 | 3 | 4 | 5 | 8 | 9 | 10 | 11 | 14 | 15 | 16 | 17 | 18 | |
|---|---|---|---|---|---|---|---|---|---|---|---|---|---|---|---|
| Date, 1944 | Jan. 23 | Jan. 23 | Jan. 24 | Jan. 24 | Jan. 26 | Feb. 1 | Feb. 8 | Feb. 9 | Feb. 9 | Feb. 15 | Feb. 16 | Feb. 17 | Feb. 18 | Feb. 18 | |
| Time | 8:00 a. m. |
6:00 p. m. |
8:00 a. m. |
11:59 p. m. |
9:30 a. m. |
11:59 p. m. |
6:00 p. m. |
10:00 p. m. |
11:59 a. m. |
10:00 p. m. |
2:00 p. m. |
11:59 p. m. |
8:00 a. m. |
2:00 p. m. |
|
| Rate of pumping (gallons a minute) |
415 | 610 | 850 | 400 | 745 | 250 | 160 | 235 | 90 | 270 | 285 | 395 | 585 | 775 | |
| Well No. | (r) (feet) |
Altitude of water levels | |||||||||||||
| 3A | 5 | 5.74 | 5.14 | 4.31 | 5.64 | 5.54 | 7.35 | 7.22 | 6.83 | 7.50 | 4.67 | 4.08 | 4.07 | 3.28 | 2.48 |
| 5A | 15 | 6.12 | 5.68 | 5.13 | 6.28 | 6.44 | 7.67 | 7.42 | 7.16 | 7.57 | 5.07 | 4.63 | 4.40 | 3.84 | 3.40 |
| 7A | 35 | 6.36 | 6.14 | 5.77 | 6.60 | 6.96 | 7.83 | 7.53 | 7.36 | 7.61 | 5.33 | 4.95 | 4.68 | 4.28 | 3.88 |
| 10A | 75 | 6.71 | 6.44 | 6.33 | 6.93 | 7.58 | 8.27 | 7.75 | 7.64 | 7.93 | 5.53 | 5.17 | 4.76 | 4.54 | 4.33 |
| 13A | 155 | 6.92 | 6.76 | 6.83 | 7.24 | 7.97 | 8.23 | 7.87 | 7.78 | 7.78 | 5.27 | 4.93 | 4.84 | 4.48 | 4.35 |
| 14C | 5 | 5.89 | 5.37 | 4.53 | 6.68 | 5.77 | 7.37 | 7.15 | 6.77 | 7.42 | 4.73 | 4.13 | 3.88 | 3.18 | 2.50 |
| 16C | 15 | 6.15 | 5.76 | 5.24 | 6.35 | 6.22 | 7.65 | 7.35 | 7.13 | 7.47 | 5.10 | 4.70 | 4.24 | 3.62 | 3.12 |
| 18C | 35 | 6.35 | 6.10 | 5.73 | 6.76 | 6.82 | 7.73 | 7.38 | 7.21 | 7.56 | 5.28 | 4.88 | 4.50 | 4.03 | 3.69 |
| 20C | 75 | 6.59 | 6.42 | 6.21 | 6.84 | 7.25 | 8.00 | 7.58 | 7.46 | 7.64 | 5.67 | 5.25 | 4.80 | 4.44 | 4.20 |
| 23C | 155 | 6.78 | 6.68 | 6.77 | 6.98 | 7.56 | 8.12 | 7.67 | 7.42 | 7.70 | 5.82 | 5.43 | 5.22 | 5.02 | 4.84 |
| 26B | 5 | 5.93 | 5.42 | 4.68 | 5.92 | 5.84 | 7.15 | 7.17 | 6.82 | 7.42 | 4.80 | 4.24 | 4.10 | 3.38 | 2.74 |
| 28B | 15 | 6.12 | 5.81 | 5.30 | 6.30 | 6.44 | 7.63 | 7.36 | 7.14 | 7.52 | 5.18 | 4.70 | 4.34 | 3.80 | 3.40 |
| 30B | 35 | 6.34 | 6.13 | 5.80 | 6.62 | 6.89 | 7.82 | 7.44 | 7.30 | 7.54 | 5.43 | 5.00 | 4.56 | 4.14 | 3.84 |
| 32B | 75 | 6.48 | 6.37 | 6.14 | 6.76 | 7.06 | 7.90 | 7.50 | 7.40 | 7.55 | 5.57 | 5.15 | 4.80 | 4.49 | 4.26 |
| 358 | 155 | 6.66 | 6.60 | 6.50 | 6.88 | 7.34 | 8.00 | 7.54 | 7.48 | 7.54 | 5.90 | 5.53 | 5.18 | 4.96 | 4.82 |
The altitudes of the water levels for each test given in Table 2 were plotted on semilogarithmic paper against the distances of the observation wells from the pumped well as shown on Figure 6 for test 1. The altitudes of the water level for r at distances of 10 and 100 feet were obtained from the straight lines. The difference in altitude at distances of 10 and 100 feet is equal to Δh in the above equation for computing the coefficient of permeability. The coefficients of permeability were computed for each line of wells for each test and are given in Table 3. The average thickness of the saturated material at the observation wells during the pumping tests was variable but was approximately 100 feet. The error involved in using the approximate thickness of 100 feet is inappreciable compared to the probable errors caused by the change in stage of the river and the partial penetration of the pumped well. The average coefficient of permeability of 3,030 gallons a day per square foot given in Table 3 is believed to be of the right order of magnitude, but. it. may be somewhat. low due to only partial penetration of the pumped well.
Figure 6--Altitude of water levels plotted against the distance of the observation wells from the pumped well during the test on well 16.
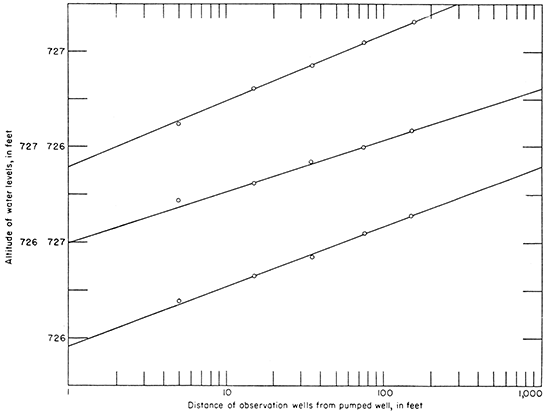
Table 3--Coefficients of permeability computed for well 16 in the Fairfax District
| Test No. |
Rate of pumping (gallons a minute) |
Penetration (percent) |
Stage of river (feet above sea level) |
Coefficient of permeability (g pd/sq. ft.) (a) |
|||
|---|---|---|---|---|---|---|---|
| Line | |||||||
| A | B | C | Average | ||||
| 1 | 415 | 68 | 728.0 | 3,165 | 4,040 | 3,410 | 3,540 |
| 2 | 610 | 68 | 728.3 | 3,025 | 4,160 | 3,525 | 3,570 |
| 3 | 850 | 68 | 728.3 | 2,990 | 3,740 | 3,370 | 3,370 |
| 4 | 400 | 52 | 729.5 | 2,180 | 3,585 | 4,410 | 3,390 |
| 5 | 745 | 52 | 730.2 | 2,480 | 4,330 | 2,985 | 3,265 |
| , 8 | 250 | 37 | 728.5 | 2,235 | 3,990 | 2,395 | 2,870 |
| 9 | 160 | 37 | 728.1 | 1,875 | 4,965 | 2,280 | 3,040 |
| 10 | 235 | 37 | 728.1 | 1,900 | 4,750 | 2,940 | 3,195 |
| 11 | 90 | 37 | 728.1 | 1,450 | 6,630 | 1,935 | 3,340 |
| 14 | 270 | 52 | 724.8 | 1,980 | 2,005 | 1,950 | 1,980 |
| 15 | 285 | 52 | 724.2 | 1,660 | 1,775 | 1,605 | 1,680 |
| 16 | 395 | 68 | 723.7 | 4,065 | 3,190 | 2,230 | 3,160 |
| 17 | 585 | 68 | 3,035 | 3,400 | 2,645 | 3,025 | |
| 18 | 775 | 68 | 723.5 | 3,125 | 3,330 | 2,610 | 3,020 |
| Average | 2,510 | 3,850 | 2,730 | 3,030 | |||
| (a) The coefficient of permeability is given for a temperature of 53° F. which was the temperature of the ground water at the time of the test. |
|||||||
Pumping Test on Well 49
Well 49 (Plant well 6) at the Phillips Petroleum Company was drilled by the Layne-Western Company in July 1941. It is 85.8 feet deep and has a diameter of 26 inches. Five observation wells were drilled on a line running north-northeast and south-southwest through the well. The line of wells makes an angle of about 20 degrees with a line running north and south through well 49. A pumping test was made by the Layne-Western Company on July 11, 1941, and the data from this test were kindly made available by the Layne-Western Company. Water-level and discharge measurements made during the pumping test are given in Table 4.
Table 4--Depths to water level and discharge measurements made during the pumping test on well 49 on July 11, 1941
| Well No. | 49 | 49A | 49B | 49C | 49D | 49E | |
|---|---|---|---|---|---|---|---|
| Direction from well 49 | NNE | SSW | SSW | SSW | SSW | ||
| Distance from well 49 (feet) |
250 | 240 | 470 | 690 | 935 | ||
| Time | Rate of pumping (gallons a minute) |
Depth to water level (feet) | |||||
| 12:30 p.m. | 0 | 17.00 | 15.58 | 17.79 | 18.08 | 20.87 | 20.25 |
| 1:30 p.m. | 980 | 32.17 | 16.17 | 18.25 | 18.12 | 20.87 | 20.25 |
| 2:30 p.m. | 1,000 | 35.00 | 16.33 | 18:37 | 18.23 | 20.90 | 20.25 |
| 3:30 p.m. | 1,000 | 35.00 | 16.46 | 18.46 | 18.25 | 20.90 | 20.25 |
| 4:30 p.m. | 1,000 | 35.00 | 16.58 | 18.54 | 18.29 | 20.90 | 20.25 |
| 5:30 p.m. | 1,000 | 35.00 | 16.67 | 18.60 | 18.37 | 20.92 | 20.25 |
| 6:30 p.m. | 1,000 | 35.00 | 16.71 | 18.67 | 18.42 | 20.92 | 20.25 |
Figure 7--Drawdowns of water levels plotted against the distance of the observation wells from the pumped well during the test on well 49.
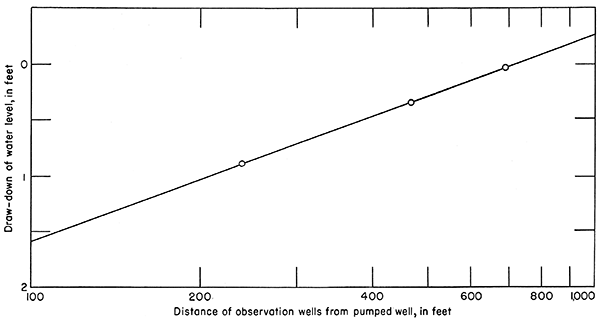
The drawdowns of the water level at 6:30 p. m. in wells 49B, 49C, and 49D are plotted in Figure 7 against the distances of the observation wells from the pumped well. From Figure 7 it is found that the change in drawdown (Δs) over one cycle of the semilogarithmic paper is 1.81 feet. The rate of pumping (q) was 1,000 gallons a minute, and the thickness (m) was about 86.6 feet. Substituting these values in the formula we obtain:
P = (527.7 X 1,000) / (86.6 X 1.81) = 3,370 gallons per day per sq. ft.
The temperature of the water at the time of the pumping test was not determined; hence no correction was made in the above computation for temperature. The two pumping tests indicate that the water-bearing materials in the Fairfax District have a permeability of somewhat more than 3,000 gallons a day per square foot. Coefficients of permeability of less than 100 are said to be low, coefficients between 100,and 1,000 are said to be medium, and coefficients above 1,000 are considered as being high. Hence, the water-bearing materials in the Fairfax District are very permeable.
Yield of Wells
The yield of a well depends upon the well construction, the permeability of the water-bearing materials, the thickness of the saturated water-bearing materials, and the source of recharge. As soon as a pump begins discharging water from a well, a hydraulic gradient is established from all directions toward the well and the water table is lowered around the well. The water table soon assumes a form comparable to an inverted cone. Some water-bearing material will be dewatered by the decline of the water table and the water drained from this material will percolate to the pumped well. Thus, for a short time after pumping begins most of the water that is pumped from a well comes from the dewatered sediments comparatively close to the pumped well. As pumping continues a hydraulic gradient that is essentially an equilibrium gradient will be established close to the pumped well and water will be transmitted to the well through the water-bearing material in approximately the amount that is being pumped.
The construction of wells in the Kansas and Missouri River Valleys controls to a large extent their yields. Most of the wells constructed in recent years are of the gravel-pack type and are about 16 inches in diameter. A well of this type maintains a high yield over a period of several years only if the well is properly constructed so that the gravel-pack and screen do not become clogged with fine sand, thereby largely shutting off the movement of water into the well.
The ground water in the Kansas and Missouri Valleys contains a high amount of iron and carbonates (see Quality of Water); hence it may be that some of the wells fail after prolonged pumping as a result of encrustation formed on the screens by these substances. Aeration of the water-bearing materials within the cone of depression during periods of excessive rates of pumping may result in a precipitation of the iron and carbonates which would deposit on the screen and tend to clog the interstices in the sand and gravel near the screen. Several wells in the Kansas and Missouri Valleys in Kansas City and vicinity whose yields had declined over a period of years have been acidized with very successful results. The yields of several of the wells were more than doubled by acidization and the yield of one well was increased from 45 gallons a minute before acidization to 280 gallons a minute after acidization.
The specific capacity of a well is its rate of yield per unit of drawdown, and is usually stated in gallons a minute per foot of drawdown. For example, well 23, one of the wells at North American Aviation Company, Incorporated, was reported to yield 1,500 gallons a minute with a drawdown of about 5 feet. Its specific capacity, therefore, is about 300 gallons a minute per foot of drawdown,
The yields of 51 wells and the drawdowns for most of these wells are given in Table 9. Twenty-two of the wells are in the Missouri River Valley and twenty-nine are in the Kansas Valley. The wells in the Missouri Valley have an average yield of 980 gallons a minute and an average specific capacity of 60. The saturated water-bearing materials in the Missouri Valley are thicker and more permeable than those in the Kansas Valley; hence the wells in the Missouri Valley would be expected to have greater specific capacities. The greater specific capacities of the wells in the Fairfax District is also due to better and more modern methods of well construction.
Prev Page--Geology || Next Page--Chemical Character
Kansas Geological Survey, Geohydrology
Placed on web Oct. 4, 2016; originally published February 1948.
Comments to webadmin@kgs.ku.edu
The URL for this page is http://www.kgs.ku.edu/Publications/Bulletins/71/05_gw.html