Previous--Cheyenne Bottom Basin--Geophysical Study || Next--Garfield Prospect, Lippelmann Field, Decatur County, Kansas
1Kansas Geological Survey and 2Normandy Exploration Limited
This article available as an Acrobat PDF file (6 Mb).
Seismic reflection can be effectively used in east-central Kansas to delineate subsurface features significant to hydrologists, petroleum geologists, and petroleum engineers. Eight high-resolution seismic lines were acquired within a three-county area in east-central Kansas. Dominant frequencies of reflections from this area ranged from 140 to 350 Hz, yielding vertical resolution limits between 1 m and 3 m (3.3 ft to 10 ft) to depths in excess of 200 m (656 ft). Synthetic seismic traces and well geology were incorporated into interpretations of reflection events. Seismic data from the east, north, and west portions of the study area are of excellent quality and can be correlated with the synthetic seismograms and from line to line based on wavelet character and reflection-time intervals.
Seismic reflection surveys have been successfully used to delineate subsurface features relevant to petroleum exploration for nearly 70 years. The effective use of the technique for shallow applications depends on several key conditions. The most critical is the existence of acoustic velocity and/or density contrasts in the subsurface. The second relates to the ability of the near-surface to propagate high-frequency seismic signals. Finally, the acquisition parameters and recording equipment must be compatible with the proposed target, resolution requirements, and environmental constraints of the survey. Recent developments associated with the use of the technique to evaluate environmental sites have enhanced the potential of the technique for cost-effective application throughout Kansas (Steeples and Miller, 1990).
Shallow, high-resolution seismic-reflection profiles can be useful both in characterizing shallow structures or anomalies and extending features identifiable in outcrop and surface excavation into the upper several hundred meters of the subsurface. The high-resolution seismic-reflection method has only recently developed into a practical and effective tool for identifying shallow (<100 m; 328 ft) structures (Hunter et al., 1984; Jongerius and Helbig, 1988; Treadway et al., 1988; Miller et al., 1989, 1990; Gochioco and Cotten, 1989; Miller and Steeples, 1991; Goforth and Hayward, 1992). The shallow seismic-reflection' technique is inexpensive (compared to drilling) and can increase the horizontal resolution and often decrease the number of drillholes by an order of magnitude. Seismic reflection is an extremely effective technique for detecting faults and interpreting stratigraphic relationships; depth can only be estimated and lithologies only inferred without confirmation drilling, however.
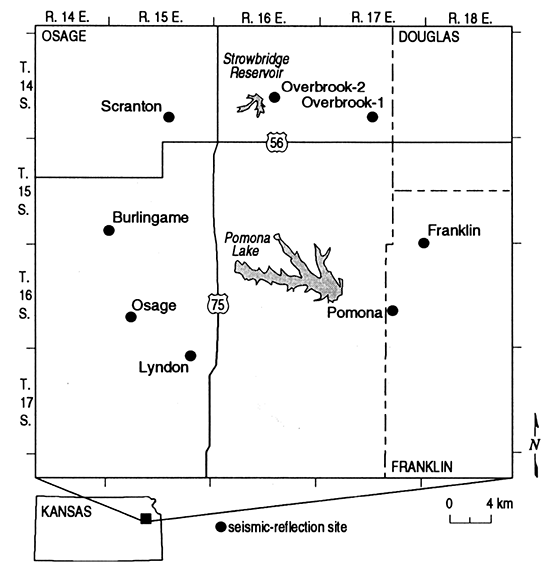
High-resolution CDP seismic-reflection data were collected at eight different sites in east-central Kansas to determine stratigraphic consistency and appraise resolution potential of the technique (fig. 1). The seismic lines possessed data with varying signal-to-noise ratios as well as dominant-frequency content. Correlation and analysis of the interpreted reflecting events from line to line was similar to single-point seismic techniques (McGuire and Miller, 1989). The lines were all CDP-processed in a consistent fashion to enhance any wavelet characteristics unique to particular geologic interfaces. The consistent character and frequency of the seismic energy recorded in this area and the synthetic seismogram allowed extensive stratigraphic interpretations and confident correlation between the various seismic lines.
Figure 1--Site map of study area with the eight seismic-profile locations indicated.
Cyclic Upper and Middle Pennsylvanian limestone and shale sequences with minor sandstone units dominate the study area (fig. 2). These units are characteristic of the transgressive-regressive "Kansas" cyclothems that resulted from the rise and fall of sea level over the northern midcontinent shelf during Early to Middle Pennsylvanian time (Heckel, 1988).
Figure 2--Lithologic section, depths are from Osage City #4 drill hole.
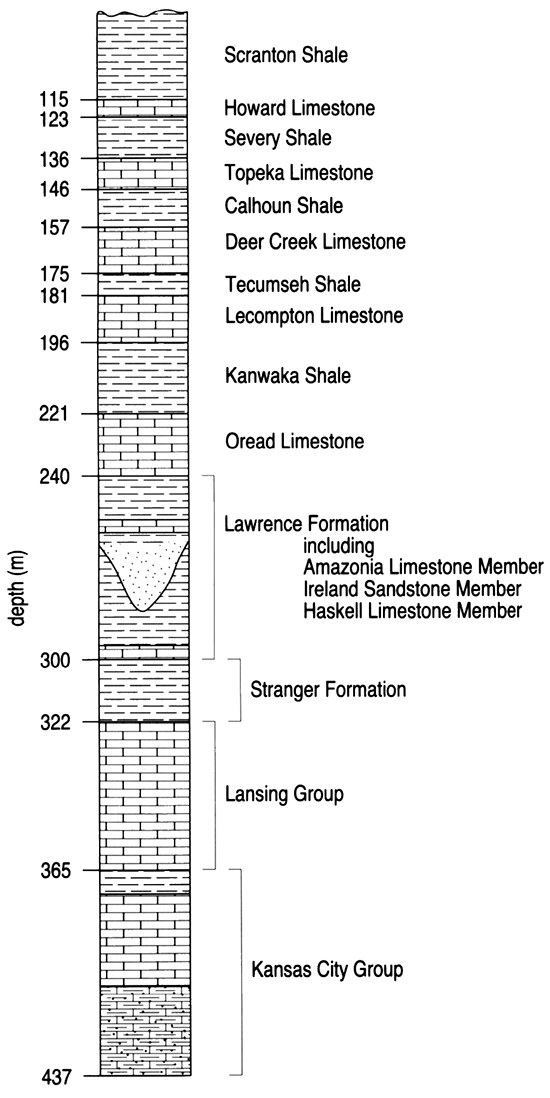
The uppermost stratigraphic unit identified as a seismic reflector in this study is the Deer Creek Limestone. It occurs near the middle of the Upper Pennsylvanian Shawnee Group, and is primarily limestone, but consists of a series of alternating limestones and shales. Moving stratigraphically downward in the Shawnee Group, the Tecumseh Shale, the Lecompton Limestone, the Kanwaka Shale, and the Oread Limestone continue this cyclic limestone-shale-limestone pattern (O'Conner, 1955; Ball et al., 1963; Zeller, 1968). The Lecompton and Oread Limestone formations provide good seismic reflectors in this study area (fig. 3).
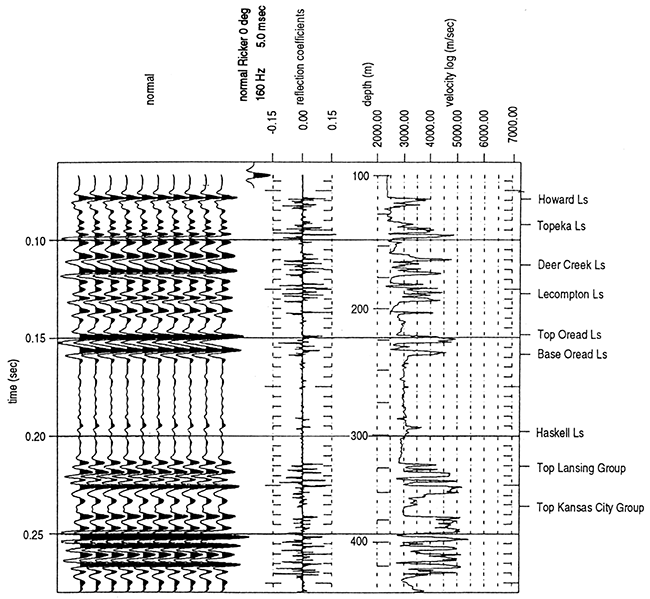
Figure 3--Synthetic seismogram from Osage City #4 acoustic-velocity log.
The Douglas Group, consisting of the upper Lawrence Formation and the lower Stranger Formation, is stratigraphically below the Shawnee Group. It does not have the internal cyclic character of the overlying Shawnee Group described above. It is primarily shale and channel sandstones with minor limestone and coal beds (O'Connor, 1955; Ball et al., 1963; Zeller, 1968). The Amazonia Limestone, the Ireland Sandstone, and the Haskell Limestone members provide identifiable seismic reflectors within the Lawrence Formation (fig. 4). No reflectors were identified within the Stranger Formation.
Figure 4--Interpreted 12-fold seismic-reflection profile from near Scranton, Kansas. The reflection from the Oread is at approximately 92 msec (110 m) and the reflection from the base of the Lawrence is at approximately 140 msec (168 m).
The next lower group in the stratigraphic column is the Lansing Group. It is primarily limestone but has the internal cyclic limestone-shale character similar to the Shawnee Group described above. It consists of, from top to bottom, the Stanton Limestone, the Vilas Shale, and the Plattsburg Limestone (O'Connor, 1955; Ball et al., 1963; Zeller, 1968). The Lansing Group results in an identifiable group of seismic reflections in this study area (fig. 3).
As we move down the stratigraphic column, the Kansas City Group is a cyclic package of limestones, shales, and sandstones. From top to bottom it consists of the Bonner Springs Shale, the thick Wyandotte Limestone, the Lane Shale, the lola Limestone, the Chanute Shale, the Drum Limestone, the Cherryvale Shale, the Dennis Limestone, the Galesburg Shale, the Swope Limestone, the Ladore Shale, and the Hertha Limestone (O'Connor, 1955; Ball et al., 1963; Zeller, 1968). The alternating limestones and shales result in an identifiable group of reflectors shown in fig. 3.
Below the Kansas City Group, at the base of the Upper Pennsylvanian Series is the Pleasanton Group, which is primarily shales and sands (O'Connor, 1955; Ball et al., 1963; Zeller, 1968). No reflectors have been identified from within the Pleasanton Group.
Below the Pleasanton is the Marmaton Group, which occurs at the top of the Middle Pennsylvanian Series. The Marmaton Group consists of alternating limestones, shales, and sandstones (O'Connor, 1955; Ball et al., 1963; Zeller, 1968). Seismic reflectors interpreted to be from within the Marmaton occur at the east end of the study area.
The sedimentary section described above has a gentle 10 dip to the west-northwest. This results in the observation of stratigraphically higher reflectors to the west and lower to the east. Superimposed on this gentle westward dip is the topographic relief of the study area. A maximum 300 ft (91 m) of relief from ridge tops to valley floors occurs in the area (Wilson et al., 1986). The observed seismic sections are a function of the east-west position within the study area and the local elevation of the survey line.
All data were acquired with an I/O DHR-2400 seismograph. The 24-channel data were analog filtered, amplified, AID converted (11 bits plus sign), and recorded on 9-track magnetic tape in a demultiplexed format. Generally, two shots were recorded at 1/4-msec sampling interval (2,000-Hz alias frequency) with a total listening time of 250 msec at each shot location. The 36 dB/octave roll-off analog low-cut filters selected during acquisition have at the -3 dB point a dominant frequency from 220 to 340 Hz depending on the specific site characteristics and depth of interest. The selection of the analog low-cut filters was based on dominant and maximum reflection frequencies recorded during walkaway-noise testing.
Selection of the type, number, orientation, and spacing of sources and receivers for each line was intended to maximize recorded data and its resolution potential while maintaining as much consistency as possible in wavelet characteristics. Data for this study were recorded with two single Mark Products L-40A 100-Hz geophones wired in series and planted in a small (< 1-m; 3.3-ft) inline array. Modified .30-06 and .50-caliber hunting rifles were used as projectile energy sources. Subterrain detonation of these rifles increased ground coupling and reduced air-coupled waves. Determination of the appropriate energy source was based on target depth and surface conditions (i.e., attenuation). The source and receiver station spacing was optimized according to each site's target-depth range and near-surface velocity. All the seismic data presented here were collected over a two-week period.
The 24-channel seismic-reflection data were processed into 12-fold CDP stacked sections using algorithms and a processing flow designed to enhance the high-frequency portion of the seismic traces. The critical steps in the processing flow include first-arrival muting, air-blast muting, bad-trace editing, common-depth-point (CDP) sorting, bandpass filtering, automatic surface-consistent statics, normal moveout velocity correction, Automatic Grain Control (AGC) trace scaling, and CDP stacking. Each seismic line was processed individually with the order and parameters selected for each of the previous steps optimized for each line.
Unique data characteristics, related to near-surface conditions on certain lines, required specific processing techniques to enhance reflections and improve line-to-line correlations. Some of the line-specific techniques used included trace mixing (whole CDPs), auto-shaping deconvolution, autopredictive deconvolution, time-varying filtering, and predictive deconvolution. These techniques were used conservatively to retain as much consistency between lines as possible.
The final stacked sections used for interpreting the subsurface geology have signal-to-noise ratios that allow confident and consistent correlation of reflections from section to section and from actual traces to synthetic traces (derived from geophysical well logs). The dominant frequency of the unprocessed field data varies from 140 to 350 Hz, depending on site characteristics and recording parameters. Reflections are interpreted on the seismic sections and correlated to either group, formation, or member based on signal-to-noise ratios and resolution. Reflections or apparent reflections not correlated to particular geologic interfaces do not have high confidence matches with the synthetic seismic traces and/or the stratigraphic column from this area. Reflections interpreted on stacked seismic sections equate to geologic interfaces that range from the base of the Deer Creek Limestone (Shawnee Group) to below the base of the Kansas City Group, possibly within the Marmaton Group (fig. 2).
Seismic-reflection events interpreted to represent significant geologic features are enhanced on the seismic sections (figs. 4-10). Specific groups, formations, or members were correlated to reflection arrivals based on time/depth, wavelet characteristics, surrounding reflection events, and drill/log data. A synthetic seismogram was generated using the acoustic-velocity log from the Osage City #4 drillhole located to the west and downdip of the survey area (sec. 4, T. 15 S., R. 13 W; fig. 3). Interpretations are intended to highlight orientation and stratigraphic features of reflectors within the upper 350 m in this area. Correlating seismic data with minimal well control, significant distance between lines, and no acoustical marker horizons forced strong dependence on matching of acoustic properties.
Figure 5--Interpreted 12-fold seismic-reflection profile from near Burlingame, Kansas. The reflection from the base of the Lawrence is at approximately 89 msec (105 m) and the reflection from the top of the Lansing Group is at approximately 125 msec (150 m).
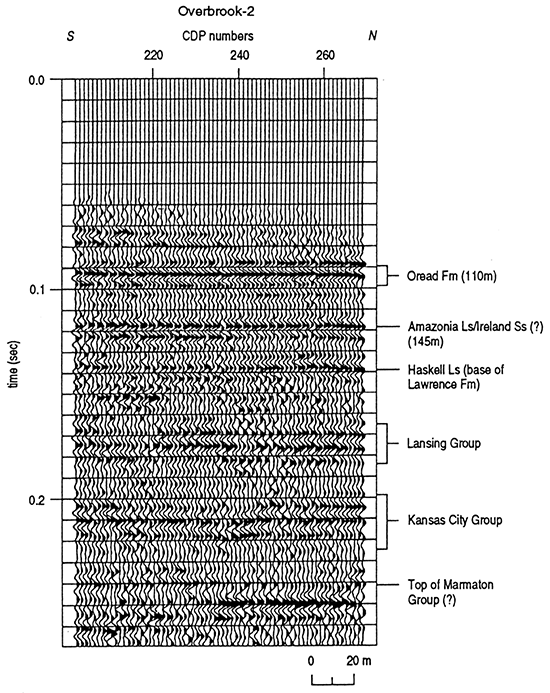
The Overbrook-2 seismic line possesses several localized geologic features (fig. 4). Several strong reflecting events are present between 80 and 250 msec. An unidentified reflection at about 80 msec dips about 50 to the north relative to the flat-lying Oread Formation at about 90 msec. Two subtle erosional/depositional features can be interpreted in reflections between 130 and 220 msec. A 2-msec high in the Haskell Limestone at about CDP 260 represents about a 2-2.5-m (6.6-8.2-ft)-change in elevation over a distance of slightly more than 25 m (82 ft). A 1-msec channel in the top of the Kansas City Group is present at CDP 235 and equates to a cut about 1.5 m (5 ft) deep and 35 m (115 ft) across. Dominant frequency of data on this line is approximately 175 to 200 Hz, which suggests vertical resolution of about 1.5 m to 2 m (5 ft to 6.6 ft). The cyclic nature of the reflecting events is very consistent with the regional geology as determined by drilling and outcrop studies (Heckel et al., 1979).
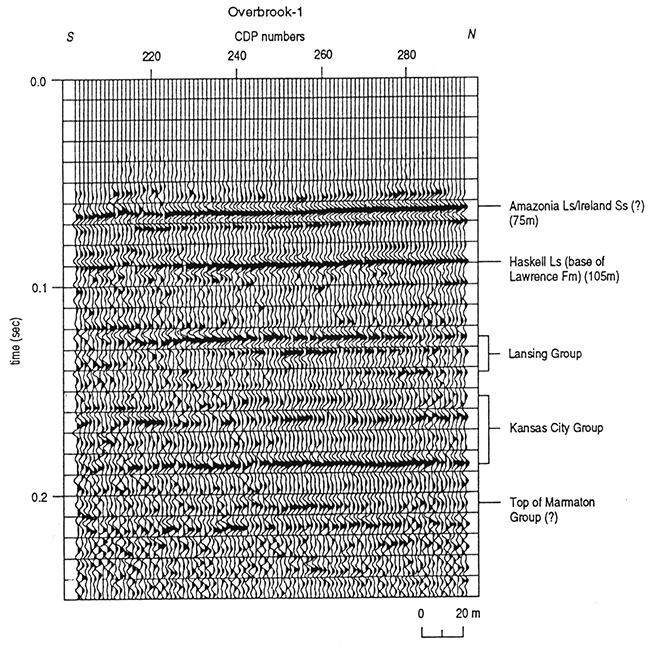
The Overbrook-1 seismic line has a slightly lower dominant frequency than Overbrook-2 but contains a potential erosional/depositional feature at the contact between the Lansing and Kansas City Groups. Gentle undulations in the Amazonia Limestone (75 m; 246 ft) and the Haskell Limestone (105 m; 345 ft) are evident above the top of the Lansing Group. Erosional features at the base of the Ireland Sandstone on the south end of the line can be inferred at approximately 85 msec. An apparent lens or pinch-out between units within the Lansing Group and the top of the Kansas City Group can be interpreted between CDP 200 and 240 at a depth of about 150 msec. The feature appears to be the result of erosion of the top of the Kansas City and subsequent deposition and eventual channel filling. The feature has expression at the basal contact of the Lansing Group and is thickest (~15 m; 49 ft) at the southernmost end of the line. The minimum vertical resolution potential of this data set is about 2.5-3 m (8-10 ft).
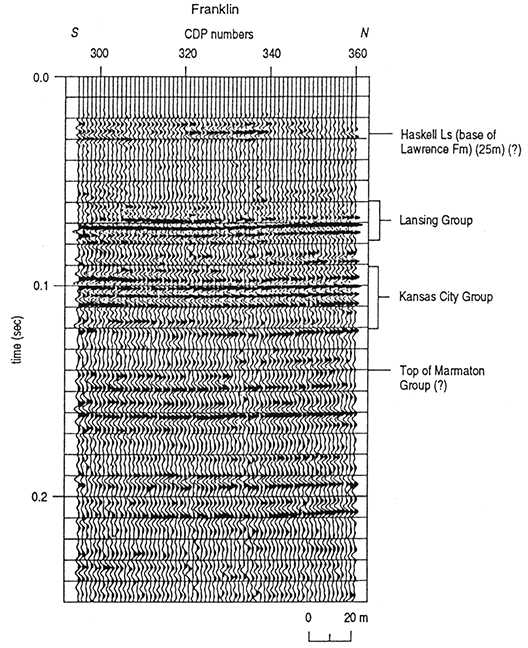
The Franklin seismic line is stratigraphically lower in the section and possesses the greatest resolution potential of all the lines acquired (fig. 6). Reflections across the entire section are relatively flat with little indication of either structural or stratigraphic change or anomalies. The shallowest reflection is probably from the Haskell Limestone (25 m; 82 ft). A thick section of Tonganoxie Sandstone (within the Stranger Formation) present on this line just beneath the Haskell Limestone is not evident in this quantity on any of the other seven lines. This could be a large channel feature. Between the top of the Marmaton Group and the basal contact of the Kansas City Group, a pinch-out can be interpreted. This line possesses resolution potential of less than 1 m in certain parts of the section.
Figure 6--Interpreted 12-fold seismic-reflection profile from near Lyndon, Kansas. The reflections at approximately 70 msec (80 m) are interpreted to be from the Lansing Group and the reflections at approximately 100 msec (120 m) are interpreted to be from the Kansas City Group.
The Pomona section lacks the high signal-to-noise ratio in the upper 100 msec of the record present on other data from this study (fig. 7). The top of the Kansas City Group is the first quality reflection interpretable on the seismic section. The shallower reflections (top of the Lansing Group and the Haskell Limestone) did not stack in as a direct result of a limestone layer very close to the ground surface that adversely affected the seismic energy. As with the Franklin section, little variation can be observed across the section. The maximum potential resolution within the Kansas City Group on this section is about 2 m (6.6 ft).
Figure 7--Interpreted 12-fold seismic-reflection profile from near Overbrook, Kansas. The reflection from the base of the Lawrence is at approximately 40 msec (45 ft) and the reflection from the top of the Kansas City Group is at approximately 80 msec (100ft).
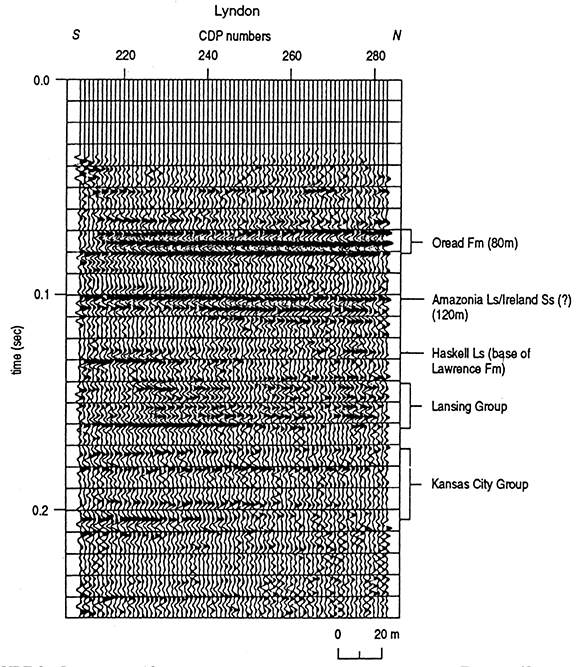
Stratigraphic changes can be observed within several units on the Lyndon seismic section (fig. 8). Thinning can be interpreted at the top of the Oread Formation (65 msec), top of the Lansing to base of the Haskell (130 msec), base of the Lansing to top of the Kansas City (165 msec), and within the Kansas City Group (200 msec). There appears to be a regional 10 dip in reflecting events on this line. The minimum vertical resolution on this line is about 1-1.5 m (3.3-5 ft),
Figure 8--Interpreted 12-fold seismic-reflection profile from near the Franklin/Osage County, Kansas, boundary. the reflection from the base of the Oread is at approximately 80 msec (100 m) and the reflection from the base of the Lawrence is at approximately 127 msec (150 m).
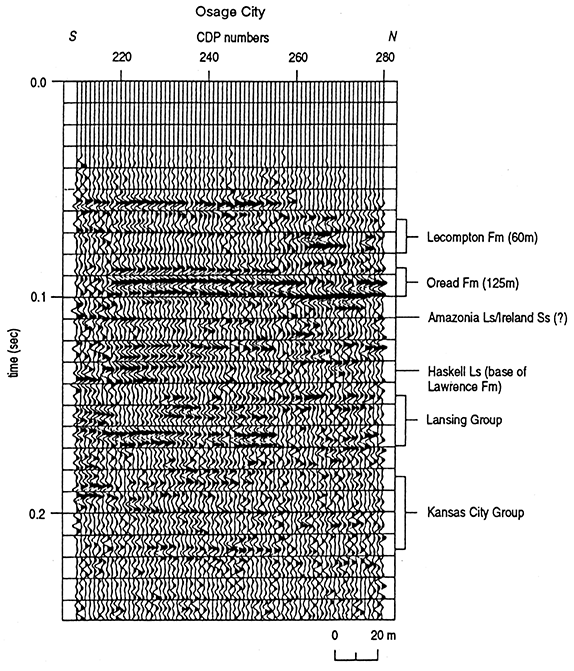
The Osage City seismic line is structurally/stratigraphically the most variable (fig. 9). A very well defined lens/pinch-out/channel can be interpreted at the base of the Oread Formation within what is identified as the Amazonia Limestone or Ireland Sandstone. The channel within the Amazonia Limestone/Ireland Sandstone is the most significant feature of its type delineated during this study. The channel appears to be 150-200 m (492-656 ft) across with a maximum depth of 5-7 m (16-23 ft). Several stratigraphic anomalies are present within the Lansing Group. Subtle undulating beds are evident within the Kansas City Group between CDP 225 and 250 at a depth of 210 msec. The apparent dip or pull-up on the north end of the line is probably related to low fold and uncompensated near-surface static. The maximum vertical resolution on this line is 1-1.5 m (3.3-5 ft).
Figure 9--Interpreted 12-fold seismic-reflection profile 1 mi (1.6 km) east of Osage City, Kansas. The reflection from the base of the Oread is at approximately 100 msec (120 m) and the reflection from the base of the Lawrence is at approximately 134 msec (160 m).
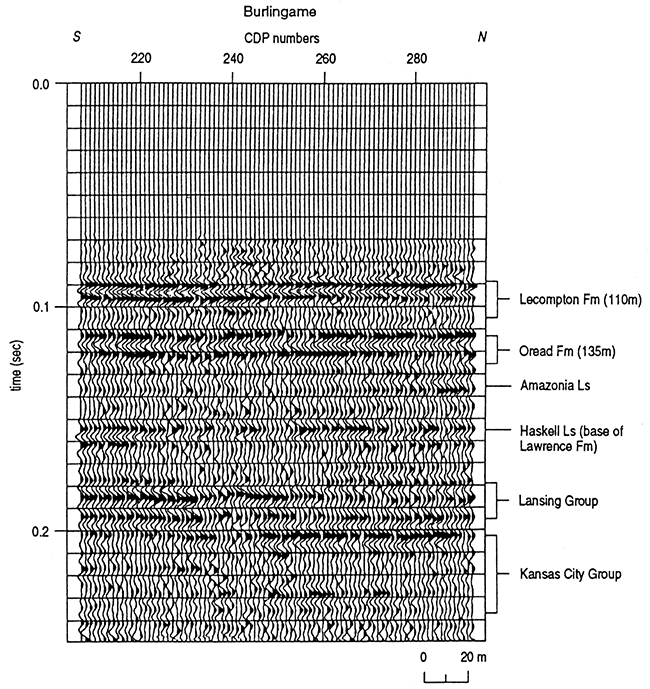
The Burlingame seismic line possesses the lowest dominant reflection frequencies and therefore the lowest resolution potential of the eight lines (fig. 10). Two stratigraphic features of potential interest can be interpreted on the section at 90 msec and 180 msec. These features both seem to be mounds probably associated with depositional anomalies. These highs are both about 2-3 m (6.6-10 ft) vertical and 20-25 m (66-82 ft) horizontal. The shallower high (90 msec) may be the edge of a pinch-out or lens extending beyond the end of the survey line to the north. Within the Kansas City Group, significant changes in reflection wavelet characteristics seem to occur, possibly indicative of thickness changes in bedding within that horizon. The vertical resolution potential of this data set is around 3 m (9.8 ft),
Figure 10--Interpreted 12-fold seismic-reflection profile approximately 5 mi (8 km) northwest of Overbrook, Kansas. The reflection from the base of the Oread is at approximately 122 msec (145 m) and the reflection from the base of the Lawrence is at approximately 154 msec (185 m).
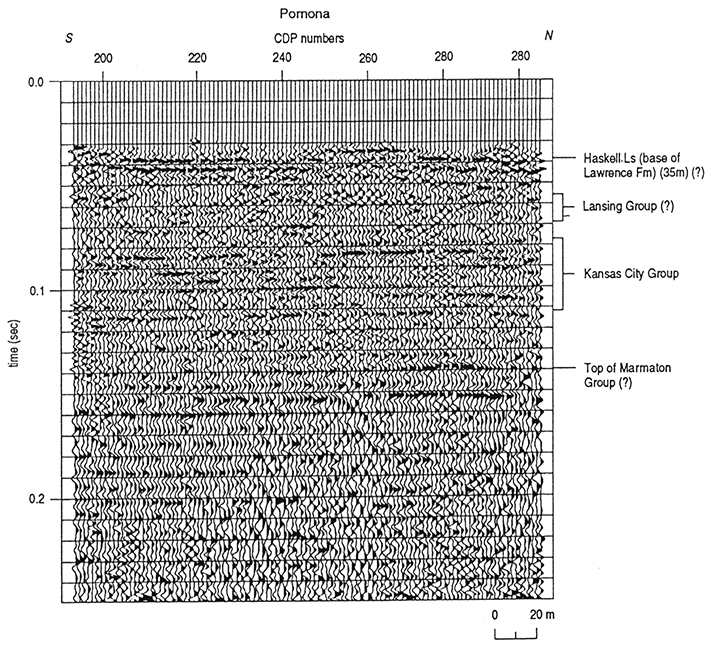
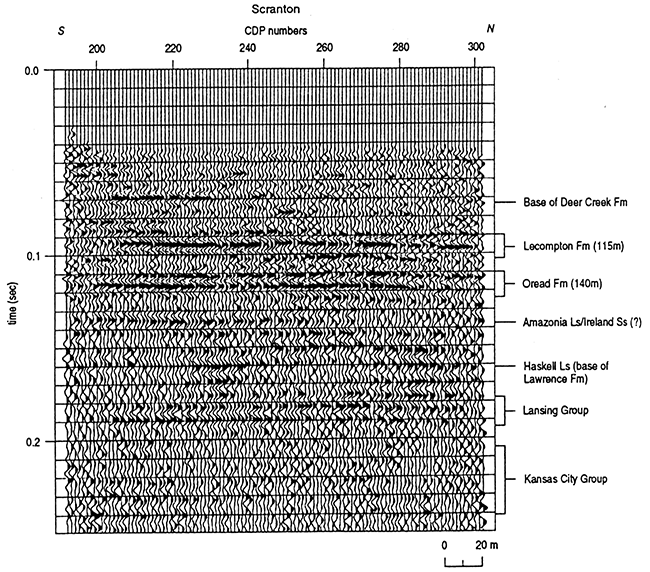
The Scranton seismic data is stratigraphically higher in the section and, therefore, has the potential to image all the major geologic interfaces observed on the previous seven lines (fig. 11). Very few unique or anomalous features can be interpreted on this section. This section displays the cyclic layer-cake stratigraphy that is regionally consistent in most of eastern Kansas. Across the section as a whole, very subtle deviations from horizontal bedding can be observed as in previous sections. The Lansing Group is relatively distinct, but reflections from within the Lawrence Group (beneath the Oread Formation) do not possess the necessary spectral properties to resolve layering as clearly as other seismic sections in this study. The Kansas City Group is sufficiently deep that the signal-to-noise ratio does not permit much in the way of stratigraphic interpretations. The vertical resolution potential of this data set ranges from 1.5 to 2.5 m (5-8 ft).
Figure 11--Interpreted 12-fold seismic-reflection profile near Pomona, Kansas. The reflection from the Oread is at 120 msec (145 m). The base of the Lawrence is interpreted to be at approximately 160 msec (190 m).
The seismic data collected from this area are on the average very high quality with thin-bed resolution ranging from 1 to 4 m. Seismic data from the east, north, and west portions of the study area are of excellent quality and can be correlated with the synthetic seismograms and from line to line based on wavelet character and reflection-time intervals. The seismic data from the southwest part of the area have slightly different signal characteristics in comparison to the other data sets. However, reflection-time intervals, stacking velocities, and the synthetic seismogram reflections can be identified and correlated from well data. Seismic data from the southeast portion of the study area do not possess the very high signal-to-noise ratio of lines from other parts of the study area. This is most likely due to the near-surface repetitive limestone sequences seen in outcrop allover the southern portion of the study area. Confidence in interpreting many of the apparent subtle stratigraphic and/or structural features on these seismic data as real (and not static or uncompensated velocity) comes from qualitative comparisons of the interpreted feature reflections above and below.
Seismic reflection can be cost-effective in delineating subsurface features significant to hydrologists, petroleum geologists, and petroleum engineers in this area. Petroleum exploration targets in eastern Kansas with horizontal extent less than 20 m (66 ft) and vertical expression less than 3 m (10 ft) at depths of 100-350 m (330-1,155 ft) could be routinely delineated using this method. Detection and mapping of channel systems with seismic reflection could greatly enhance identification of ground-water availability and production in east-central Kansas. Model parameters necessary for enhanced recovery systems could be improved if zone geometries could be resolved within 2 m (6.6 ft) vertically and 10 m (33 ft) horizontally. This data set suggests that seismic reflection could greatly benefit most subsurface exploration and/or exploitation in east-central Kansas.
We wish to thank Don Steeples, Jeff Treadway, Bradley Birkelo, Paul Myers, and Andrew Kalik for their work on this project. Thanks also go to Mary Brohammer for her manuscript preparation, Pat Acker for her graphic design, and the anonymous reviewers who contributed to the quality of this finished article.
Ball, S. M., Ball, M. M., and Laughlin, D. J., 1963, Geology of Franklin County, Kansas: Kansas Geological Survey, Bulletin 163, 57 p. [available online]
Gochioco, L. M., and Cotten, S. A., 1989, Locating faults in underground coal mines using high-resolution seismic-reflection techniques: Geophysics, v. 54, p. 1,521-1,527
Goforth, T., and Hayward, C., 1992, Seismic reflection investigations of a bedrock surface buried under alluvium: Geophysics, v. 57, p. 1,217-1,227
Heckel, P. H., 1988, Classic "Kansas" cyclothems: Geological Society of America, Centennial Field Guide-South-central Section, p. 43-56
Hunter, J. A., Pullan, S. E., Bums, R. A., Gagne, R. M., and Good, R. S., 1984, Shallow seismic-reflection mapping of the overburden-bedrock interface with the engineering seismograph--some simple techniques: Geophysics, v. 49, p. 1,381-1,385
Jongerius, P., and Helbig, K., 1988, Onshore high-resolution seismic profiling applied to sedimentology: Geophysics, v. 53, p. 1,276-1,283
McGuire, D., and Miller, B., 1989, The utility of single-point seismic data; in, Symposium on Geophysics in Kansas, D.W. Steeples, ed.: Kansas Geological Survey, Bulletin 226, p. 1-8 [available online]
Miller, R. D., Steeples, D. W., and Brannan, M., 1989, Mapping a bedrock surface under dry alluvium with shallow seismic reflections: Geophysics, v. 54, p. 1,528-1,534
Miller, R. D., Steeples, D. W., and Myers, P. B., 1990, Shallow seismic-reflection survey across the Meers fault, Oklahoma: Geological Society of America, Bulletin 102, p. 18-25
Miller, R. D., and Steeples, D. W., 1991, Detecting voids in a 0.6-m coal seam, 7 m deep, using seismic reflection: Geoexploration, Elsevier Science Publishers B.V., Amsterdam, The Netherlands, v. 28, p. 109-119
O'Connor, H. G., 1955, Geology, mineral resources, and ground-water resources of Osage County, Kansas: Kansas Geological Survey, Vol. 13, part 1, 50 p. [available online]
Steeples, D. W., and Miller, R. D., 1990, Seismic-reflection methods applied to engineering, environmental, and ground-water problems; in, Vol. I: Review and Tutorial, Stan Ward, ed.: Society of Exploration Geophysicists, Investigations in Geophysics No.5, p. 1-30
Treadway, J. A., Steeples, D. W., and Miller, R. D., 1988, Shallow seismic study of a fault scarp near Borah Peak, Idaho: Journal of Geophysical Research, v. 93, no. B6, p. 6,325-6,337
Wilson, F. W., O'Connor, H. G., Paul, S., and Chaffee, P. K., 1986, A feasibility study of sites for the proposed superconducting super collider in Kansas, preliminary geographical, geological, and geotechnical assessments: Kansas Geological Survey, Open-file Report 87-16, 18 p.
Zeller, D. E. (ed.), 1968, The stratigraphic succession in Kansas: Kansas Geological Survey, Bulletin 189, 81 p. [available online]
Previous--Cheyenne Bottom Basin--Geophysical Study || Next--Garfield Prospect, Lippelmann Field, Decatur County, Kansas
Kansas Geological Survey
Comments to webadmin@kgs.ku.edu
Web version placed online Sept. 2, 2015. Original publication date 1995.
URL=http://www.kgs.ku.edu/Publications/Bulletins/237/Miller2/index.html