Previous--Plastic Deformation and Dissolution of the Hutchinson Salt Member in Kansas || Next--Cheyenne Bottom Basin--Geophysical Study
1Kansas Geological Survey and 2Normandy Exploration Limited
This article available as an Acrobat PDF file (5 Mb).
Seismic-reflection surveying was successfully used to define subsidence of the Stone Corral anhydrite in Stafford County, Kansas, in response to dissolution of the 85-m (279-ft)-thick Permian-aged Hutchinson Salt at a depth of approximately 340 m (1,116 ft). Gradual formation of a surface depression around the Siefkes "A" No. 6 abandoned oil-field-brine disposal well in Stafford County, Kansas, led to a 12-fold COP seismic survey to define the potential extent and amount of future surface subsidence. Several reflections interpreted on the CDP stacked sections possess dominant frequencies in excess of 100 Hz. Reflections can be interpreted on stacked sections at two-way times from 80 msec (approximate depth of 70 m; 230 ft) to 220 msec (approximate depth of 200 m; 656 ft). The Stone Corral anhydrite reflection is present between 200 and 220 msec on all three seismic lines and possesses a maximum of 20 msec (35 m assuming 1,770 m/sec seismic velocity) of relative subsidence. The March 1990 subsurface dissolution boundary, as defined by the Stone Corral anhydrite, suggested a potential four-fold increase in the surface area of the sinkhole encompassing part of both an east-west and a north-south county road.
Subsurface dissolution of salt beds represents a hazard to surface and subsurface structures in many parts of the world. Natural or anthropogenic subsidence can occur either gradually or catastrophically (Walters, 1977). Determination of potential extent of future surface subsidence allows more accurate damage estimates and rehabilitation requirements.
Seismic-reflection techniques have successfully detected the presence and extent of subsurface dissolution prior to and during surface subsidence (Steeples et al., 1986, 1987; Miller et al., 1985; Knapp et al., 1989). The technique offers a powerful method of imaging portions of the subsurface in the vicinity of some subsidence features. The successful use of the technique depends on several key conditions. First and foremost is the existence of acoustic velocity and/or density contrasts between geologic units in the subsurface. The Stone Corral anhydrite fulfills this condition, having a large acoustic velocity and density contrast with surrounding siltstones, silty sandstones, and shales. The second condition relates to the ability of the near-surface to propagate a high-frequency seismic signal. Finally, the acquisition parameters and recording equipment must be compatible with the proposed target and required resolution of the survey.
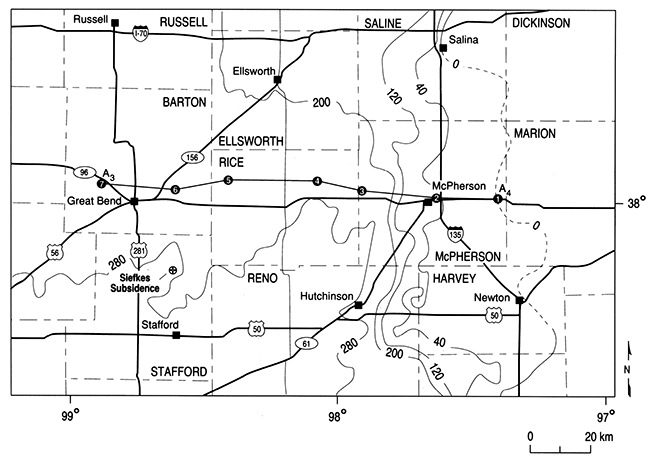
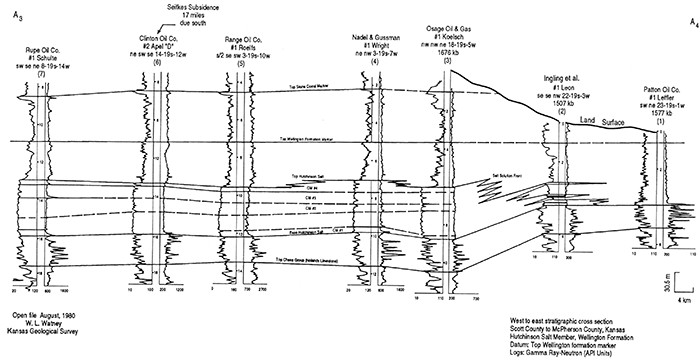
Several major salt basins exist throughout North America (fig. 1) (Ege, 1984). The Hutchinson Salt Member of the Permian Wellington Formation underlies a significant portion of south-central Kansas (fig. 2) (Walters, 1977). The thickness of the salt increases from depositional edges on the west and north, an erosional edge on the east, and a facies change on the south to a maximum thickness of over 170 m (558 ft) in north-central Oklahoma. The increased thickness of the Hutchinson Salt is due to increased quantities of salt as well as more and thicker interbedded anhydrites. Thickness of the salt in the vicinity of the Siefkes subsidence is approximately 75-85 m (246-279 ft) (figs. 3 and 5) (Watney, 1980). Cross section A-A' shows the distribution of salt along an east-west profile located 6 mi (9.6 km) north of the Siefkes subsidence feature (fig. 6) (Watney, 1980). The Siefkes subsidence is located approximately 120 km (72 mi) west of the Hutchinson Salt dissolution front (figs. 3 and 6) (Watney, 1980).
Figure 1--Major salt baslns of North America (Ege, 1984).
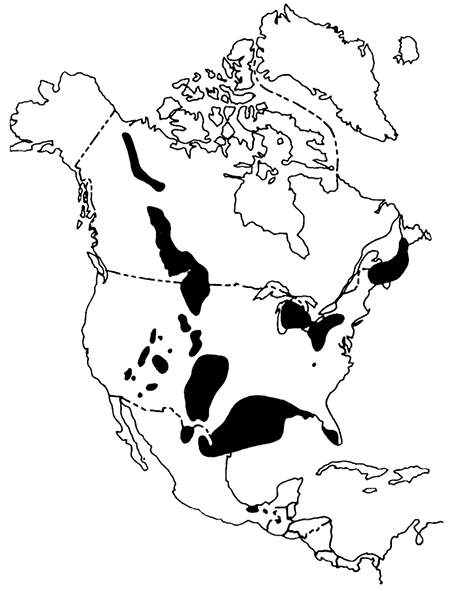
Figure 2--Areal extent and thickness of Hutchinson Salt Member (Walters, 1977).
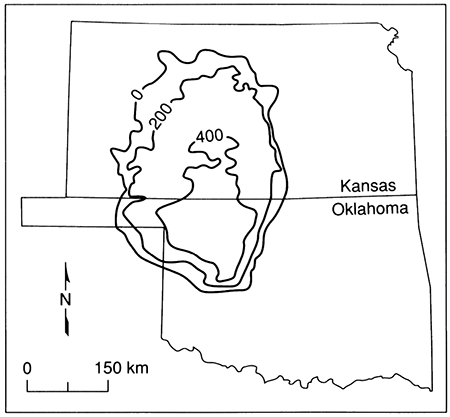
Figure 3--Siefkes subsidence location map, including Hutchinson salt thickness contours and drillhole cross section location (Watney, 1980).
The stratigraphic section overlying the Hutchinson Salt Formation at the Siefkes well location is the target of this seismic-reflection survey (fig. 5). Overlying the salt are approximately 70 m (230 ft) of the upper Wellington Formation shales with minor carbonates, 80 m (262 ft) of the Ninnescah Shale with minor carbonates, and 6 m (20 ft) of Stone Corral anhydrite at a depth of 186 m (610 ft). The Stone Corral is a key seismic marker horizon in central Kansas. The depression of the Stone Corral, resulting from dissolution of the underlying Hutchinson Salt, is used to map the lateral extent of the Siefkes subsidence feature in the subsurface. Overlying the Stone Corral is approximately 70 m (230 ft) of Harper Sandstone, 80 m (262 ft) of Salt Plain Sandstone, and 41 m (135 ft) of Quaternary unconsolidated sediments.
Salt dissolution can result in various rates of surface subsidence. The dissolution process remains active as long as flowing unsaturated brine solution or freshwater is in contact with a salt bed. This results in the formation of a void, generally water filled, within the salt bed. Depending on the size of the void and the competency of the overlying sedimentary section, either a void or a closed collapse feature migrates upward at varying rates. The result is a catastrophic collapse or gradual subsidence when the effect of the dissolution feature reaches the surface.
Natural dissolution of the Hutchinson Salt is not uncommon in Kansas (Ege, 1984). Surface subsidence associated with natural salt dissolution occurred in Meade County, Kansas, in 1879. Faults extending through the Pleistocene sediments (sediments containing freshwater under hydrostatic pressure) are postulated as the conduits for flow instigating the salt dissolution that eventually resulted in the Meade County sinkhole (Frye and Schoff, 1942). Paleo-sinkholes resulting from dissolution of the Hutchinson Salt prior to Pleistocene deposition have been discovered with high-resolution seismic-reflection surveys (Steeples et al., 1984). Natural dissolution of the Hutchinson Salt may have been occurring to some degree in some localities since deposition.
Land subsidence associated with salt mining and petroleum-related brine disposal has been documented in Kansas for at least the last 70 years (Walters, 1977). In cases related to solution salt mining, sinkholes generally have been the result of roof rock failure. Casing failure or faulty surface grouting have allowed petroleum by-product disposal wells to become conduits to the Hutchinson Salt (unsaturated brine solutions). Sinkholes related to brine-disposal wells result from roof failure similar to sinkholes associated with solution mining of salt.
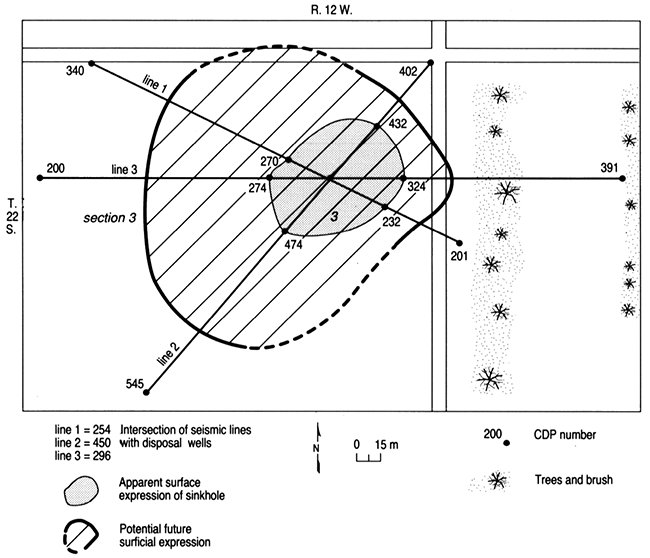
The Siefkes subsidence feature is located in NE NE NE sec. 3, T. 22 S., R. 12 W. in Stafford County, Kansas (fig. 3). The gradually forming, anthropogenic subsidence feature is centered on the plugged Siefkes "A" No. 6 saltwater-disposal well (fig. 4). A rough visual estimate of surface subsidence as of 1990 indicated the feature had approximate dimensions of 75 m by 85 m (246 ft by 279 ft) laterally with about 0.5 m (1.6 ft) maximum vertical displacement (fig. 4). This is a minimum estimate since visually determining the outer edges of a shallow subsidence feature is difficult.
Figure 4-Site map indicating location of three seismic lines and approximate areal extent of the subsidence.
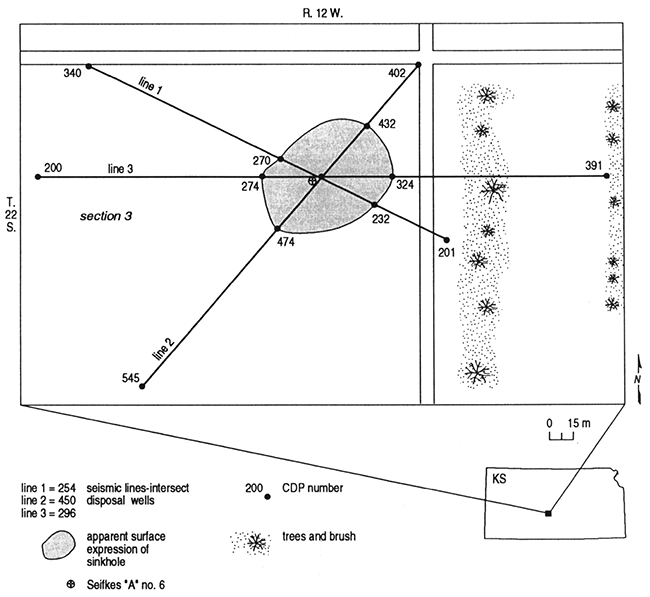
Figure 5--Stratigraphic section from Siefkes "A" No. 6 gamma ray/neutron log.
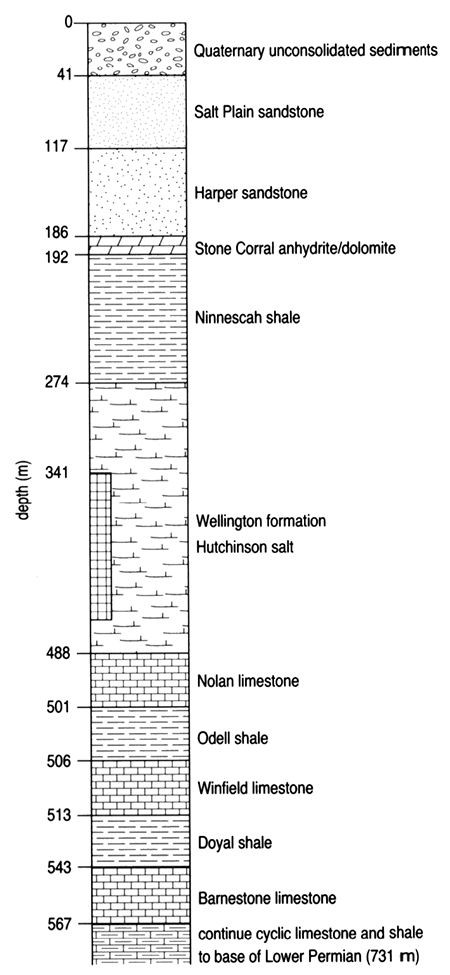
Figure 6--Drillhole cross section A3-A4 through Barton, Rice, and McPherson counties, Kansas (Watney, 1980).
The Siefkes "A" No. 6 drill hole was completed in November 1939. It penetrates the Hutchinson Salt Member of the Wellington Formation from 344 m to 416 m (1,129 ft to 1,365 ft) in depth. The drillhole has a total depth of 1,100 m (3,609 ft) and terminates in the Arbuckle Formation. The well was converted to a saltwater-disposal well in 1950 (Korphage, personal communication, 1992). Unsaturated fluids eventually reached the Hutchinson Salt either through corroded casing or along the outside of the casing. The well passed a mechanical integrity test as late as 1986, but due to evidence of surface subsidence, it was plugged in 1988 (Morris, personal communication, 1992). The onset of dissolution of the Hutchinson Salt and the time required for the subsidence to have developed a noticeable surface expression is unknown.
Three CDP seismic-reflection lines were acquired with nominal 24-fold redundancy (fig. 4). The lines were roughly centered on and intersect at the Siefkes "A" No. 6 inactive brine-disposal well. Lines 1 and 2 were acquired during March 1989 with line 3 acquired in March 1990. The original two lines (1 and 2) were collected with extremely dry near-surface conditions and abnormally high winds. It was determined after digital processing of data from lines 1 and 2 that more subsurface information was needed east of the north-south county road. The third line was then acquired using the results of lines 1 and 2 to determine line length and location.
An extensive series of walkaway-noise tests was conducted prior to production acquisition (table 1). The compacted near-surface material made it impossible to use the downhole .50-cal seismic source (the source of choice at this site, for this geologic target) and forced the use of an above-ground silenced .50-cal gun. The .50-cal silencer reduces source-generated air-coupled waves and acts as a containment device for stray debris. The surface configuration of the .50 cal is less energetic and does not generate the high frequency and broad bandwidth signal possible with the .50 cal in the downhole mode (Steeples et al., 1987). The receiver array consisted of three 40-Hz geophones equally spaced over approximately 1 m (3.3 ft) and centered on each station. The receiver array was designed in an attempt to attenuate the source-generated noise. The acquisition parameters and equipment for lines 1 and 2 were optimized for the less-than-ideal site conditions.
Table 1--Critical acquisition parameters.
| 3/1990 | 3/1991 | |
|---|---|---|
| Station increment | 5 m (16.5 ft) | same as 3/1990 |
| Receiver array length | 1.5 m (4.9 ft) | same as 3/1990 |
| Split-spread intervals* | 10-125 m (33-412.5 ft) | same as 3/1990 |
| Source downhole | .50 cal surface | .50 cal |
| Receivers | L28E Mark Prod. | same as 3/1990 |
| *Source-to-nearest-and-farthest-receiver distance | ||
Significant changes in the near-surface conditions during the March 1990 survey necessitated a new set of walkaway-noise tests for line 3 (table 1). Improved near-surface conditions allowed the use of the .50-cal downhole gun. In the downhole configuration of the .50 cal, the gun barrel is lowered down an augered hole approximately 6 cm (2.4 inches) in diameter and 0.6 m (2 ft) deep. The downhole placement of the barrel greatly reduces both the source-generated air-coupled waves and the thickness of low-velocity, highly attenuative near-surface material through which seismic energy must travel. Station spacing was identical to the 1989 survey as were the receiver arrays and source/receiver geometries. Consistent with the 1989 survey, the acquisition parameters and equipment were optimized to the site conditions and geologic target.
The source/receiver geometry on all three lines resulted in a nominal 24-fold data set. Most shot locations were occupied twice, once pushing the 24-channel spread from low-numbered stations to high-numbered stations and then reversed, pushing the same spread from high-numbered stations to low-numbered stations. This acquisition procedure results in a pseudo 48-channel symmetric (with respect to the source location) split-spread geometry with two consecutive groups of 24 channels separated by three stations.
The 24-channel data were analog-filtered, amplified, A/D-converted (11 bit plus sign), and recorded on an Input/Output DHR-2400 seismograph. Analog low-cut filters helped to enhance the data bandwidth by decreasing the amount of low-frequency noise, allowing increased gaining of incoming post-filtered high-frequency signal. The analog low-cut filters selected have a 24 dB/octave roll-off with a -3 dB point of 110 Hz for line 3 and 55 Hz for lines 1 and 2. The relatively severe analog low-cut filtering increased the dominant reflection frequencies and therefore improved the potential vertical- and horizontal-bed resolution.
The CDP data were processed at the KGS using a proprietary set of algorithms developed by Sytech Co. The processing flow was very similar to routine petroleum sequences with the exception of the severity and accuracy of the muting processes and the emphasis placed on near-surface velocity analysis (table 2). Extreme care was used during the editing processes to ensure removal of all non-seismic energy that could either be misinterpreted as reflections on stacked data or that hampered interpretations of real reflection events. Velocity analysis incorporated iterative constant velocity stacking with detailed surface-consistent statics to improve both accuracy of velocity corrections and time/depth conversion on interpreted cross sections. The general processing flow resulted in a nominal 24-fold CDP stacked section for each of the three survey lines.
Table 2--CDP seismic processing steps.
|
Format to SEG-Y Dead and noisy trace edit Trace balancing (AGC) First-arrival muting Surgical muting of coherent noise CDP sort Datum statics correction NMO correction Surface-consistent statics Bandpass filtering CDP stack |
Reflection energy can be identified on raw field data in a time window between about 80 msec and 400 msec (fig. 7). Differentiation of reflection energy from seismic noise on field files is essential for confident and consistent interpretation of stacked seismic sections. Refraction arrivals, present as the first breaks (first source-generated energy recorded) on seismograms, were removed with a severe first-arrival mute. Low-velocity linear arrivals that can be identified on the nearest-to-the-source trace at about 50 msec and on the farthest-from-the-source trace at about 400 msec are source-generated air-coupled waves. Air-coupled waves were surgically removed from all shot gathers. Ground roll is the low-frequency energy clearly visible on inside traces between 10m and 40 m (33 ft and 131 ft) source offset. The low-frequency characteristics of the ground roll make attenuation with a properly designed bandpass filter very effective. Dominant frequency of reflection energy is in excess of 100 Hz.
Figure 7--24-Channel field file with Stone Corral reflection indicated.
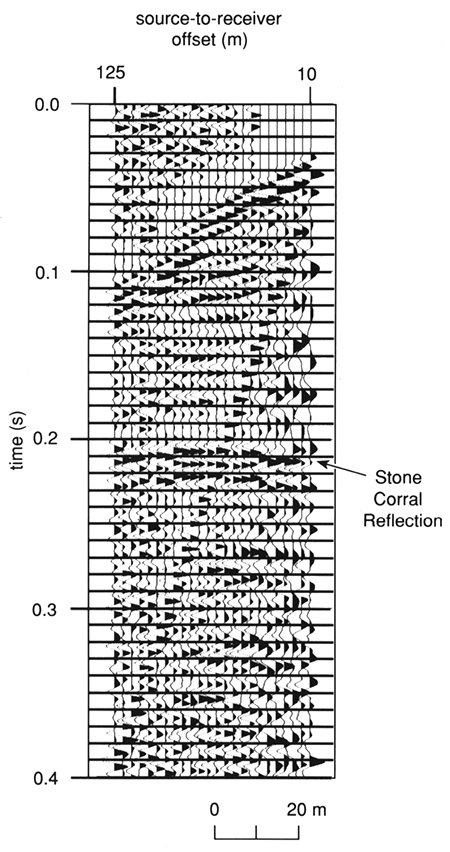
Reflections from the Stone Corral anhydrite can be clearly identified at about 210 msec on most field files (fig. 7). The apparent reverse moveout on the Stone Corral reflection on this field file is interpreted to be the result of roof failure of a previous salt-dissolution void. Stone Corral reflections on seismograms from areas with competent salt would appear hyperbolic with a very subtle downward curvature at increasing receiver-to-source offsets. The reflection energy interpretable on this seismogram clearly indicates subsurface collapse. A synthetic seismogram calculated from the nearby Sittner "A" No. 1 acoustic-velocity log supports the interpretation of the field file (fig. 8). The strongest reflector on the synthetic seismogram is the Stone Corral. The absolute two-way travel time of the Stone Corral reflector calculated from the synthetic seismogram is unknown because the acoustic log used to generate it was not recorded above a depth of 76 m (250 ft). However, the amplitude of the Stone Corral reflection is significantly larger than any other reflection occurring between 76 m (250 ft) and 457 m (1,500 ft) on the synthetic seismogram. This supports the interpretation that the large amplitude 210-msec reflections observed on lines 1, 2, and 3 (figs. 9, 10, and 11) are from the Stone Corral. By comparing the drill log (fig. 5) with the field file plot (fig. 7), a stacking velocity of 1,800 m/sec is calculated. This is consistent with the results of the velocity analysis carried out during processing.
Figure 8--Synthetic seismogram calculated from Sittner "A" No. 1 acoustic velocity log. The Stone Corral reflection is indicated.
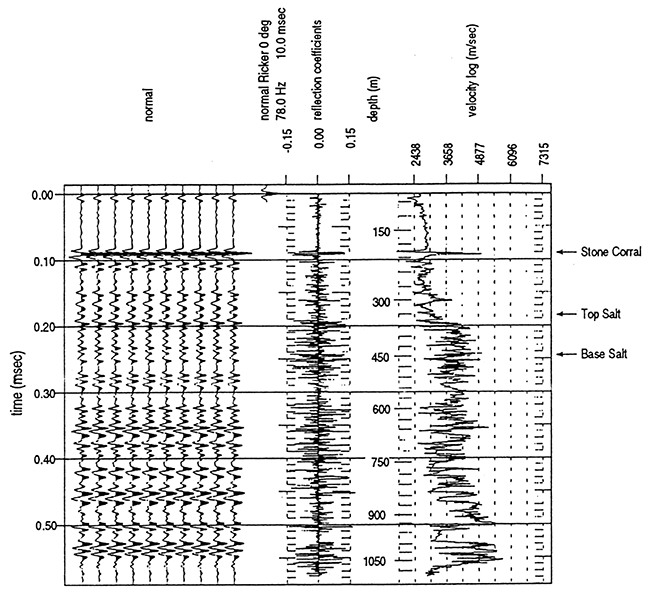
Figure 9--Pseudo 24-fold stack seismic section of line 1 with associated interpretive line drawing. The Stone Corral reflection is indicated.
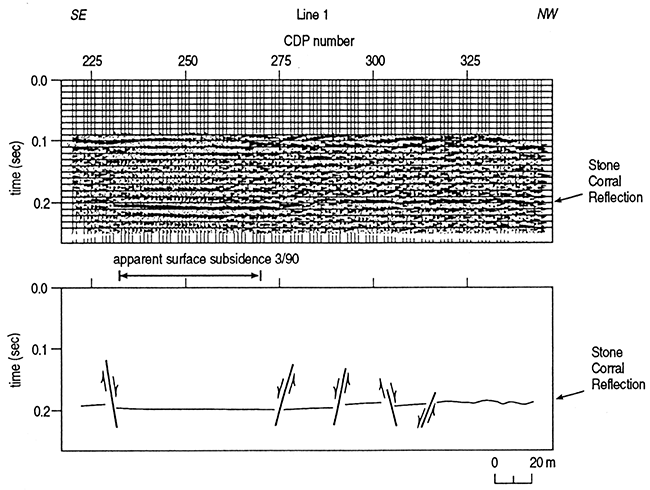
Figure 10--Pseudo 24-fold stack seismic section of line 2 with associated interpretive line drawlng. The Stone Corral reflection is indicated.
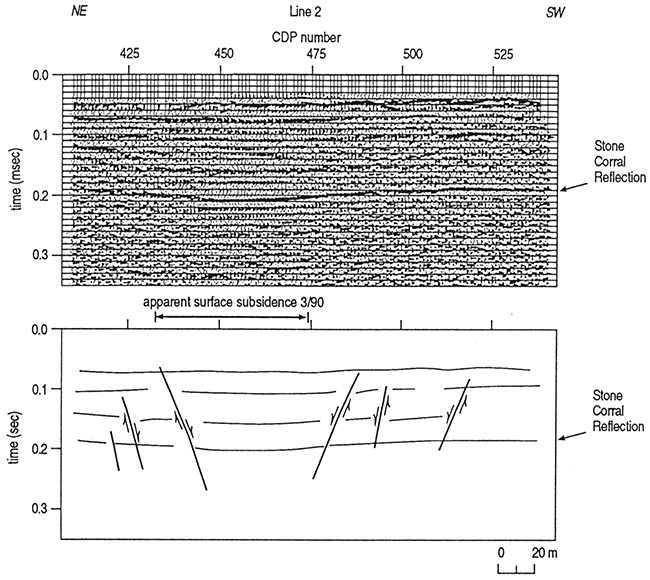
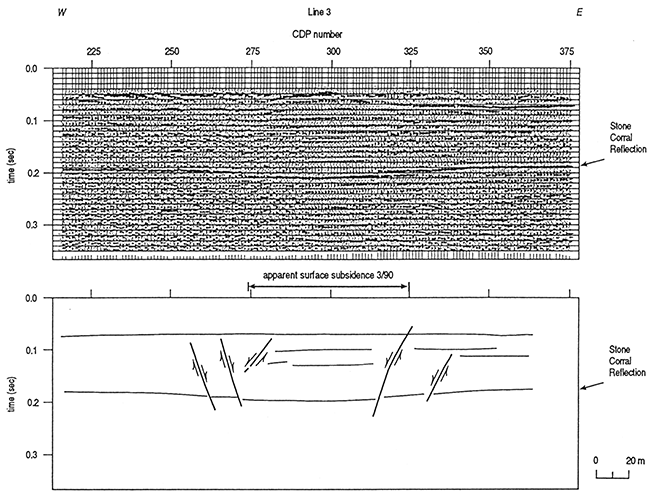
Figure 11--Pseudo 24-fold stack seism1c section of line 3 with associated interpretive line drawing. The Stone Corral reflection is indicated.
The top of the Hutchinson Salt does not generate a large amplitude reflection on the synthetic seismogram (fig. 8). In fact, it is a weaker reflector than is indicated by the synthetic seismogram because the low density-high velocity combination of salt results in a small acoustic-impedance contrast with the surrounding low velocity-high density shales. No density log is available for the Sittner "A" No. 1 drillhole, so the large acoustic velocity of the salt is not modified by the salt's low density, and the synthetic seismogram overestimates the salt response. Figure 7 confirms that the top of the Hutchinson Salt is not a good reflector.
Seismic line 1 was acquired with a maximum record length of 250 msec (fig. 9). The target on line 1 was the top of the Stone Corral. Faulting and subsidence interpreted on the Stone Corral is assumed to be the result of dissolution of the salt. Normal faults forming horst and graben structures can be interpreted from the 12-msec depression of the Stone Corral reflection. Subtle coherent reflection events observed between CDPs 225 and 275 above the Stone Corral are most likely from within the Harper and Salt Plain Sandstones. The lack of coherent events between the Stone Corral and the surface from CDPs 275 to 325 is related to the poor near-surface and environmental conditions. Dissolution in the subsurface extends from approximately CDPs 220 to 320 on line 1.
Seismic line 2 was acquired with a maximum record length of 500 msec (fig. 10). Coherent reflection information is identifiable between approximately 70 and 320 msec. The overall data quality on line 2 is better than line 1 due to decreased wind noise. The near-surface conditions were consistent for both lines 1 and 2. The Stone Corral reflection can be identified across the entire line. A depression of up to 20 msec is observed on the Stone Corral reflector. Several reflection events between the Stone Corral and the surface are interpreted as coming from within the Harper and Salt Plain Sandstones and are across the entire expanse of line 2. The interpretative line drawing clearly shows the extent of faulting and the relatively uniform nature of the subsidence in the subsurface. The severity of reflector slump observed on line 2 appears to increase with depth. This apparent decrease in subsidence upward from the salt is probably related to differential expansion, although it could be related to velocity anomalies related to slumping into the cavity. The predominant structural features on line 2 are the series of normal fault blocks that bound the graben formed as a result of dissolution and subsidence.
Line 3 was acquired east-west and is the most conclusive of the three seismic lines (fig. 11). The dominant frequency of the Stone Corral reflection is clearly in excess of 100 Hz. Subsurface subsidence on line 3 extends from CDP 250 to 340. Normal faults offset the Stone Corral reflection across the entire subsidence area. The maximum depression of the Stone Corral reflection is 20 msec. Only the normal fault interpreted at approximately CDP 325 offsets the 80-msec reflecting event. The 80-msec reflection is the shallowest interpreted reflector at a depth of approximately 50 m (164 ft). Several high-frequency events are interpreted between the 80-msec reflection and the approximately 200-msec Stone Corral reflection. The relatively uniform, gradual slump of reflectors overlying the dissolved salt can be observed on all three lines.
The 20-msec depression of the Stone Corral reflector visible on lines 2 and 3 (figs. 10 and 11) represents the Siefkes subsidence feature in the subsurface. By using an 1,800-m/sec stacking velocity, calculation of a 35-m (115-ft) maximum vertical displacement of the Stone Corral is possible. If the stacking velocity within the zone of subsidence is reduced by the collapse and fracturing of the sediments overlying the salt, the resulting vertical displacement would be proportionately less than 35 m (115 ft).
The potential future surficial expression of dissolution voids in the Hutchinson Salt can be extrapolated from interpretations on the Stone Corral reflection (fig. 12). The dashed portions of the interpreted future sinkhole represent speculative interpolation between control points on the associated seismic lines. The apparent eastward elongation of the future sinkhole along line 3 indicates subsidence of the Stone Corral reflector was probably active along the eastern edge between March 1989 and March 1990. This ongoing subsidence of the Stone Corral may be indicative of active dissolution or delayed roof failure along the eastern portion of the salt void.
Figure 12--Site map showing present and potential surface subsidence at Siefkes.
Optimum recording parameters for each line were selected after two separate extensive series of walkaway-noise tests, one for each survey (table 1) (Steeples and Miller, 1990). Adverse near-surface and environmental conditions, detrimentally affecting both geophone plants and propagation of high-frequency seismic-reflection information, strongly contributed to a low signal-to-noise ratio on the 1989 survey. Improved site conditions on the 1990 survey allowed use of the downhole .50-cal gun and 110-Hz low-cut fiiters, which (in comparison to the 1989 survey) resulted in reduced levels of recorded environmental, instrument, and non-seismic reflection noise.
The subsurface subsidence associated with this Siefkes subsidence feature (at least as indicated by the Stone Corral anhydrite) seems to have been active as of March 1990. Extrapolation of the present subsurface dissolution boundaries (as interpreted from the Stone Corral reflection) suggests a potential four-fold increase in the surface area of the present-day sinkhole. At some time in the future, this sinkhole could include part of the east-west and north-south county roads. Dissolution of the salt, as interpreted from seismic data, appears to be slightly asymmetric to the west with respect to the surface location of the abandoned disposal well.
There is no reason to suspect the apparent eastward growth of the subsurface dissolution front has terminated. The actual subsurface dissolution front could be well east of the north-south county road that intersects line 1. It is also not unreasonable to suggest that the northeast boundary (as interpreted from line 2) may now be several tens-of-meters closer to the intersection of the two county roads. No seismic evidence exists (on the three seismic lines reported here) to suggest the surficial expression of the subsurface subsidence will reach the intersection of the north-south and east-west county roads. The north-south county road will eventually be affected by the salt dissolution which has already resulted in subsurface subsidence (as interpreted on the Stone Corral anhydrite) several tens-of-meters east of the road.
The interpreted subsurface subsidence on the western boundary appears to be consistent over the span of time between the two seismic surveys. Topographic evidence seems to suggest surface subsidence is presently active along the western boundary. There is no seismic evidence to suggest westward expansion of subsurface subsidence.
The apparent subsurface growth of the dissolution front to the east with no apparent associated surface subsidence suggests delay between roof failure of the salt unit and surficial expression. The apparent elongation of the surface expression of the sinkhole to the west between the two seismic surveys with no obvious associated subsurface growth is probably related as well to a delay. The delay between roof collapse and surface subsidence is probably not uniform for all parts of the sinkhole. Alternatively, the rate of dissolution may vary with azimuth from the center of the sinkhole, in which case the elongation noted above may not be indicative of active dissolution.
The results derived from interpretations of the three seismic lines suggest a continued gradual subsiding of the surface around the abandoned disposal well. Due to the apparent active nature of the subsurface subsidence, the maximum future surficial expression of the salt voids and associated roof collapse cannot be ascertained from the three seismic lines collected between March 1989 and March 1990. There appears to be either continued subsurface growth of salt voids to the east or delayed roof failure of previously existing voids in the salt. A return visit to this site in approximately two to three years with the intent of acquiring data along line 3 should yield far more insight into subsurface growth and rate of roof failure.
We wish to thank Randie Grantham, George Coyle, and Mubarik Ali for their assistance with data acquisition. We would like to extend a special thanks to Dean A. Keiswetter for his assistance during acquisition. Also, the work of Esther Price and Mary Brohammer in manuscript preparation and Pat Acker's quality graphics are greatly appreciated. Funding was provided in part by a contract with Quinoco Petroleum.
Ege, J. R., 1984, Formation of solution-subsidence sinkholes above salt beds: U.S. Geological Survey, Circular 897, 11 p. [available online]
Frye, J. C., and Schoff, S. L., 1942, Deep-seated solution in the Meade basin and vicinity, Kansas and Oklahoma: American Geophysical Union, Transactions, v. 23, pt. 1, p. 35-39
Knapp, R. W., Steeples, D. W., Miller, R. D., and McElwee, C. D., 1989, Seismic reflection surveys at sinkholes in central Kansas; in, Geophysics in Kansas, D. W. Steeples, ed.: Kansas Geological Survey, Bulletin 226, p. 95-116 [available online]
Miller, R. D., Steeples, D. W., and Treadway, J. A., 1985, Seismic-reflection survey of a sinkhole in Ellsworth County, Kansas: Society of Exploration Geophysicists, 55th annual meeting, Washington, D.C., Technical Program Abstracts and Biographies [Exp. Abs.], p. 154-156
Steeples, D. W., Knapp, R. W., and Miller, R. D., 1984, Examination of sinkholes by seismic reflection; in, Sinkholes--Their Geology, Engineering, and Environmental Impact, Barry Beck, ed.: A. A. Balkema, Boston, p. 217-224
Steeples, D. W., Knapp, R. W., and McElwee, C. D., 1986, Seismic reflection investigations of sinkholes beneath Interstate Highway 70 in Kansas: Geophysics, v. 51, p. 295-301
Steeples, D. W., Miller, R. D., and Knapp, R. W., 1987, Downhole .50-caliber rifle--an advance in high-resolution seismic sources [Exp. Abs.]; in, Technical Program Abstracts and Biographies: Society of Exploration Geophysicists, 57th Annual Meeting, p. 76-78
Steeples, D. W., and Miller, R. D., 1990, Seismic-reflection methods applied to engineering, environmental, and groundwater problems: Society of Exploration Geophysicists, volumes on Geotechnical and Environmental Geophysics, Stan Ward, ed., Vol. 1--Review and Tutorial, 1-30
Walters, R. F., 1977, Land subsidence in central Kansas related to salt dissolution: Kansas Geological Survey, Bulletin 214, 82 p. [available online]
Watney, L., 1980, Maps and cross sections of the Lower Permian Hutchinson Salt in Kansas: Kansas Geological Survey, Open-file Report 80-7
Previous--Plastic Deformation and Dissolution of the Hutchinson Salt Member in Kansas || Next--Cheyenne Bottom Basin--Geophysical Study
Kansas Geological Survey
Comments to webadmin@kgs.ku.edu
Web version placed online Sept. 1, 2015. Original publication date 1995.
URL=http://www.kgs.ku.edu/Publications/Bulletins/237/Miller1/index.html