Previous--Seismic Signature of the Hutchinson Salt || Next--Salt-dissolution Subsidence Feature in Stafford County, Kansas
1Department of Geology and Geophysics, University of Missouri-Rolla and 2Kansas Geological Survey
This article available as an Acrobat PDF file (6 Mb).
The Hutchinson Salt Member of the Permian Wellington Formation is preserved throughout south-central Kansas at subsurface depths of between 60 m and 760 m (197 ft and 2,494 ft), as a more-or-Iess contiguous body having maximum net thicknesses on the order of 170 m (558 ft). Within Kansas, the margins of the salt are depositional except for the updip eastern edge, which is dissolutional. Basinward of the present-day main eastern edge of the Hutchinson Salt, localized dissolution of both natural and anthropogenic origin has occurred. Such leaching has resulted in the formation of both surface sinkholes (e.g,. Janssen sink, Panning sink) and subsurface cavities (e.g., Knackstedt cavity).
Janssen sink is an example of slow and gradual surface subsidence, characterized by the predominantly ductile deformation of remnant salt. On seismic data, the feature is manifested as an upwards-expanding zone of measurable subsidence. Panning sink, in contrast, is an example of catastrophic surface subsidence. In cross section, the feature is presented as an inverted coneshaped, vertically migrated collapse cavity (chimney).
The Knackstedt void is a bridged cavity, characterized by a vertically migrating collapse chimney, the roof of which is presently bridged above the original top of the salt. It is anticipated that this void will eventually close and that a surface sinkhole will develop on site. The nature of the sinkhole (i.e., gradual subsidence or catastrophic collapse) will be partially dependent upon: 1) the rate of continuing dissolution, 2) the rate of effective cavity closure due to creep and stoping, and 3) the shear strength of the post-salt strata.
Rock salts exhibit unique physical properties and mechanical behavior. In situ, they are remarkably soluble, relatively impermeable and nonporous, almost incompressible, highly ductile, and rather easily deformed by creep (Baar, 1977).
In the presence of unsaturated waters, the dissolution of rock salt is essentially instantaneous, relative to the time-scale of the transport mechanisms (molecular diffusion, free convection, and forced convection). The plastic behavior of rock salt is demonstrated by salt glaciers and by flowage patterns observed in salt domes (Talbot and Jarvis, 1984; Richter-Bernburg, 1987).
Dissolution of rock salts in the subsurface can create pore space, differential stresses, creep and ultimately subsidence. There are two basic types (end members) of subsidence: 1) gradual subsidence characterized by relatively low rates of dissolution and the ductile deformation of remnant rock salt and 2) catastrophic subsidence characterized by relatively rapid rates of dissolution and brittle deformation of post-salt sediment (Ege, 1979; Rokar and Staudtmeister, 1985). Ductile deformation is typified by upward-expanding zones of subsidence. In contrast, brittle deformation is typified by a vertically propagating cavity or collapse chimney. Particularly in this later case, measurable surface subsidence may not occur; pending further dissolution, the cavity may be bridged effectively and/or infilled as a consequence of stoping.
Natural creep limits--limits of elastic behavior--of rock salts are extraordinarily small compared to most other rocks and are difficult to determine in the laboratory. Indeed, most researchers think that rock salt does not have a yield point; they conclude that over time, rock salt will eventually exhibit plastic deformation (i.e., creep). Total strain of rock salt is given by:
e = ee + ep + et + es + ea
where ee is elastic strain due to loading, ep is plastic strain produced during loading, et is transient or primary creep strain, es is secondary or steady-state creep strain, and ea is accelerating or tertiary creep strain. According to Carter and Hansen (1983), ee and ep are generally less than one percent (<1 %) and are not particularly significant with respect to the long-term creep of rock salt. These authors also state that the accelerating creep strain ea is generally observed at stresses above one-half of the short-term breaking strength in unconfined creep tests and in low-temperature, low-pressure triaxial creep tests. Under these conditions, microfracturing leads to macroscopic failure by faulting (glide mechanism).
Transient creep et (low-temperature creep mechanism, LT) is nonrecoverable and decelerating. This type of creep stems from constraints placed on dislocation glide at low temperatures, where diffusion rates are low and dislocations cannot surmount obstacles to glide and climb by cross slip. Each increment of strain makes further motion more difficult (strain hardening), thus creep rate decreases continuously with time.
According to Carter and Hansen (1983), steady-state creep e, encompasses solutionprecipitation creep, high-temperature (HT) creep, Cobble creep, and Nabarro-Herring (N-H) creep. HT creep can be thought of as nondecelerating LT creep. With respect to the HT mechanism, vacancy diffusion in the higher temperature regime is thought to allow for climb by dislocation intersection processes. In the same temperature regime, but at very low stresses, stress-induced bulk vacancy diffusion (Nabarro-Herring creep) or grain-boundary diffusion are thought to occur.
In the presence of water, solution-precipitation creep can occur within the lowtemperature, low-pressure regime. This mechanism is described by Urai et al. (1986) as solution-transfer creep--a dynamic recrystallization process. Presence of even trace amounts of brine has a marked effect on the deformation of rock salt in laboratory tests. Tests on dry, dilated salt show more-or-less conventional dislocation creep behavior (glide). Brine-bearing samples, in contrast, show a marked weakening at low strain rates (low-differential stress). According to Urai et al. (1986), this is associated with dynamic recrystallization and a change of deformation mechanism to solution precipitation creep. These authors surmise that trace amounts of brine are present in rock salt in situ and that the presence of such fluid accounts for the observed discrepancy between typical laboratory and in situ observations. Rock salt under typical laboratory conditions (dry) deforms as an elasto-plastic; rock salt in situ deforms as a plastic. Indeed, the salt glaciers in Iran flow under gravitational stresses alone.
According to Jackson and Talbot (1986), strain rates for the in situ deformation of rock salt vary by over eight orders of magnitude from 10-8 sec-1 to 10-16 sec-1. The most rapid rates are those of borehole closure during accelerating creep (10-8 sec-1), mine closures and steady-state borehole closures (10-9 sec-1 to 10-11 sec -1), and namakiers (salt glaciers; 10-8 sec-1 to 10-11 sec-1). The rates of diapiric extrusion assisted by folding (10-13 sec-1) and the rates for the most active phase of gravity-driven diapiric growth are significantly lower (10-8 sec-1 to 10-11 sec-1). These rates are significantly lower than the strain rates at which laboratory specimens are typically tested (> 10.7 sec-1).
Solubility of halite (359 g NaCl/lH2O at 25°C) varies somewhat (depending upon temperature, pressure, and the concentrations of other solutes), but it is one to three orders of magnitude higher than the solubilities of anhydrite and limestone under normal ground-water conditions. Dissolution of rock salt is essentially instantaneous relative to the time scale of the transport process in the presence of unsaturated water. The rate of solid rock salt removal is therefore controlled by convective and/or diffusive flux of sodium and chloride ions away from a halite-bearing formation. Transport mechanisms include molecular diffusion, free convection, and forced convection.
Mass transport by diffusion is a very slow process. Davies (1989) cites the following example: in the situation where a halite unit is separated from an underlying freshwater aquifer by a lO-m (33-ft)-thick aquiclude having a De value of 10.11 m2/sec, regional halite removal rate is on the order of 5 microns per year. In most natural situations, water in the aquifer has higher initial salinities, and De values of the aquiclude are a few orders of magnitude lower. Therefore, halite removal rates controlled by diffusion are typically much less than one micron per year.
According to Davies (1989), mass transport by free convection (driven by gravity acting on an inverted fluid density gradient) is much faster than transport by diffusion alone. Davies cites, as an example, a situation where a 1-m (3.3-ft)-wide fracture zone with a hydraulic conductivity of 10-4 cm/sec transects the aquiclude described in the previous paragraph. Localized halite-removal rate for this scenario is on the order of a few centimeters per year, which is orders of magnitude higher than the removal rate for diffusion alone.
Once salt-rich brine passes from a fracture zone into an underlying aquifer, the mode of mass transport is altered significantly. Forced convection through the aquifer, driven by a regional head gradient, becomes the primary transport mechanism. However, if the vertical component of the external head gradient is small, the vertical component of flow may still be primarily driven by buoyancy (Davies, 1989).
Salt is characterized by an ability to deform in either a ductile (plastic) or brittle manner, depending on temperature, stress state, and deformation rate. At temperatures expected for the salt dissolution-subsidence process, the primary ductile-deformation mechanisms for rock salt are dislocation glide (glide creep) at moderate differential stresses and moderate deformation rates, and solution-precipitation creep at low differential stresses and low deformation rates. If intercrystalline water penetrates the subsiding salt mass, deformation by intergranular liquid diffusion (solution-precipitation creep) is capable of producing strain rates that are orders of magnitude higher than are possible in relatively dry salt at the same stress states (Davies, 1989).
There are two basic types of subsidence in response to the dissolution of subsurface rock salt: 1) gradual subsidence characterized by relatively slow rates of dissolution and ductile deformation of remnant rock salt, and 2) catastrophic subsidence characterized by relatively rapid rates of dissolution and brittle deformation of post-salt strata. These two types of subsidence represent the end members of a continuous range of subsidence processes. Ductile deformation typically generates an upward-expanding zone of subsidence; brittle deformation in contrast is characterized by an inverted, cone-shaped, vertically migrating collapse cavity (chimney). Whether measurable subsidence is expressed at the surface depends upon several factors including the timing of the dissolution, the areal extent and volume of the leached rock salt, the effect of stoping, the depth to the rock salt, and the response of the overburden. For example, measurable subsidence may not be exhibited by those sediments deposited after the latest phase of dissolution and associated collapse. In a second scenario, as a result of stoping, bridging, and rock-salt creep, the vertical migration of the collapse chimney could effectively cease, pending additional dissolution. Particularly in the former case, structural relief could be induced in the subsurface as a result of the compaction of the "compensation" sediments (Oliver and Cowper, 1983).
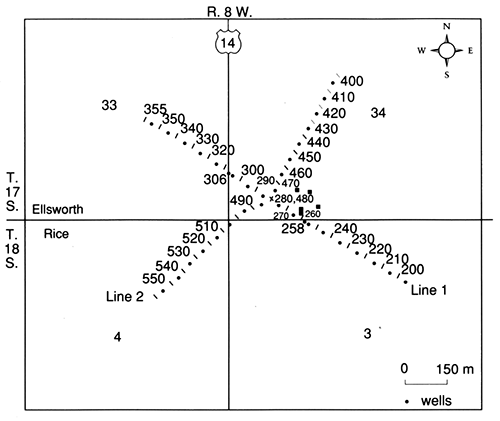
Janssen sink is located in southern Ellsworth County about 13 mi (21 km) north of Lyons on K-14, about 3 mi (5 km) west of Geneseo (fig. 1). Gradual surface subsidence has been occurring about the Janssen "B" #6 well. Janssen "B" #6 was a production well in the Geneseo-Edwards oil field later converted to saltwater disposal. By 1988, about 3 m (10 ft) of subsidence had occurred; subsidence continues to occur at a rate on the order of 0.5 m/yr (Knapp et al., 1989)
Figure 1--CDP-number location map of Janssen sink seismic lines in Ellsworth County (Knapp et al., 1989). COP interval is 5 m (16 ft).
In an effort to elucidate the subsurface morphology in the vicinity of the Janssen sink, two crossing seismic lines were acquired by the Kansas Geological Survey (figs. 1, 2, and 3). Good data quality of the two crossing seismic profiles allows a satisfactory interpretation of the present position of the Hutchinson Salt (Anderson et al., this volume) and some overlying strata. Both sections show similar wavelet character of about 170 msec. Below 170 msec the data quality is poor with nothing more than subtle hints of primary reflectors continuous across the sections. As is illustrated on the seismic data, Janssen sink is characterized by an expanding zone of measurable subsidence.
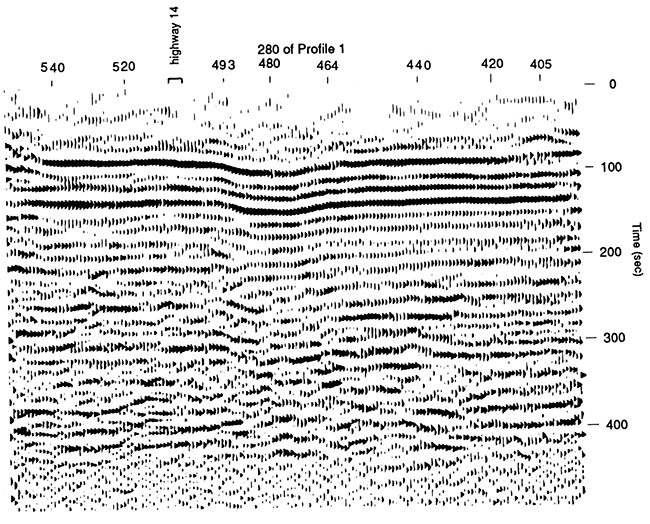
Figure 2--Seismic section of profile 1 (after Knapp et al., 1989). The interpreted upwards-expanding zone of measurable subsidence is consistent with the gradual subsidence observed at the surface. Seismic control suggests that the zone of dissolution is more-or-less circular and symmetric, supporting the thesis that leaching was initiated by the inadvertent discharge of unsaturated (with respect to halite) oil-field brines through corroded pipe.
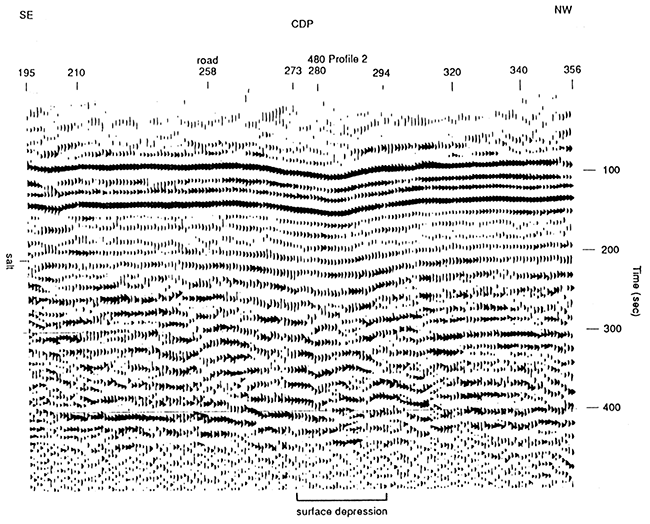
Figure 3--Seismic section of profile 2 (after Knapp et al., 1989). The interpreted upwards-expanding zone of measurable subsidence is consistent with the gradual subsidence observed at the surface.
Well logs from the area show the Stone Corral and the Hutchinson Salt at 120 m and 260 m (394 ft and 853 ft), respectively (Anderson et al., this volume). There is about 45 m (148 ft) of relatively uniform salt underlying approximately 140 m (459 ft) of red-bed sequences of shale, limestone, sandstone, and anhydrite. Strong acoustic boundaries exist below 350 m (1,148 ft), but due to the lack of depth-penetration of seismic energy, identification and correlation of these events is tenuous at best.
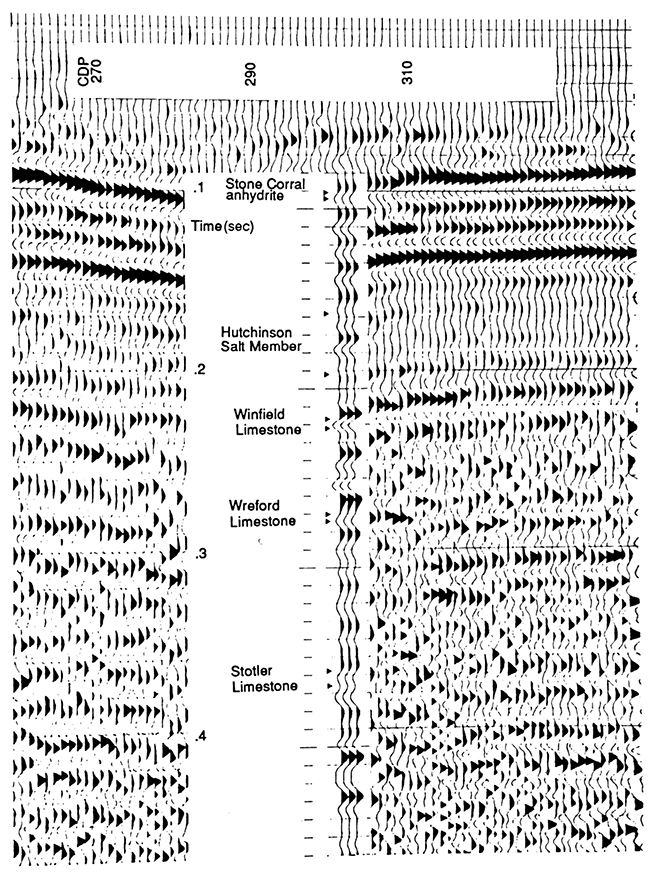
Profile 1 traverses the sinkhole from southeast to northwest, intersecting the county road at CDP 258 and K-14 at CDP 306 (figs. 1 and 2). Surface expression of the sinkhole extends from CDP 270 to CDP 295 on profile 1. Modeling by Neely (1985) shows the Stone Corral to be the strongest reflector in the section (fig. 4). It is at about 140 msec at the flanks of the section. The top of the Hutchinson Salt is at about 220 msec and its bottom at about 240 msec.
Figure 4--Comparison of processed field seismic and synthetic data for profile 1 (fig. 2; Neely, 1985).
Profile 2 (fig. 3) crosses the sink from northeast to southwest and crosses the county road and K-14 intersection from CDP's 504 to 508. As in profile 1, very strong reflectors can be identified above 140 msec (Stone Corral) with poor data quality below that two-way travel-time. The character of the energy present on the seismic section of profile 2 is easily matched with that on profile 1. CDP 480 on profile 2 and CDP 280 on profile 1 represent the same subsurface point. Displacement of the salt reflector between CDP 464 and 491 appears to be about 8 msec. This would imply between 8 m and 16 m of actual subsidence in the subsurface at the depth of the salt (using average seismic velocities for the post-salt strata of 2,000 m/sec and 4,000 m/sec, respectively).
Surface subsidence (on the order of 3 m; 10 ft) near the center of the sink is significantly less than the estimated relief near the top of the Hutchinson Salt (between 8 m and 16 m; 26 ft and 52 ft). There are several possible explanations: 1) As evidenced by the zone of subsidence, the areal extent of measurable subsidence increases at shallower depths; 2) Stoping of post-salt strata could have reduced the overall volume of subsidence at shallower depths; 3) The seismic estimates of subsurface structural relief near the center of the sinkhole could be high (seismic velocities could be lower than estimated due to subsidence-related fracturing).
The top of the Hutchinson Salt Member in the Panning sink area (fig. 5) is at a depth of about 300 m (984 ft); it has a gross thickness (including shale and anhydrite interbeds) of about 100 m (328 ft). The rock salt is overlain by impermeable shales and, typically, by a shallow freshwater aquifer.
Figure 5--Index map showing the location of the Panning sink, Barton County (after Walters, 1978).
The principal reservoir facies in the Panning area, the Lower Ordovician Arbuckle dolomite at a depth of about 3,000 m (9,843 ft) is an enormously large aquifer with a strong water drive (fig. 6). Scores of wells in the Panning area produced 500 bbls or more of saltwater per day. Most of this salt is re-injected into the Arbuckle through high-volume, gravity-fed injection wells.
Figure 6--Diagram of salt section in Panning 11A (Walters, 1978).
A. After setting 6-inch (15.2-cm) oil-string casing.
B. Oil well. Oil is pumped up 2-inch tube.
C. Gamma-neutron log; tubing removed.
D. Saltwater-disposal well (SWD). Waste brine moving down 3-inch plastic-lined tube.
The disposed brine is unsaturated with respect to sodium chloride and corrosive to metals. Hence, within the disposal wells there is potential for appreciable salt dissolution, i.e., high energy input, large volumes of water unsaturated with respect to chlorides, and an enormous brine outlet in the Arbuckle dolomite.
The Panning sinkhole (figs. 5, 6, and 7) developed catastrophically around an abandoned oil well (Panning 11A) at that time in use as a saltwater-disposal well. The associated chimney can be described as an inverted, cone-shaped, vertically migrated collapse cavity. The following modified excerpt from Walters (1978) represents that author's reconstruction of the sequence of events that led to the formation of the Panning sinkhole.
Figure 7--Cross section through the Panning 11A disposal well (Walters, 1978).
A. Waste brine moving down inside the 6-inch (15.2-cm) casing (plastic-lined tube removed) and circulating by Permian salt section through holes in casing.
B. Well abandoned; derrick removed.
C. Well plugged with cement in surface pipe, and "bridged" in Cambrian-Ordovician Arbuckle dolomite.
D. Sinkhole forming April 24, 1959.
E. 1959 to 1976, Legend for fig. 6.
September 1938 (fig. 6A): During the drilling of Panning 11A, freshwater-drilling fluid dissolved salt to a diameter of 1.37 m (4.49 ft). Note that the production casing did not reach this high up-hole.
1938-1943 (fig. 6B): No dissolution of salt took place while over 100,000 bbls of oil were being processed through tubing. Shale interbeds in the shale section collapsed and fell, accumulating in the void space from 367 m to 389 m (1,204 ft to 1,276 ft), just above the constriction in the hole size at the first anhydrite bed.
1943-1946 (fig. 6C): A cased-hole gamma-ray neutron log recorded in a nearby hole showed the static fluid level of the Arbuckle aquifer to be 278 m (912 ft) from the top of the hole. No salt dissolved in these years during which the well was temporarily abandoned as non-commercial after pumping 99% water due to the depletion of oil.
1946-1949 (fig. 6D): The well was converted for use as a saltwater disposal well by recementing the casing. Note the presence of cement opposite the lower salt section and the absence of cement opposite the upper salt section. No salt dissolved. Brine was disposed through tubing by gravity flow.
1949-1953 (fig. 7A): Tubing was removed from the well and brine was disposed directly down the casing. Corrosion resulted in casing leaks, permitting access for 72 gal/minute of brine, 14,000 ppm chlorides, to circulate across the salt face, then downward into the Arbuckle aquifer. A huge cavem, larger than 90 m (295 ft) in diameter, dissolved into the salt. Progressive falls of the shale interbeds and shale roof rocks partially filled the cavern. Successive roof falls caused the void space to gradually migrate upward to near the Stone Corral Anhydrite (depth 142 m; 466 ft), causing in turn, surface subsidence, ponding of water, and tilting of the derrick.
January 1959 (fig. 7B): The Panning 11A was abandoned but not plugged. The derrick was removed because surface subsidence caused it to tilt dangerously. With disposal-brine flow discontinued, salt dissolution ceased.
April 1959 (fig. 7C): The Panning 11A was plugged with 150 sacks of cement in the surface pipe to a depth of 58 m (190 ft), and the Arbuckle was bridged. There was no other plugging. The underground void space at shallow depth was now isolated from both the near surface and the Arbuckle aquifers. Brine in the void space drained downward gradually to reach equilibrium with the intermediate aquifers, leaving the near-surface void space unsupported by fluid and under vacuum.
April 24, 1959 (fig. 7D): When the uppermost keystone bedrock at a depth of 32 m (105 ft) fell into the newly drained shallow void space, the surface sinkhole formed rapidly in the three hours from 9:00 a.m. until noon, with lesser subsidence continuing to about 9:00 p.m. As the shallow void space filled with freshwater and air, falling material such as concrete derrick comer blocks fell into the narrow aperature and compressed, then ejected, the air. The casing collapsed and fell. At first, the loose sand and gravel moved downward in a freshwater slurry at a rate faster than the flow of the aquifer, forming a deep cone-shaped pit. As the void space filled, water accumulated in the surface sinkhole.
April 1959-1978 (fig. 7E): The circular sinkhole diameter near 100 m stabilized, forming a freshwater pond 20 m (66 ft) deep, volume near 57,000 m3 (358,530 bbl). In the 17 -year interval, the surrounding fence buckled downward and inward by only about 0.6 m (1.9 ft) on each side, indicating resumption of stable subsurface conditions. Transported sand and gravel filled the shallow space voided by roof falls. The former cavern in the salt is filled and plugged with fallen Permian shale and red beds; hence, it is thought that no further dissolution is occurring.
The Hutchinson Salt in the Knackstedt area, McPherson County, Kansas (T. 20 S., R. 5 W.), extends from approximately 135 m to 210 m (443 ft to 689 ft) below the ground surface. At the Knackstedt saltwater-disposal well site, a bridged and air-filled, subsurface cavity was discovered when investigations into the loss of static water level resulted in a wireline video inspection of the well casing (fig. 8). The video discovered the absence of casing as well as any visible borehole walls between 97 m and 146 m (318 ft and 479 ft) in depth. The bottom of the borehole, which originally extended over 900 m (2,953 ft), was then plugged with neat cement. In an attempt to fill the void, 8400 m3 (52,836 bbl) of gravel were poured into the well from the surface, raising the floor of the cavity to 135 m (443 ft), leaving approximately 38 m (125 ft) between the top of the gravel pile and the top of the air-filled void.
Figure 8--Location map for the Knackstedt site (Miller et al., 1988). The saltwater-disposal well site, the seismic shotpoint lines, the map extent of the interpreted cavity, and other geographic information are superposed.
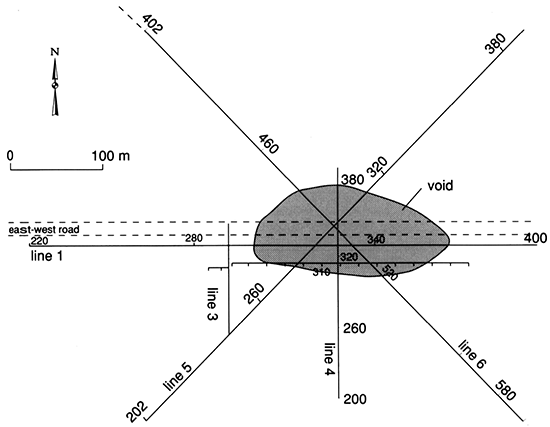
During the filling process, the hole was occasionally flushed with a saturated brine solution in an attempt to level the coning of the pile of material directly beneath the borehole opening in the ceiling of the void. No static fluid level was ever recorded after a brine-solution flush. Absence of a measurable water level in the hole at any time during the past several years, even though the alluvial sediments on the overlying shale roof contain a relatively shallow water table, suggests that the void is hydraulically connected to an aquifer with a hydrostatic head at least 160 m (525 ft) below the earth's surface. The aquifer could either be the intended oil-brine disposal horizon several hundred meters below the rock salt (the hole was filled with neat cement, rendering this unlikely) or a salt-solution zone extending laterally from the cavity location. The source of the waters causing most of the dissolution was probably unsaturated (with respect to halite) oil brine that escaped from the failed injection casing. Ground waters unsaturated with respect to halite could have been, and probably are, presently entering the large cavity. Therefore, this could be causing further dissolution expansion of its dimensions.
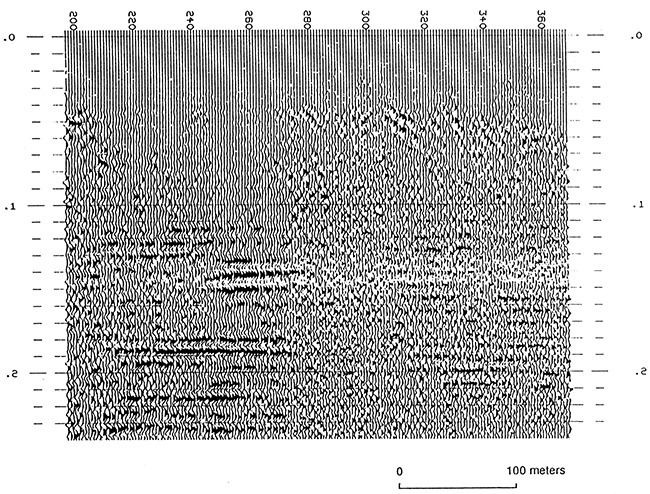
In an attempt to better define the morphology of the Knackstedt cavity, a preliminary seismic-reflection survey was conducted by the Kansas Geological Survey (fig. 9). These data suggest that the cavity has a basal areal extent of about 20,000 m2 (5 acres) (Miller et al., 1988).
Figure 9--Seismic section for line 6 (Miller et al., 1988). The interpreted cavity location is from trace 275 to 316.
Basinward of the present-day main eastern edge of the Hutchinson Salt, localized dissolution of both natural and anthropogenic origin has occurred. Such leaching has resulted in the formation of both surface sinkholes (e.g., Janssen sink, Panning sink) and subsurface cavities (e.g., Knackstedt cavity).
Janssen sink is an example of slow and gradual surface subsidence, characterized by the predominantly ductile deformation of the remnant salt. On seismic data, the feature is manifested as an upwards-expanding zone of measurable subsidence. Panning sink, in contrast, is an example of catastrophic surface subsidence. In cross section, the feature is presented as an inverted cone-shaped, vertically migrated collapse cavity (chimney).
The Knackstedt void is a bridged cavity, characterized by a vertically migrating collapse chimney, the roof of which is presently bridged above the original top of the salt. It is anticipated that this void will eventually close and that a surface sinkhole will develop on site. The nature of the sinkhole (i.e., gradual subsidence or catastrophic collapse) will be partially dependent upon: 1) the rate of continuing dissolution, 2) the rate of effective cavity closure due to creep and stoping, and 3) the shear strength of the post-salt strata.
Baar, C. A., 1977, Applied salt-rock mechanics 1: Elsevier Scientific Publishing Company, 294 p.
Carter, N. L., and Hansen, F. D., 1983, Creep of rock salt: Tectonophysics, v. 92, p. 275-333
Davies, P. B., 1989, Assessing deep-seated dissolution-subsidence hazards at radioactive-waste repository sites in bedded salt; in, Richard H. Jahns Memorial Volume, A. M. Burnham et al., eds.: Engineering Geology, v. 27, p. 467-487
Ege, J. R., 1979, Surface subsidence and collapse in relation to extraction of salt and other soluable evaporites: U.S. Geological Survey, Open-file Report 79-1666 [available online]
Jackson, M. P. A., and Talbot, C. J., 1986, External shapes, strain rates, and dynamics of salt structures: Bulletin Geological Society of America, v. 97, p. 305-323
Knapp, R. W., Steeples, D. W., Miller, R. D., and McElwee, C. D., 1989, Seismic-reflection surveys at sinkholes in central Kansas; in, Geophysics in Kansas, D. W. Steeples, ed.: Kansas Geological Survey, Bulletin 226, p. 95-116 [available online]
Miller, R. D., Steeples, D. W., Myers, P., and Somanas, D., 1988, Seismic reflection surveys at the Knackstedt saltwater disposal well: Kansas Geological Survey, Open-file Report 88-31, 24 p.
Neeley, G. W., 1985, Waters' method synthetic seismograms applied to seismic-reflection modeling: M. S. thesis, The University of Kansas; also available as Kansas Geological Survey, Open-file Report 85-25, 82 p.
Oliver, J. A., and Cowper, N. W., 1983, Wabamun salt removal and shale compaction effects, Rumsey area, Alberta: Bulletin of Canadian Society of Petroleum Geology, v. 31, p. 161-168
Richter-Bernburg, G., 1987, Deformation within salt bodies: Dynamical Geology of Salt and Related Structures, p. 39-75
Rokar, R. B., and Staudtmeister, K., 1985, Creep rupture criteria for rock salt; in, Sixth International Symposium on Salt, B. C. Schreiber and H. L. Hamer, eds.: Salt Institute Inc., Virginia, v. 1, p. 455-462
Talbot, C. J., and Jarvis, R. J., 1984, Age, budget, and dynamics of an active salt extrusion in Iran: Journal of Structural Geology, v. 6, p. 521-533
Urai, J. L., Spiers, C. J., Zwart, H. J., and Lister, G. S., 1986, Weakening of rock salt by water during long-term creep: Nature, v. 324, p. 554-557
Walters, R. F., 1978, Land subsidence in central Kansas related to salt dissolution: Kansas Geological Survey, Bulletin 214, 82 p. [available online]
Previous--Seismic Signature of the Hutchinson Salt || Next--Salt-dissolution Subsidence Feature in Stafford County, Kansas
Kansas Geological Survey
Comments to webadmin@kgs.ku.edu
Web version placed online Sept. 1, 2015. Original publication date 1995.
URL=http://www.kgs.ku.edu/Publications/Bulletins/237/Anderson3/index.html