| Original published in D. W. Steeples, ed., 1989, Geophysics in Kansas: Kansas Geological Survey, Bulletin 226, pp. 55-66 | ||
Kansas Geological Survey
The article is also available as an Acrobat PDF file.
Two high-resolution seismic lines were shot by the Kansas Geological Survey near Wellsville, Kansas, during 1981 and 1982. The study site is located near the southeast margin of the Forest City basin. The data were collected using the MiniSOSIE surface seismic-energy source. The purpose of the study was to determine if this high-resolution seismic technique was capable of resolving the presence of thin sandstone bodies, called squirrel sands, located at the top of the Cherokee Group of the Upper Pennsylvanian. The sandstone bodies located within strata were deposited under cyclic conditions associated with the rise and fall of sea level. Seismic data were recorded using both source and geophone arrays to attenuate the contribution of nonvertical seismic waves. Severe low-cut (110 Hz, 24 dB/octave) filters were used to enhance the high-frequency information. After editing and muting, processing sequences were identical for each line. Final conventional stacks produced a coherent record of the subsurface. Because of a lack of sonic well-log data, an algorithm relating neutron porosity to seismic velocity was established for northeastern Kansas. The algorithm was used to produce a pseudo velocity log for a well near the seismic lines. Synthetic seismograms were created from the pseudo velocity log to aid in the interpretation of the seismic data. Analysis of the synthetic seismic data reveals that primary energy is severely attenuated by the cyclothems of the Late Pennsylvanian. There is a 12-dB decrease in transmitted energy at the top of the Cherokee Group resulting from the effects of transmission loss. As a result, it appears that the interbed multiple reflected signal becomes the dominant reflected energy. The seismic data reveal the presence of an anticline as well as several faults in the pre-Mississippian strata. It appears that it is possible to seismically locate squirrel sands that have been deposited in channels using MiniSOSIE. The presence of these channels in the subsurface results in a dimming of the overlying Fort Scott composite reflection due to interference.
In 1981 and 1982, the Kansas Geological Survey collected high-resolution seismic data along two field lines in the Paola-Rantoul oil field, Miami County, Kansas (figs. 1 and 2). The data were acquired using the MiniSOSIE surface seismic-energy source. The seismic processing was performed on the Data General MV/8000 computer at the Kansas Geological Survey.
Figure 1--Location of seismic lines and wells used in the study.
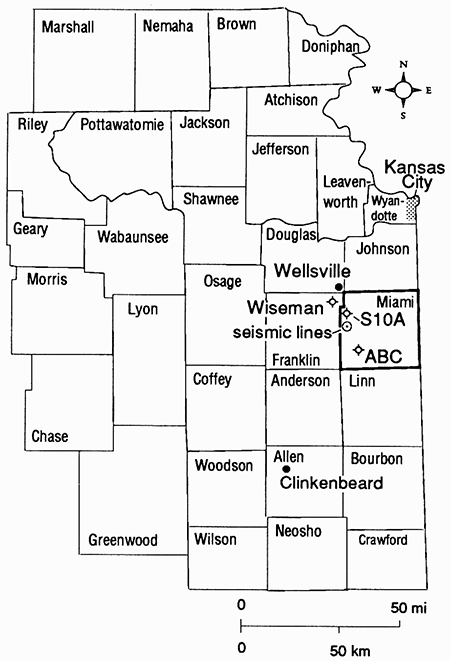
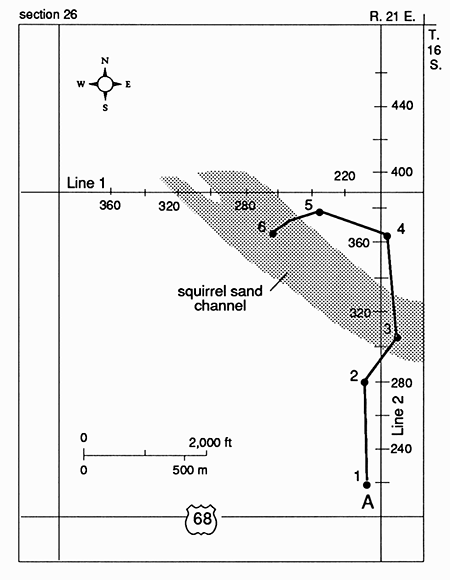
Figure 2--Orientation of seismic lines with common-depth-point (CDP) locations.
In the petroleum industry, discovery of new structural traps has declined, and greater emphasis has been placed on the search for stratigraphic traps. This has led to the development of new surface sources of seismic energy which are capable of producing high-resolution data. The purpose of this study was to determine if the MiniSOSIE seismic surface source is able to detect the presence of squirrel sands in Miami County, Kansas. These sands are thin stratigraphic traps located at the top of the Cherokee Group in Upper Pennsylvanian strata.
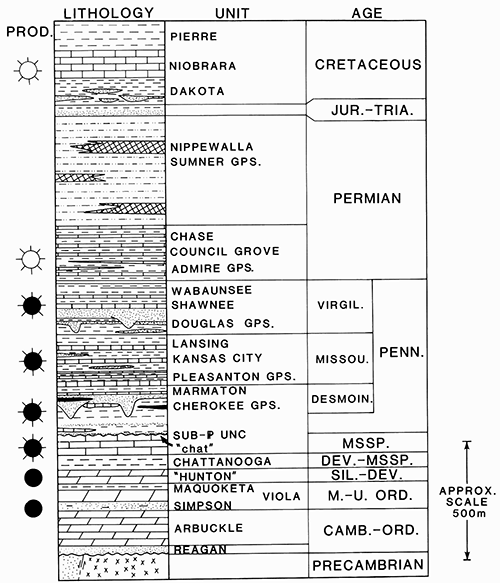
The study area is located on the southern edge of the Forest City basin in eastern Kansas. This basin is both structural and topographic in nature. The sedimentary column has an approximate thickness of 2,350 ft (700 m) in Miami County and is shown in fig. 3.
Figure 3--Columnar section of rocks in Miami County, Kansas (from Lee, 1943, fig. 1).
The Precambrian rock underlying the study area is believed to be primarily granite (Bickford et al., 1979). These rocks are unconformably overlain by Lamotte Sandstone of Upper Cambrian age. Generally, the Lamotte is arkosic in character at the base. Quartzose, dolomitic, quartz-glauconitic, and feldspathic sandstones also are present in the Lamotte (Merriam, 1963). This unit grades conformably into Bonneterre Dolomite, a glauconitic, noncherty dolomite of Late Cambrian age (Zeller, 1968). The Arbuckle Group encompasses all of the pre-St. Peter Ordovician and Cambrian rocks above the Bonneterre. Bonneterre, though indistinguishable on the well log from Arbuckle, is separated from it on the basis of stratigraphic consideration (Lee, 1943).
The Arbuckle Group at the study area includes the Eminence Dolomite, Gasconade Dolomite, the Roubidoux Formation, and Jefferson City and Cotter dolomites. There are unconformities between each of these lithologic units (Lee, 1943). The Arbuckle Group consists mainly of crystalline dolomite deposited under shallow-water conditions. Chert is common in the upper part (Merriam, 1963). At the study site, the Arbuckle is overlain unconformably by St. Peter Sandstone of Ordovician age. The St. Peter is associated with the sandy part of the Simpson Group. Undifferentiated rocks of the "Hunton group" unconformably overlie St. Peter Sandstone.
These rocks are composed of limestone and dolomite of Devonian age. Apparently, the Silurian component of the Hunton group and the Viola Limestone were eroded at the end of Silurian time (Merriam, 1963).
The Hunton group is overlain by Chattanooga Shale which was deposited during Kinderhookian time. These rocks are believed to be Devonian or Mississippian. They are separated from the Hunton group by an unconformity. Chattanooga Shale in the study area is overlain conformably by Mississippian rocks deposited during Osagian and Meramecian time. These rocks consist primarily of limestone and dolomite deposited in an epicontinental sea. Low relief of the nearby land surfaces resulted in clear-water conditions on the continental shelf which facilitated the widespread deposition of calcium carbonate associated with marine organisms (Moore, 1957).
Pennsylvanian rocks, deposited during Desmoinesian and Missourian stages, overlie those of Mississippian age in the study area. The Pennsylvanian rocks contain cyclothemic sequences. Cyclothems are cyclic, terrigenous clastic and carbonate strata deposited under cyclic conditions associated with transgressive-regressive marginal seas (Heckel et al., 1979). Each cyclothem is associated with a cycle of deposition usually consisting of, in ascending order, a transgressive carbonate, a marine shale, a regressive carbonate, and a regressive shale.
The Cherokee and Marmaton groups were deposited during the Desmoinesian stage. Relatively clean sandstones found at the top of the Cherokee have been referred to as squirrel sands. The presence of these lenticular and discontinuous squirrel sands is due to the influx of sediment associated with the repeated extensions of alluvial deltaic complexes from the east (Ebanks and James, 1974). Evidently, each extension resulted in lobes or belts of sandy deposits that prograde into marine environments. Within the Paola-Rantoul oil field in Miami County, these sands are the principal hydrocarbon-bearing units.
Younger cyclic sequences of the Marmaton, Pleasanton, Kansas City, and Lansing groups, which were deposited during the Missourian Stage, contain more limestone and smaller amounts of coal. This supports the concept of "…increasingly widespread marine invasion of the area throughout Middle and Late Pennsylvanian time, with variations in environmental conditions as the interplay of sea level, sediment supply, and basin subsidence changed" (Ebanks, 1979, p. 69).
In Miami County, tectonic forces acting upon the surrounding area since the Precambrian have had an important role in the development of the geologic column. Deformation of the earth's crust in this region has produced long periods of both deposition and erosion. A review of the regional tectonics since the Precambrian provides an opportunity to predict which geologic events that affected the stratigraphic column might result in primary reflections on the seismic-record section.
The primary reflections on a seismic section approximate the chronostratigraphic patterns of the subsurface. These reflections may be produced by stratal surfaces or unconformities (Mitchum, Vail, and Thompson, 1977). Stratal surfaces are associated with bedding surfaces and are chronostratigraphic because they represent time-synchronous surfaces of deposition. Unconformities are chronostratigraphic because they separate older rocks from younger ones.
A primary reflection is produced if there is a significant acoustic-impedance contrast across a chronostratigraphic surface. The acoustic impedance (Z) of a rock is equal to the product of the density and seismic velocity (V) of the rock. For vertically incident seismic waves, the amplitude of the reflection, or reflection coefficient (R), is equal to the change in acoustic impedance across the surface divided by twice the average acoustic impedance:
R(i) = [Z(i) - Z (i - 1)] / [Z(i) + Z(i - 1)]
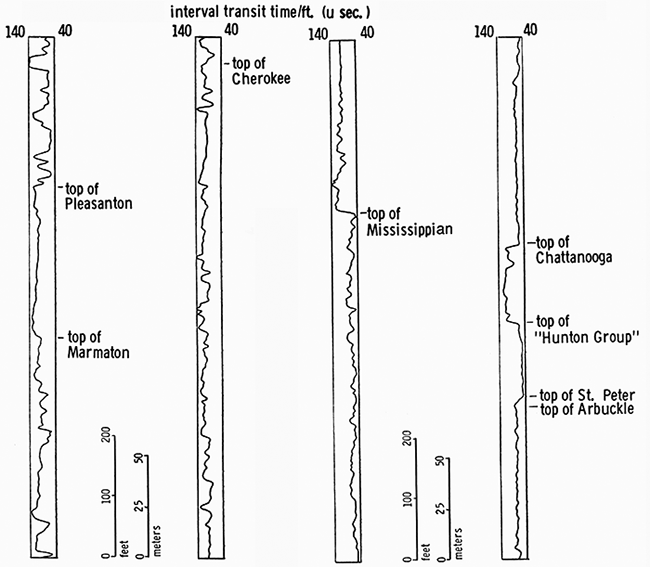
Since the seismic velocity of sedimentary rock varies by a factor of 3.3, while density varies by a factor of 1.4 (Telford et al., 1976), the acoustic-impedance contrast is primarily dependent upon velocity. Therefore, density information is often considered constant when calculating the reflection coefficients. Consequently, using only a sonic log, it may be possible to relate primary reflections with particular tectonic events. Fig. 4 is a sonic log of the strata overlying the Arbuckle in the ABC No. 1 well. This well is located 7 mi (11 km) southeast of the study site (fig. 1). Reflections on the seismic section may be expected when there are large changes in interval transit time over short-depth intervals.
During Cambrian and Early Ordovician time, the Miami County area was affected structurally by the presence of the subsiding synclinal Ozark basin. Contemporaneous and structurally related to the development of the basin was the rise of the Southeast Nebraska arch. Unconformities associated with structural uplift (the tops of the Bonneterre and Eminence dolomites) and associated with eustatic changes in sea level (the top of the Roubidoux Formation) are both present in the geologic column.
From the time the St. Peter Sandstone was deposited to the beginning of deposition of Mississippian limestones, the strata in Miami County were uplifted and tilted toward the North Kansas basin. It is widely believed that subsidence of this basin is associated with upward movement of the Ozark uplift as well as the formation of the Chautauqua arch and Central Kansas uplift. The unconformity at the top of the St. Peter Sandstone is related to the erosion of pre-Devonian sediments deposited within the basin. This contact, between the Devonian Hunton group and the Middle Ordovician St. Peter Sandstone, is a distinct seismic discontinuity. The seismic discontinuity at the top of the Hunton group is due to an unconformity between the Hunton group and the overlying Chattanooga Shale (Lee, 1943). The seismic discontinuity at the top of the Chattanooga Shale is due to a conformable stratal surface between the Chattanooga and the overlying Chouteau Limestone (Merriam, 1963).
During Mississippian time, deformation along the Nemaha anticline resulted in the formation of a broad syncline in northeastern Kansas. According to Rascoe and Adler (1983), the uplift and resulting Nemaha anticline were due to the collision between the North American craton and the northern margin of the South American plate during the Mississippian. Lee (1943) considered this syncline to be the ancestral Forest City basin. Sediments were deposited into this basin during Mississippian time. Evidently, these sediments were eroded near the end of the Mississippian due to continued uplift of the Nemaha anticline. Of lesser importance was uplift of the Ozark region to the east (Lee, 1943). The erosional surface between Mississippian rocks and overlying Pennsylvanian strata is one of the most distinctive discontinuities on the sonic log shown in fig. 4.
Figure 4--ABC Velocity well log.
During the early Pennsylvanian, the eastern flank of the Nemaha anticline subsided relative to the western flank. To the east of the study area, this resulted in large-scale block faulting along the Humboldt fault. As a result of the subsidence, two basins were formed to the east of the ridge. These were the Forest City basin in northeast Kansas (including the study area), northwest Missouri, and southwest Iowa, and the Cherokee basin in southeast Kansas. The basins are separated by the Bourbon arch, a low, broad anticline. During Pennsylvanian time, the center of subsidence of the Forest City basin was west of the center of subsidence of the ancestral Forest City basin (Lee, 1943). In the study area, deposition continued throughout the Permian and possibly through the Cretaceous as well (W. L. Watney, personal communication, 1984).
During the Pennsylvanian, the entire Kansas shelf was subjected to repeated cycles of marine transgression and regression. Changes in sedimentation were due mainly to eustatic changes in sea level (Watney, 1980). A review of fig. 4 reveals that Pennsylvanian strata are characterized by rapid and repeated changes in sonic velocity. In this region of the geologic column, strong primary seismic reflections are associated with both unconformities and stratal surfaces. An example of the latter is the boundary between transgressive limestones and marine shales.
The MiniSOSIE technique uses a Wacker Model 151 GY earth-compactor energy source. A two-horsepower engine is used to drive a piston which has a metal plate attached to its base. The rate at which the plate strikes the ground is governed by the operator via a throttle. The earth compactor is operated continuously over the length of the source array until information from a prespecified number of impulses is recorded. Typically, 1,000-2,000 impulses are recorded. According to Barbier and Viallix (1974), useful information up to 200 Hz has been recorded.
Vertical stacking is performed to improve the signal-to-noise ratio at a particular shotpoint. It involves the multiple impacting of the source and summing the data recorded from each impact. Vertical stacking occurs in real time as information from the surface is continuously recorded. For the initial impulse, information is recorded at each geophone group. The next impulse occurs before the recording interval of the first impulse has passed. The information from the second shot is superimposed on the information from the first shot. The information from subsequent impulses are in turn superimposed on the data from the earlier pulses to form a composite record (Barbier and Viallix, 1974). To decipher this composite record, a special-20-bit MiniSOSIE processor is used. The processor has a memory associated with it which has 1,000 memory sample-point locations per data channel. The result of vertical stacking is a cancellation of random noise coupled with enhancement of geologic information.
Synthetic seismograms were created to enhance the final interpretation of the seismic section by aiding in the correlation of stratal surfaces and unconformities with seismic-reflection events and in the identification of surface multiples. The creation of a synthetic seismogram requires, at a minimum, subsurface-velocity information in the form of a velocity log. If no velocity logs are available, as in the study area, then it is sometimes possible to generate a pseudo velocity log. Rudman et al. (1975) show that accurate synthetic-velocity information could be empirically obtained from 16-inch short-normal resistivity logs using the scale function developed by Kim (1964).
The neutron-porosity and velocity logs for the ABC well were digitized and log values determined on a foot-by-foot basis over identical800-ft (240-m) intervals. A fourth-order polynomial least-squares fit was calculated between interval transit time (l/sonic velocity) and neutron-porosity.
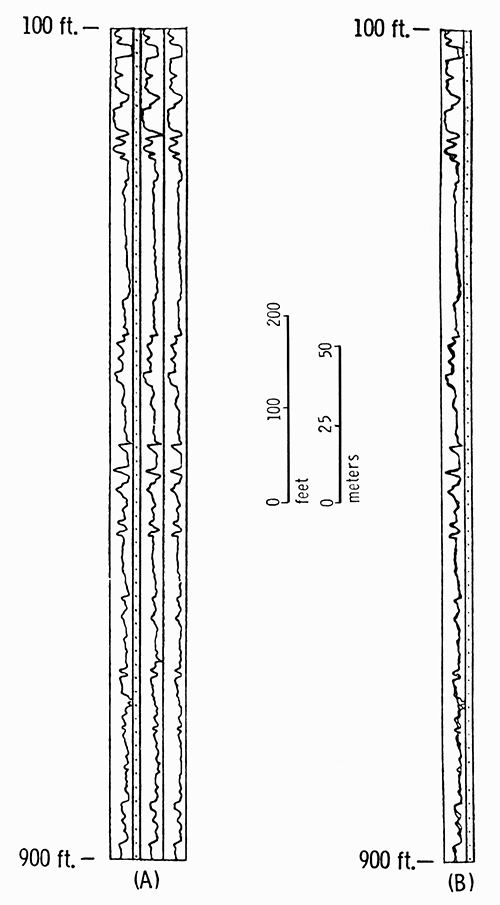
A pseudo velocity log from the well was generated from the neutron porosity data using the derived empirical relationship. Utilizing the Kansas On-line Automated Log-Analysis System (KOALA) developed by Doveton and Cable (1980), plots were created of the neutron, velocity, and pseudo velocity logs (fig. 5). Differences in magnitude and timing of events can be attributed to several factors. The velocity log measures the seismic velocity of the strata. The neutron log, however, measures the hydrogen nuclei density of the borehole formations. The presence of chemically bonded water in shale has the same effect on neutron porosity as free liquids. The result is that anomalously low acoustic velocities are determined in shale formations. In addition, the conversion algorithm functions as a low-pass filter.
Figure 5--ABC well logs: a) velocity, neutron porosity, and pseudo velocity (left to right), and b) overlay of velocity and pseudo velocity.
No neutron-porosity well logs were available for wells in the study area. However, the neutron count from the S10A well located near the seismic lines was converted to a neutron porosity over the length of the well log. A pseudo velocity well log was then generated for this well using the neutron-porosity interval transit-time conversion algorithm. For the first 30 ft (9 m), velocity information from the Wiseman 'A' 1-6 well was used. For the unlogged strata below the S10A well, ABC well-velocity information was used.
The reflection-coefficient series was created from the S10A pseudo velocity log. Transmission losses and multiples also were incorporated. The multiple-generating technique was based on work in signal analysis by Wuenschel (1960) and Treitel and Robinson (1966). A reflection coefficient of 0.25 was used for the free surface of the earth.
The primary reflection-coefficient series is shown in fig. 6a. The estimated source wavelet (15-30-100-150 bandpass with a -90° phase shift) is shown in fig. 6b. Fig. 6c is the synthetic seismogram due to primary reflection but with no transmission losses. It indicates that primary reflection ideally should occur as deep as 370 msec (2,311 ft [705 m]) in the S10A well. If transmission losses are taken into account (fig. 6d), then primary energy is highly attenuated in the first 110 msec (580 ft [180 m]). The interval between the surface and the Fort Scott Limestone (located at 110 msec) consists of cyclothems. O'Doherty and Anstey (1971) state that in cyclic patterns of sedimentation there is a significant decline in transmitted energy. Above the Fort Scott Limestone are many reflection coefficients greater than 0.10 and several greater than 0.20. Consequently, a 12-dB decrease in transmitted energy occurs at the base of the Fort Scott resulting from transmission loss.
Figure 6--S10A synthetic seismogram: a) reflection-coefficient series, b) seismic wavelet (15-30-100-150, 090-degree phase shift), c) synthetic with primary energy only, d) synthetic with primary energy plus transmission losses, e) synthetic with primary and multiple energy (transmission losses included).
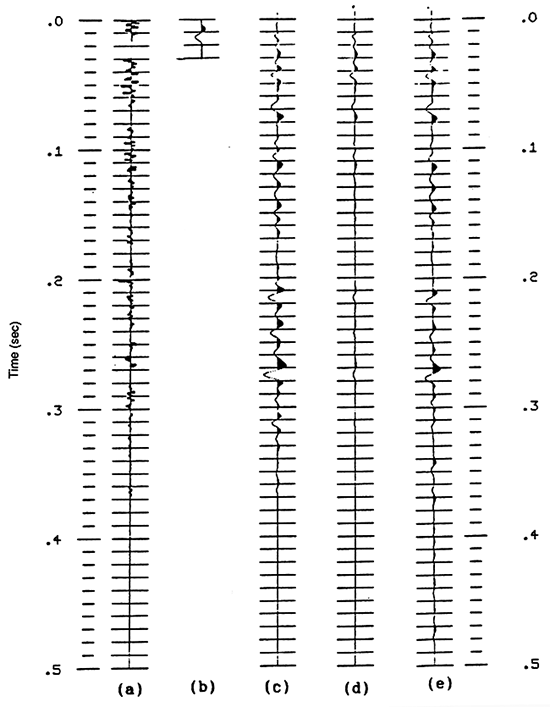
In fig. 6e, multiples were included in the creation of the synthetic seismogram. It is apparent that the inclusion of interbed multiples compensates to some degree for the loss of energy from the effects of transmission. According to O'Doherty and Anstey (1971, p. 444), "the multiple reflected signal in a series of thin plates bounded by interfaces of opposite polarity is always the same sign as the direct transmitted signal and tends to overtake it in amplitude." That is, the multiple reflected signal can become the dominant reflected energy in a cyclothemic environment.
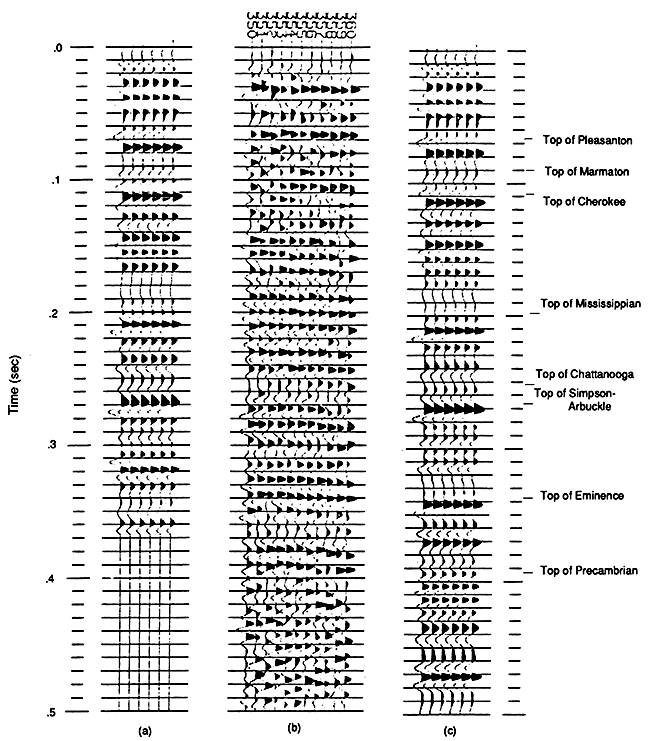
The inclusion of multiple energy has two important effects upon a synthetic seismogram. First, the wavelet which has passed through a cyclic section is broader than the primary wavelet of fig. 6c. This is due to the contribution of the multiples which are delayed in time relative to the primary wavelet and have low-pass filtering effect. The higher frequencies of the signal are more sensitive to changes in the signal (Schoenberger and Levin, 1974). Also, the arrival times of the wavetrain peaks with multiples lag behind those of the signal with primary reflections only. Again, energy from multiples is delayed with respect to direct arrivals (Shoenberger and Levin, 1978). Fig. 7 shows the correlation between the S10A synthetic seismogram and the seismic data.
Figure 7--Correlation between S10A synthetic seismograms and MiniSOSIE data (from line 1): a) synthetic with primary energy only, b) seismic data, c) synthetic with primary and multiple energy (transmission losses included).
The initial step in interpreting the seismic data was to divide the seismic section into seismic sequences. Seismic sequences are zones in which reflections are consonant. The zones are interpreted to be depositional sequences composed of generally conformable, genetically related strata. Each seismic sequence is bounded by a discontinuity associated with an unconformity (Mitchum, Vail, and Sangree, 1977, part 6). Figs. 8 and 9 show the seismic sequences which have been identified for lines 1 and 2, respectively. Each has been separated into 10 seismic sequences.
Figure 8--Seismic interpretation of line 1.
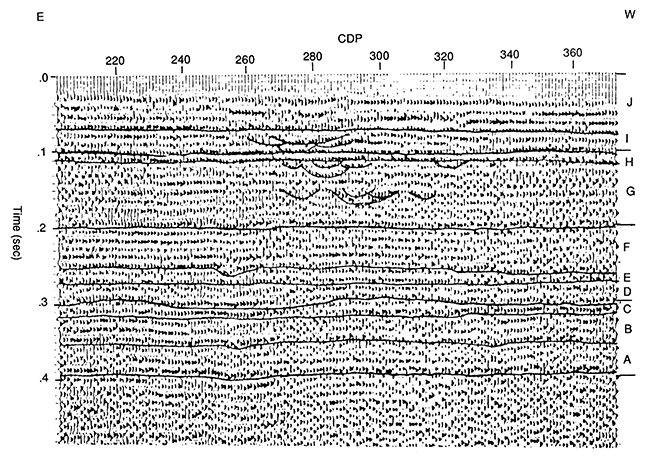
Figure 9--Seismic interpretation of line 2.
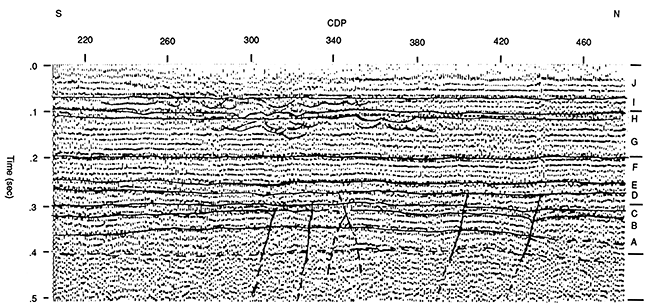
Sequence A represents rocks of the Upper Cambrian from the Precambrian basement to the top of the Eminence Dolomite, including the Lamotte Sandstone and the Bonneterre Dolomite. On line 1 the basement reflection occurs between 395 and 400 msec (approximately 2,300 ft [700 m]). There is a discontinuity at the upper boundary of the sequence. The associated unconformity is apparent between CDP 263 and 316 on line 1 where an additional reflection event is present. This reflection is truncated at either end by the unconformity. Assuming a velocity of 22,000 ft/sec (6,700 m/sec) determined from the ABC velocity log, the vertical relief on top of the Eminence Dolomite due to this positive topographic feature is 90 ft (27 m). The seismic record of the strata within this sequence is somewhat ambiguous. The lower boundary for line 2 has been inferred from line 1. Events below the Precambrian surface are multiples (see fig. 7c).
Sequence B represents rocks of the Van Buren Formation and the Gasconade Dolomite. At its base, the sequence exhibits a thinning over the Eminence topographic high on line 1. There is an apparent thickening of the Gasconade between CDP 218 and 230 on line 2. This thickening may be caused by a slight structural folding prior to the post-Gasconade peneplanation. Elsewhere on both seismic lines, reflection events of this sequence exhibit a distinct parallelism, as does sequence A. This is to be expected, considering the shallow-marine environment in which these strata were deposited.
Sequence C represents rocks of the Roubidoux Formation. According to Keroher and Kirby (1948), the Roubidoux unconformably overlies older strata. The unconformity at the top of the sequence is apparent between CDP 250 and 270 on line 2. In this region, there is a pinchout of the reflection event that is present at 304 msec on CDP 204. On line 1 this reflection event also is present between CDP 215 and 230 and between CDP 277 and 323, but has been removed elsewhere by erosion. The apparent relief on top of the Roubidoux determined from the seismic data on line 1 is approximately 75 ft (23 m), assuming a velocity of 15,400 ft/sec (4,700 m/sec) from the ABC well.
Sequence D represents the Jefferson City and Cotter dolomites. The basal Jefferson City reflector exhibits a thinning on line lover the topographic highs of the pre-Jefferson City erosional surface and a thickening over the topographic lows. The upper seismic discontinuity is evident on line 1 between CDP 235 and 260. Between these locations there is an additional reflection event which has been truncated by the pre-St. Peter peneplanation.
Sequence E is the thin St. Peter Sandstone and Hunton group, and sequence F is the Chattanooga Shale. The St. Peter is not visible on the seismic sections because of its thinness over the study area (less than 15 ft [5 m]). Therefore, the seismic discontinuity at the base of this sequence is a composite reflection resulting from the unconformity at the base of the St. Peter and the Hunton group. The Chattanooga Shale has been included in this sequence. At the top of sequence E on line 1 between CDP 250 and 265 is evidence of a channel in the Chattanooga Shale caused by pre-Mississippian erosion.
Sequence F represents Mississippian limestones. On line 1 is a thickening of Mississippian strata over the stream cut in the Chattanooga Shale. The reflection events within this sequence exhibit parallelism.
Seismic sequence G represents rocks of the Cherokee Group which were deposited during the Desmoinesian stage. Reflection events exhibit high but variable amplitude, high continuity, and parallelism. According to Sangree and Widmier (1977), the environmental-facies interpretation is that of fluvial clastics interbedded with widespread marsh deposits. The variable nature of the reflections in this sequence and sequences H, I, and J can be partially attributed to the cyclic nature of the strata. As previously stated, these rocks tend to have rapid and repeated changes in seismic velocity. Consequently, the reflections on the seismic record are actually composites of several superimposed reflections. The amplitude of a particular composite reflection is susceptible to changes in either the thickness or the lithology of any stratigraphic unit which contributes to the composite reflection.
In the middle and lower zones of seismic sequence G, seismic reflections indicate the presence of paleostream channels. These channels are located on line 2 at CDP 281, 315, and 322 at 160, 150, and 170 msec, respectively. The channels may be associated with a fall in sea level during a regressive cycle.
The squirrel sands are located at the top of sequence G below the Fort Scott Limestone. The Fort Scott produces the basal reflection of seismic sequence H. Over most of the area the gamma-ray well logs indicate that the squirrel sands are point bars deposited in a deltaic environment. The identification of squirrel sands deposited as point bars is difficult due to the long, apparently "ringy" seismic wavelets, the transitional lithology at the base of the sands, the effects of scaling during processing, and the limitations of available modeling programs. However, several channels appear to be located at the base of the Fort Scott. On line 1, these channels are located between CDP 270 and 293. On line 2 a channel appears to be located between CDP 290 and 300. In each case there seems to be a dimming of the Fort Scott reflector. This may be caused by the change in seismic velocity between channel squirrel sandstones and the nonchannel sandstones. The higher velocity of the channel sand may result in a lower reflection amplitude of the Fort Scott Limestone over a squirrel channel sand. Assuming a seismic velocity of 10,000 ft/sec (3,050 m/sec) of the sand, the channels are approximately 50 ft (15 m) thick. Several wells have recently been drilled along line 1, and the gamma-ray well logs indicate the presence of a well-developed squirrel channel sand that is over 40 ft (12 m) thick. It may be that this channel intersects line 1 where there are apparent channels beneath the Fort Scott.
Sequence H represents the Marmaton Group. An increase in the presence of limestone occurs in the strata younger than the Cherokee Group. Consequently, the amplitude of the composite reflection is highly responsive to the relationship between the lithology and thickness of a member limestone and that of a neighboring shale or sandstone. In some instances, it is possible to "tune out" a reflection caused by waveform superposition. An example is the reflection event on line 1 at CDP 203 at 88 msec. This reflection has variable amplitude across the line and appears to tune out to the west.
Sequence I represents rocks of the Pleasanton Group. This sequence is characterized by reflections indicating the presence of numerous channels. Most of these channels are located between CDP 255 and 300 on line 1 and between CDP 270 and 360 on line 2.
Sequence J represents rocks of the Kansas City Group. Reflections within this sequence exhibit a lack of continuity, probably caused by the muting of raw field data or by lack of data at short source-geophone offsets.
The squirrel sands are located in the Pennsylvanian system. This section of the stratigraphic column is seismically very complex, which is caused by the rapid and cyclic variations in seismic velocity. It appears that it is possible to locate squirrel sands that have been deposited within channels using MiniSOSIE. The presence of these channels apparently results in a dimming of the Fort Scott composite reflection due to interference. In addition to the squirrel sands, additional channels appear to be within the Pleasanton and Cherokee groups of the Pennsylvanian. These channels generally are located within two zones, one on each seismic line, and may be controlled by faulting.
Structurally, line 2 seismic data indicate that an apparent anticline is located in the pre-St. Peter strata. The top of this anticline has been beveled. The seismic data from line 2 indicate the presence of several faults on line 2, which may be associated with folding. At least one of the faults may extend into Pennsylvanian strata.
The data gathered for this study comprised one of the first high-resolution data sets gathered by the Kansas Geological Survey. This and a subsequent study indicate that the 11O-Hz low-cut pre-emphasis filter was an unfortunate choice. Subsequent high-resolution studies have been recorded with a 55-Hz low-cut filter, ensuring data recorded over at least two octaves. As a consequence, the ringing of the seismic wavelet is subdued, while severely attenuating the reflection amplitude of the first breaks and groundroll. Increasing the dynamic range of the recording system by using "quieter" field amplifiers would allow the recording of low frequencies while not overdriving the system. In addition, increasing the number of vertical impacts to 2,000 may further enhance the data.
To improve the stacked data, it may be feasible to use near-trace stacks when searching for shallow targets such as the squirrel sands. Transformation of the stacked data to zero-phase would simplify interpretational problems associated with the long source wavelets. In addition, this would facilitate the use of thin-bed analysis.
Finally, the dominant frequency of the MiniSOSIE data was 90 Hz at shallow depths. Deeper in the seismic record the dominant frequency decreased to approximately 75Hz. This is caused by the attenuation of higher frequencies by the earth as a result of absorption and the interference effects of multiples (Sheriff, 1975). The development of high-frequency, high-energy sources will improve the resolution of the seismic tool. This will enhance the ability to seismically resolve the presence of squirrel sands.
This project was part of the Kansas high-resolution reflection-seismology project which was sponsored by Chevron USA, Inc.; Conoco, Inc.; Getty Oil Company; Hanna Petroleum Company; and Sun Exploration and Production Company.
Barbier, M. G., and Viallix, J. R., 1974, Pulse coding in seismic prospecting sosie and seiscode: Geophysical Prospecting, v. 22, p. 153-175.
Bickford, M. E., Harrower, K. L., Nusbaum, R. L., Thomas, J. J., and Nelson, G. E., 1979, Preliminary map of the Precambrian basement rocks of Kansas: Kansas Geological Survey, Map M-9, scale 1:500,000.
Doveton, J. H., and Cable, H. W., 1980, KOALA (Kansas on-line automated log-analysis system) abecedarium and flight manual: Kansas Geological Survey, Petrophysical Series 2, 190 p.
Ebanks, W. J., 1979, Heavy oil-bearing sandstones of the Cherokee Group in southeastern Kansas; in, Field Guide in Pennsylvanian Cyclic Deposits: Kansas Geological Survey, Guidebook Series 4, 79 p. [available online]
Ebanks, W. J., and James, G. W., 1974, Heavy crude-oil-bearing sandstones of the Cherokee Group (Desmoinesian) in southeastern Kansas; in, Oil Sands, Fuel of the Future, L. V. Hills, ed.: Canadian Society of Petroleum Geologists, Memoir 3, p. 19-34.
Heckel, P. H., Brady, L. L., and Pabian, R. K., 1979, Field guide to Pennsylvanian cyclic deposits: Kansas Geological Survey, Guidebook Series 4, 79 p. [available online]
Keroher, R. P., and Kirby, J. J., 1948, Upper Cambrian and Lower Ordovician rocks in Kansas: Kansas Geological Survey, Bulletin 72, 140 p. [available online]
Kim, D. Y., 1964, Synthetic velocity log: Paper presented at 32nd Annual Meeting of the Society of Exploration Geophysicists, New Orleans.
Lee, W. M., 1943, The stratigraphy and structural development of the Forest City basin in Kansas: Kansas Geological Survey, Bulletin 51, 142 p. [available online]
Merriam, D. F., 1963, The geologic history of Kansas: Kansas Geological Survey, Bulletin 162, 317 p. [available online]
Mitchum, R. M., Vail, P. R., Sangree, J. B., 1977, Stratigraphic interpretation of seismic reflection patterns in depositional sequences; in, Seismic Stratigraphy--Applications to Hydrocarbon Exploration, C. E. Payton, ed.: American Association of Petroleum Geologists, Memoir 26, 516 p.
Mitchum, R. M., Vail, P. R., Thompson, S., 1977, The depositional sequence as a basic unit for stratigraphic analysis; in, Seismic Stratigraphy--Applications to Hydrocarbon Exploration, C. E. Payton, ed.: American Association of Petroleum Geologists, Memoir 26, 516 p.
Moore, R. C., 1957, Mississippian carbonate deposits of the Ozark region: Society of Economic Paleontologists and Mineralogists, Special Publication 5, p. 101-124.
O'Doherty, R. F., and Anstey, N. A., 1971, Reflections on amplitudes: Geophysical Prospecting, v. 29, p. 430-458.
Rascoe, B., Jr., and Adler, F. J., 1983, Permo-carboniferous hydrocarbon accumulations, midcontinent, U.S.A.: American Association of Petroleum Geologists, Bulletin, v , 67, no. 6, p. 979-1,001.
Rudman, A. J., Whaley,J. F., Blakely, R. F., and Biggs, M. E., 1975, Transformation of resistivity to pseudo-velocity logs: American Association of Petroleum Geologists, Bulletin. v . 59, no. 7, p. 1,151-1,165.
Sangree, J. B., and Widmier, J. M., 1977, Seismic facies interpretation of clastic depositional facies; in, Seismic Stratigraphy--Applications to Hydrocarbon Exploration, C. E. Payton, ed.: American Association of Petroleum Geologists, Memoir 26, 516 p.
Shoenberger, M., and Levin, F. K., 1974, Apparent attenuation due to intrabed multiples: Geophysics, v. 39, p. 278-291.
Shoenberger, M., and Levin, F. K., 1978, Apparent attenuation due to intrabed multiples, II: Geophysics, v. 43, p. 730-737.
Sheriff, R. E., 1975, Factors affecting seismic amplitudes: Geophys. Pros., v . 23, p. 125-138.
Telford, W. M., Geldart, L. P., Sheriff, R. E., and Keys, D. A., 1976, Applied geophysics: Cambridge University Press, 860 p.
Treitel, S., and Robinson, E. A., 1966, Seismic-wave propagation in layered media in terms of communication theory: Geophysics, v. 31, p. 17.
Watney, W. L., 1980, Cyclic sedimentation of the Lansing-Kansas City groups in northwestern Kansas and southwestern Nebraska: Kansas Geological Survey, Bulletin 220, 72 p. [available online]
Wuenschel, P. C., 1960, Seismogram synthesis including multiples and transmission coefficients: Geophysics, v. 25, no. 1.
Zeller, D. E., 1968, The stratigraphic succession in Kansas: Kansas Geological Survey, Bulletin 189, 81 p. [available online]
Kansas Geological Survey
Comments to webadmin@kgs.ku.edu
Web version Oct. 8, 2013. Original publication date 1989.
URL=http://www.kgs.ku.edu/Publications/Bulletins/226/Ready/index.html