Prev Page--Electron Spin Resonance Studies || Next Page--Petrology
Statistical Analysis of Geochemical and Mineralogical Data
Introduction
Statistical analysis of mineralogical data from the Upper Pennsylvanian and Lower Permian shales has revealed mineralogical associations that, mapped against depth, indicate a number of stratigraphic zones. Similarly, analysis of geochemical results from the same shales has produced a number of geochemical associations that also indicate stratigraphic zones. However, these mineralogical and geochemical zones do not coincide throughout the stratigraphic column. It is therefore to clarify the stratigraphic divisions and also the relationships between geochemical and mineralogical variables that a statistical analysis o the combined mineralogical and geochemical data was performed. A useful byproduct of the analysis will be an increased understanding of the relationship between mineralogical and geochemical cycles noted in Upper Pennsylvanian and Lower Permian shales.
The statistical procedures adopted were those applied in previous sections-cluster analysis, principal components analysis, and multiple discriminant analysis.
Correlations
The initial step in the multivariate analysis procedure is the calculation of a correlation matrix between all geochemical and mineralogical variables. The correlations between individual geochemical variables can be found in Table 10 and for mineralogical variables in Table 5. The correlations between mineralogical and geochemical variables are given in Table 15 and a number of inferred relationships are confirmed.
Table 15--Correlations between geochemical and mineralogical variables. r95 = ±0.15; r99 = ±0.20; r99.5 = ±0.27; *Fe% = Total Fe oxides percent; *HL% = Percentage weight loss on ignition, or heat loss.
| Quartz Peak Area |
Calcite Peak Area |
Feldspar Peak Area |
Dolomite Peak Area |
Kaolinite Peak Height |
Illite Peak Height |
Chlorite Peak Height |
|
|---|---|---|---|---|---|---|---|
| Al2O3% | 0.30 | -0.65 | 0.29 | -0.36 | 0.48 | 0.70 | 0.67 |
| CaO% | -0.67 | 0.85 | -0.35 | 0.27 | -0.44 | -0.67 | -0.60 |
| *Fe% | -0.02 | -0.42 | 0.10 | -0.03 | 0.33 | 0.39 | 0.27 |
| K2O% | -0.18 | -0.31 | 0.04 | -0.24 | 0.29 | 0.48 | 0.45 |
| MgO% | -0.38 | 0.06 | 0.26 | 0.59 | -0.27 | -0.34 | -0.29 |
| SiO2% | 0.85 | -0.73 | 0.30 | -0.31 | 0.31 | 0.48 | 0.43 |
| Mn/Fe | -0.38 | 0.53 | -0.19 | 0.31 | -0.32 | -0.42 | -0.46 |
| MnO ppm | -0.32 | 0.31 | -0.10 | 0.31 | -0.22 | -0.27 | -0.32 |
| Ag ppm | 0.16 | 0.00 | -0.05 | -0.03 | -0.16 | -0.21 | -0.21 |
| Ba ppm | 0.20 | -0.36 | 0.13 | -0.17 | 0.19 | 0.34 | 0.35 |
| Be ppm | -0.23 | 0.03 | 0.02 | 0.01 | 0.05 | 0.03 | 0.08 |
| Bi ppm | -0.54 | 0.57 | -0.30 | 0.13 | -0.23 | -0.38 | -0.42 |
| Cd ppm | 0.21 | -0.21 | 0.06 | -0.12 | 0.02 | 0.06 | -0.01 |
| Co ppm | 0.29 | 0.06 | 0.01 | -0.04 | -0.03 | -0.07 | -0.26 |
| Cr ppm | 0.04 | -0.16 | 0.01 | -0.08 | -0.04 | 0.02 | 0.04 |
| Cu ppm | 0.01 | -0.23 | 0.03 | -0.14 | 0.08 | 0.14 | 0.16 |
| Ga ppm | 0.13 | -0.56 | 0.18 | -0.35 | 0.51 | 0.71 | 0.69 |
| Ge ppm | -0.51 | 0.63 | -0.30 | 0.08 | -0.22 | -0.37 | -0.42 |
| Li ppm | -0.36 | 0.12 | -0.19 | -0.07 | 0.22 | 0.23 | 0.27 |
| Mo ppm | -0.13 | 0.16 | -0.13 | 0.01 | -0.13 | -0.19 | -0.24 |
| Ni ppm | -0.05 | -0.15 | 0.03 | -0.09 | -0.00 | 0.08 | 0.05 |
| Pb ppm | -0.01 | -0.17 | 0.03 | -0.04 | -0.02 | 0.05 | 0.01 |
| Sn ppm | -0.13 | 0.28 | -0.22 | 0.35 | -0.24 | -0.31 | -0.33 |
| Sr ppm | -0.43 | 0.54 | -0.28 | 0.20 | -0.31 | -0.41 | -0.43 |
| V ppm | 0.07 | -0.16 | 0.01 | -0.07 | -0.01 | 0.02 | 0.00 |
| Zn ppm | 0.17 | -0.44 | 0.14 | -0.21 | 0.21 | 0.34 | 0.28 |
| Zr ppm | 0.65 | -0.24 | 0.27 | -0.14 | 0.09 | 0.16 | -0.07 |
| *HL% | -0.26 | 0.12 | -0.24 | 0.06 | -0.19 | -0.23 | -0.13 |
Al2O3 shows high correlations with quartz, feldspar, and the clay minerals, reflecting concentrations of Al2O3 in feldspar and the clay minerals. Similarly, SiO2 has high correlations with the silicate minerals. CaO, on the other hand, has high correlations with the carbonate minerals, calcite, and dolomite. MgO is correlated with dolomite and feldspar as both minerals contain Mg. K2O and Fe oxides are correlated with the clay minerals and are most likely found in the lattices either as primary constituents or as substituting ions.
MnO and Mn/Fe are correlated with calcite and dolomite, reflecting the association of Mn with carbonates. Ba on the other hand is correlated with illite and chlorite, an indication of possible substitution in the two minerals. Bi is positively associated with the carbonate minerals as are Ge, Sn, and Sr. Co and Zr form an association with quartz and feldspar as both are often deposited as detrital elements. Gallium has a high correlation with each of the clay minerals. The remaining elements, Ag, Be, Cd, Cr, Cu, Li, Mo, Ni, Pb, V, and Zn, have no significant correlations.
Principal Components Analysis
Using the correlation table described above, an R-mode principal components analysis produced nine significant components which together account for 79.9 percent of the total variance in the data set (Table 16). Loadings of the variables on the components are shown in Figure 45 and a familiar pattern emerges.
Table 16--Eigenvalues of the components extracted. (i.e., eigenvalues > 1.0).
| Component | Eigenvalue | Cumulative Variance (%) |
|---|---|---|
| 1 | 9.91 | 28.3 |
| 2 | 6.09 | 45.7 |
| 3 | 3.67 | 56.2 |
| 4 | 2.03 | 62.0 |
| 5 | 1.72 | 66.9 |
| 6 | 1.26 | 70.5 |
| 7 | 1.14 | 73.8 |
| 8 | 1.12 | 77.0 |
| 9 | 1.02 | 79.9 |
Figure 45--Loadings of variables on significant components. Only loadings > ±0.30 are included.
| Key | ||
|---|---|---|
| For all components: Same as previous figures except K = K20; Ka = Kaolinite; WL = Weight Loss |
Component 1: 1 = Ga and Si 2 = Ka 3 = Ba 4 = Cr 5 = Ni 6 = F 7 = V 8 = Cd and Pb |
Component 2: 1 = Cu, Mo, and Pb 2 = Ni and V |
| Component 3: 1 = Ge and Bi |
||
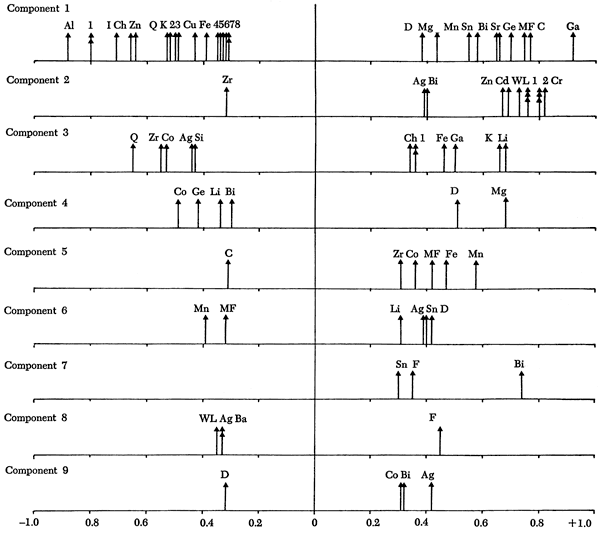
Component 1--The high loadings of CaO, calcite, Ge, Sr, Bi, Sn, MnO, Mn/Fe, and dolomite suggest that this component should be designated a carbonate component. The positive loadings of these elements, oxides, and minerals are opposed by high negative loadings of Al2O3, Ga, SiO2, illite, chlorite, Zn, quartz, and K2O, clearly indicating a detrital phase antipathetically related to a carbonate fraction.
This component shows a close correspondence to the first geochemical component (previous section) and it will be apparent when the other components are discussed that the geochemical variables control most of the components.
Following the procedures established previously, a promax rotation of the principal components was performed. However, the algorithm employed in this program recreates the component axes and in doing so only eight components were developed. Components 1 to 6 matched the R-mode principal components of Figure 45 but the other two differed slightly. Consequently, only the first six promax rotated axes are illustrated in Figure 46.
Figure 46--Loadings on promax axes. Only those loadings > ±.05 are indicated.
| Key | ||
|---|---|---|
| For all components: The same as previous figures except K = K2O; Ka = Kaolinite; WL = Weight Loss |
For component 2: 1 = WL 2 = Mo 3 = Be 4 = Co, Cu, and Pb 5 V 6 Cr 7 Ni |
For component 3: 1 = Mg 2 = MF |
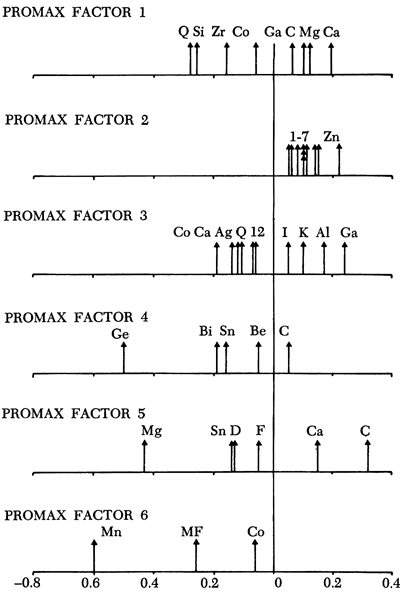
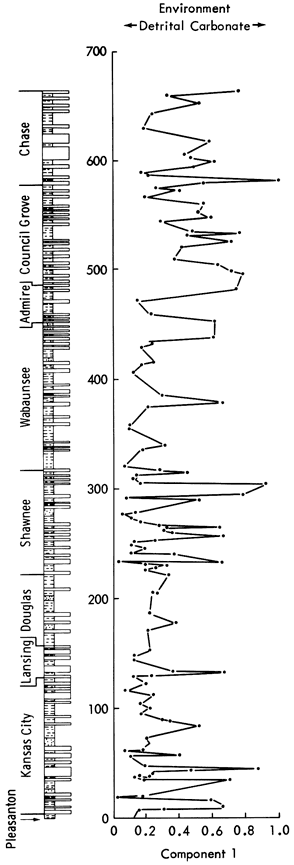
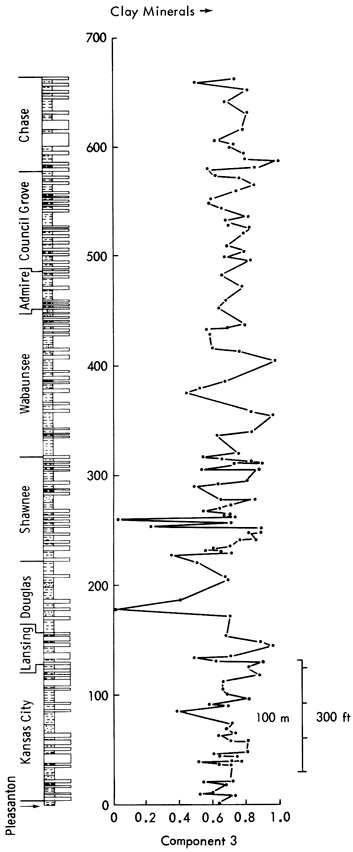
The carbonate/ detrital fraction antipathy is also noted in the promax rotation. Stratigraphic variation in component scores (Figure 47) indicates that the Pleasanton, Lower Kansas City, Lansing, Shawnee, Chase, Council Grove, and Admire Groups have a predominance of calcareous shales, whereas the intervening beds are generally detrital in nature.
Figure 47--Stratigraphic variation of component scores for components 1, 2, and 3.
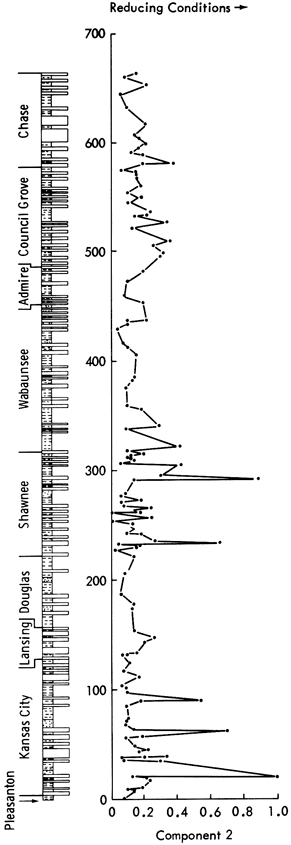
Component 2--This component has high positive loadings for Cr, Cu, Mo, Pb, Ni, V, Cd, Zn, Be, and weight loss representing an enrichment of trace elements in the reducing conditions of organic-rich black shales. Component scores are high in the Kansas City Group and Shawnee Group black shales (Figure 47) and low for all other deposits.
Component 3--This component has positive Li, K2O, Ga, and Fe oxides loadings opposed by quartz, Zr, Co, Ag, and SiO2. K2O in the form of K+ and Ga is normally found as ions within clay mineral lattices. Similarly, Fe oxides and Li are characteristic of clay minerals. The negative loadings of detrital components add support to the notion that this axis is essentially a clay mineral component. On rotation, the clay minerals are positively loaded with Al2O3 and Ga, whereas negative loadings are recorded for Co, CaO, Ag, and quartz. Component scores shown in Figure 47 indicate high positive scores on shales with high clay mineral content (Figure 12) and negative scores on shales with a high detrital quartz fraction (Figure 10). Therefore, there appears to be an antipathic relationship between clay mineral and quartz content in many shales. The negative loadings of CaO on rotation also indicate that a carbonate-clay mineral relationship replaces the quartz-clay mineral antipathy in some shales. This is most noticeable in the Permian shales where scores do not increase when the quartz fraction of shales decreases. Low scores are recorded in the Douglas Group (Tonganoxie Sandstone) and the Shawnee Group (Stull and Doniphan Shales), whereas high scores are noted in the Lansing (Vilas Shale), Shawnee (Calhoun Shale), Wabaunsee (White Cloud Shale), and Chase Groups (Havensville Shale).
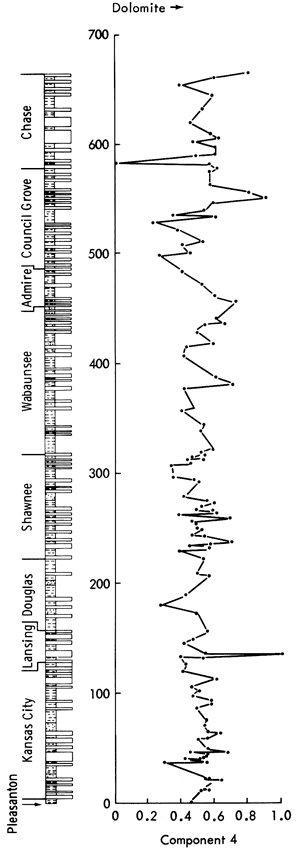
Component 4--High positive loadings for MgO and dolomite are opposed by negative loadings for Co, Ge, Li, and Bi. On rotation, calcite becomes positively loaded and Sn and Be become negatively loaded. This indicates that the component controls the occurrence of dolomite in the samples. Component scores (Figure 48) show high values for dolomite-rich shales (Figure 11), i.e., Heebner Shale (Shawnee Group), Havensville Shale, Stearns Shale, Paddock Shale (Chase Group), and shale partings in the Winterset Limestone (Kansas City Group), Plattsburg Limestone (Lansing Group), Spring Branch Limestone (Shawnee Group), and Grandhaven Limestone (Wabaunsee Group). Low scores are recorded for the Tonganoxie Sandstone (Douglas Group), Speiser Shale, Salem Point Shale, and Hughes Creek Shale (Council Grove Group) samples with low MgO and dolomite values.
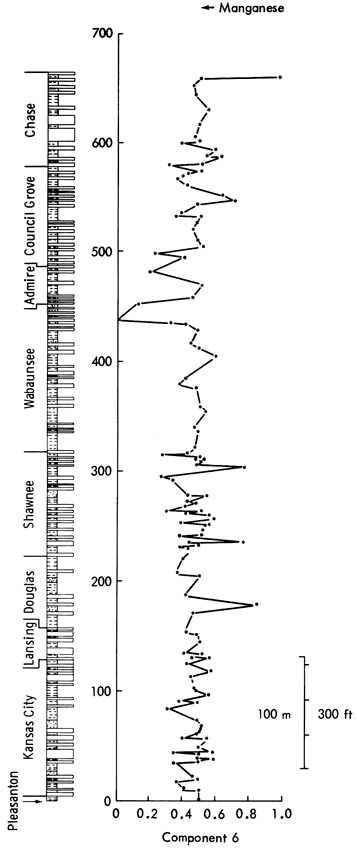
Figure 48--Stratigraphic variation of component scores for components 4, 5, and 6.
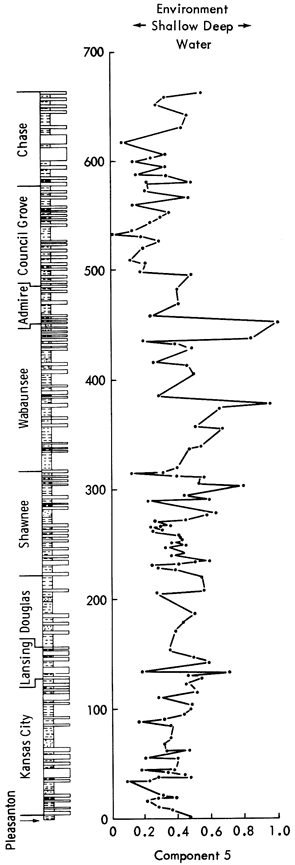
Component 5--This component has high positive loadings for MnO, Fe oxides, Mn/Fe ratio, Co, and Zr, indicating an association with carbonates. However, the negative loadings of calcite indicate that this component may reflect chemical rather than mineralogical control.
MnO and Fe oxides are often concentrated in deep-sea sediments where reducing conditions enable manganese nodules to develop. In normal marine waters, Mn is predominantly found substituting for Ca in the lattices of carbonates. However, Mn is not found extensively in shallow aragonite-rich sediments such as the carbonates of the Persian Gulf. As Kansas sediments during the Upper Pennsylvanian and Lower Permian were deposited in a shallow epeiric sea, it would be expected that aragonite would e deposited at the edge of the sea and calcite away from the shore. The reducing conditions commonly found in epeiric seas would aid the enrichment of Mn in the deeper sediments. Subsequent diagenetic alteration of aragonite to calcite may account for the differing amounts of MnO found in carbonates of the Upper Pennsylvanian and Lower Permian shales. The negative loadings of calcite can also be interpreted as a reflection of the aragonite to calcite diagenetic alteration.
Rotation of the component reveals a positive loading for calcite and CaO, indicating that the component was not truly bipolar. Negative loadings for MgO, Sn, dolomite, and feldspar clarify the interpretation of the component loadings. It can therefore be assumed that the component reflects relatively deep-water versus shallow-water depositional environments and also an antipathic relationship between dolomite and calcite. It may similarly reflect nearness to shoreline, as deep-water sediments are normally found furthest from the coast.
Component scores suggest that long periods of shallow-water sedimentation alternate with deeper-water sedimentation. Superimposed upon this oscillation are short time-scale fluctuations. The component scores generally increase from the Pleasanton to a peak in the Lansing Group, decrease through the Douglas to the center of the Shawnee, rise again to the middle of the Wabaunsee, decrease through the Council Grove Group, and finally begin to rise again through the Chase Group. Therefore, there are apparently three long-term oscillations in the depth of deposition for the Upper Pennsylvanian and Lower Permian shales. The highest scores were recorded in the Plattsburg Limestone, Calhoun Shale, Friedrich Shale, Silver Lake Shale, and Pony Creek Shale whereas the Galesburg Shale, Neva Limestone, and Oketo Shale have the lowest scores.
Component 6--High positive loadings of dolomite, Sn, Ag, and Li are opposed by negative loadings for MnO and Mn/Fe ratio. On rotation, the high positive loadings disappear but the MnO and Mn/Fe negative loadings are accentuated. Additionally, Co develops a high negative loading. The component can, therefore, be interpreted as a manganese component.
Components 7, 8, and 9--Component 7 is controlled by the unusual combination of Bi, feldspar, and Sn for which no explanation can be offered. Similarly, components 8 and 9 are uninterpretable. Examining Table 16, it is apparent that these components only account for 10 percent of the total data variance and are therefore relatively unimportant in controlling the mineralogical and geochemical evolution of Kansas shales. They probably account for occasional extreme conditions--both experimental and original environmental conditions.
Mineralogical and geochemical variation in Upper Pennsylvanian and Lower Permian shales can therefore be described by nine components of which only six are interpretable. Scores of individual samples on the components subdivide the stratigraphic section into a number of zones. However, these zones are not consistent across all components and may in some cases be contradictory.
Cluster Analysis and Discriminant Analysis
Another approach to the same problem employs Q-mode cluster analysis, a technique that examines relationships between samples rather than variables. Using the scores on the nine components calculated above, similarity coefficients between samples are determined. A hierarchical classification (dendrogram) is developed from the similarity matrix (Figure 49) and produces a 10-fold division of the samples. It can be seen that almost two-thirds of the shale samples fall into one group, and only one other group contains more than five samples. It is unlikely that the remaining samples form eight natural groups, and a number are probably products of the clustering method. Therefore, following the procedure established previously, the scores of the samples on the nine significant components were analyzed by multiple discriminant analysis to check the discreteness of the groups. Four discriminant axes were found to account for 86.9 percent of the data variation (Table 17) and the resulting distributions appear in Figures 50 and 51. It can be seen that these axes successfully distinguish Groups F, J, and I, but all other groups suffer some degree of overlap. It is therefore apparent that some of the clusters are not unique and require some modification.
Figure 49--Dendrogram of Upper Pennsylvanian and Lower Permian shales based on geochemical and mineralogical data. Clusters produced are indicated on the left of the diagram.
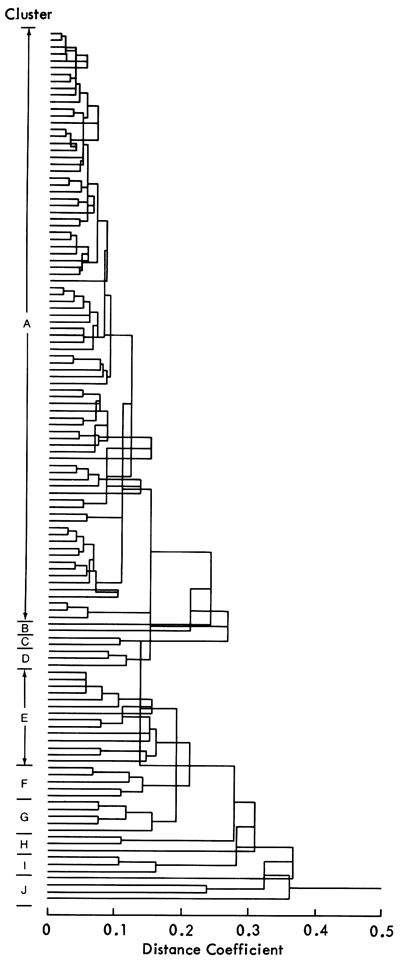
Figure 50--Plot of ten cluster groups on first two discriminant axes. The components controlling the distribution are superimposed to aid interpretation.
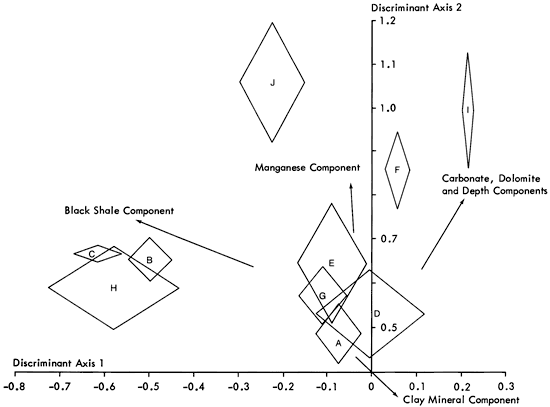
Figure 51--Plot of cluster groups on 3rd and 4th discriminant axes. Components affecting the distribution of groups are superimposed to aid interpretation.
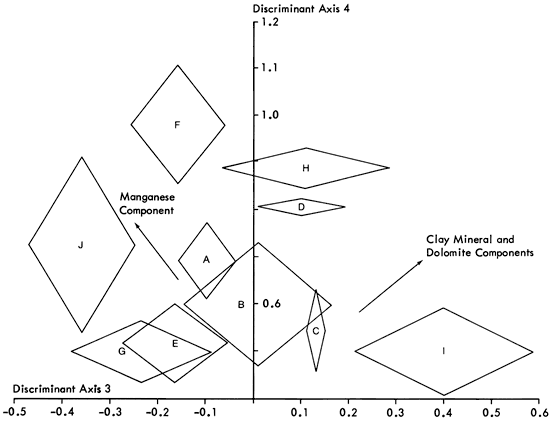
Table 17--Discriminant analysis results (only discriminant axes with eigenvalues > 1.0 are included)
| Discriminant No. |
Contribution of Each Variable to Discriminants |
Percent of Discriminant Power |
Eigenvalue | ||||||||
|---|---|---|---|---|---|---|---|---|---|---|---|
| 1 | 2 | 3 | 4 | 5 | 6 | 7 | 8 | 9 | |||
| 1 | 0.28 | -0.70 | 0.44 | 0.09 | 0.20 | -0.06 | -0.54 | -0.24 | -0.30 | 37.9 | 5.28 |
| 2 | 0.88 | 0.31 | -0.49 | 0.23 | 0.79 | 0.28 | 0.10 | -0.01 | 0.20 | 22.5 | 3.14 |
| 3 | -0.29 | 0.31 | 0.27 | 0.44 | 0.39 | -0.58 | -0.23 | -0.46 | -0.01 | 14.7 | 2.05 |
| 4 | -0.09 | 0.05 | 0.32 | 0.52 | -0.13 | 0.68 | 0.23 | -0.37 | 0.12 | 11.3 | 1.57 |
Along the first, second, and third axes, groups C, B, and H overlap and are only distinguishable by small differences in the manganese and dolomite content. Similarly, clusters A, G, and E are found to be inseparable on all but the fourth discriminant axis. Simplifying the sample classification, these groups can be merged together to form six distinct clusters.
In the case of group D, we can see that it overlaps clusters A, G, and E on the first and second discriminant axes, but that on the third and the fourth, it is distinct. Examining discriminant scores of individual samples, one of the samples in group D is found to have scores similar to group A samples. Simply reallocating this sample to group A distinguishes group D from A, G, and E by reducing the standard deviation of group D on the first two discriminant axes.
However, on examining the original data values, groups E, A, and G are found to be distinctly different. For example, group E samples have large calcite values, whereas those in group G have large quartz values. Within group A, some samples have a high calcite content but most have moderate calcite and quartz values. We can therefore split group A into two sections, corresponding to the emphasis (scores) on the detrital/carbonate component. Clusters H, B, and C samples show very similar data values, although the values for sample 186 are closer to cluster A samples than to other H, B, or C samples. Clusters F, I, and J values are also distinct. Consequently, there are now nine possible subdivisions of the Upper Pennsylvanian and Lower Permian shales based on mineralogical and geochemical differences:
1. Cluster A, consisting of up to one-third of the samples and dominated by shales containing primarily quartz, feldspar, and clay minerals.
2. A subdivision of cluster A (now referred to as cluster X) that consists of samples high in carbonate content.
3. Cluster B with six samples that have high scores on component two and are enriched in Be, Cd, Cr, Cu, Mo, Ni, Pb, V, and Zn trace elements. Lithologically these samples are black shales.
4. Cluster D, containing only two samples, closely associated with cluster A.
5. Cluster E consists of samples with very high concentrations of calcite.
6. Cluster F contains those shales with a high dolomite content.
7. Cluster G contains samples with high quartz content, mainly sandstones and siltstones.
8 & 9. Two clusters, I and J, with a total of seven extreme samples from all of the previous groups. The significance of these last groups is in doubt.
A stratigraphic plot of the distribution of samples from the nine groups is presented in Figure 52 and a pattern similar to both mineralogical and geochemical distributions is revealed (Table 18, Figures 21 and 36). A zonation of the stratigraphy is again in evidence and can be related to the factors controlling the mineralogy and geochemistry of the shales. The Pleasanton and Lower Kansas City Groups are characterized by a regular alternation of calcareous shales (cluster E samples), black shales (B), and shales containing primarily quartz, feldspar, and clay minerals (A). This three-component shale cycle is repeated four times at approximately 70-foot intervals from the Tacket Formation to the Iola Limestone. Between each shale cycle, a series of cluster A samples occurs. Occasionally, a carbonate shale also develops.
Figure 52--Stratigraphic variation of samples arranged in cluster order. Horizontal scale is arbitrary but may represent a detrital to carbonate sequence from G to F.
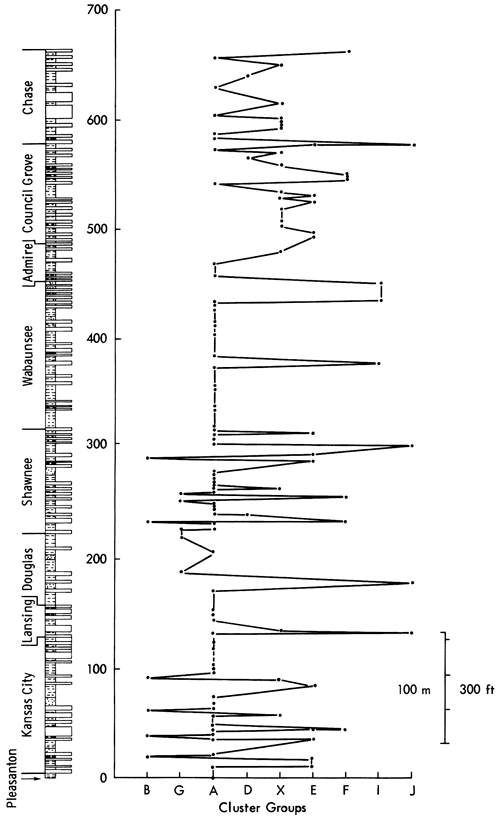
Table 18--Distribution of shale samples within the mineralogical, geochemical, and combined mineralogical and geochemical classifications. This indicates, for example, that, of the 69 samples that fell into cluster A of the classification determined in this chapter, 12 were clustered in group A of the mineralogical classification, 48 in group B, six in group D, and three in E. In the corresponding geochemical classification 68 fell into group A and one into D.
| Mineralogical Groups | |||||||
|---|---|---|---|---|---|---|---|
| A | B | C | D | E | G | H | |
| A | 12 | 48 | 6 | 3 | |||
| B | 3 | 3 | |||||
| D | 1 | 1 | |||||
| E | 2 | 11 | |||||
| F | 3 | 3 | |||||
| G | 1 | 3 | 1 | ||||
| I | 1 | 2 | |||||
| J | 2 | 2 | |||||
| X | 3 | 15 | |||||
| Geochemical Groups | |||||||
|---|---|---|---|---|---|---|---|
| A | D | F | H | I | |||
| A | 68 | 1 | |||||
| B | 6 | ||||||
| D | 2 | ||||||
| E | 6 | 2 | 3 | 2 | |||
| F | 2 | 3 | 1 | ||||
| G | 5 | ||||||
| I | 2 | ||||||
| J | 4 | ||||||
| X | 8 | 7 | 2 | 1 | |||
The succeeding Upper Kansas City, Lansing, and Douglas Groups contain samples predominantly from clusters A and G. The detrital fraction of beds in this zone is large and, noticeably in the Douglas Group, manifests itself in the development of a number of siltstones and sandstones. Shales in these beds are also very rich in quartz, feldspar, zircons, and detrital cobalt (as noted in the high negative scores on component one). One calcareous bed noted in the Hickory Creek Shale may represent a partially developed three-component shale cycle.
A zone defined by the boundaries of the Shawnee Group contains an irregular collection of samples. Two black shale samples are found in the Heebner and Larsh and Burroak Shales but do not form integral parts of cycles as in the Pleasanton and Lower Kansas City zone. In this section, no regular pattern appears, possibly because it contains samples from eight of the nine clusters. Nevertheless, some inferences can be made from the sample distribution. In the Shawnee, thick shale formations separate four limestone formations containing interleaved thin shales (a black shale after the second limestone bed (Moore, 1949) is the most distinctive). The majority of samples from the thick shales, known as outside shales, are classified in clusters A and G but a few occur in cluster J. The shales within the limestone formations, inside shales, vary in cluster allocation. The first shale is normally from cluster A, although one G sample was noted; the second is generally from cluster B, the black shale cluster; and the third, where developed, is usually from cluster A. However, calcareous shales replace the second and third shales on occasion. The Lower and Middle Wabaunsee Group consists almost entirely of cluster A samples and is quite similar to the Upper Kansas City, Lansing, and Douglas zone but without the thick sequences of siltstones and sandstones. Only one sample, from the Silver Lake Shale, is calcareous.
Finally, a zone of alternating calcareous and detrital shales encompasses the Upper Wabaunsee, Admire, Council Grove, and Chase Groups. Generally, these samples are much richer in both calcite and dolomite than the Pennsylvanian, indicating a distinct change in the sedimentary environment. The Pennsylvanian/ Permian boundary is therefore thought to mark a change from the beds essentially dominated by the detrital fraction to those with a high carbonate content.
The subdivisions of the Pennsylvanian stratigraphy tentatively represent two periods of oscillating environments. The conditions prevalent in the Pleasanton and Kansas City zone seem to recur in the Shawnee; similarly, those developed in the Upper Kansas City, Lansing, and Douglas zone are repeated in the Wabaunsee. As these "periods" are roughly equivalent in thickness and possibly time, it is suggested that they represent a cycle of cycles.
Discussion
Mineralogical and geochemical data analyzed in previous sections have been combined and studied using multivariate statistical techniques. The variation found throughout the Upper Pennsylvanian and Lower Permian shales of Kansas can be explained in terms of nine components. First, accounting for 28 percent of the data variance, is a component that describes the differences between carbonate and detrital fractions of shale samples. Subsequent components describe variations in sediment reducing conditions, clay mineral content, dolomite content, depth of deposition, and manganese content. Three components remained uninterpreted.
Scores of samples on the first six components in particular indicate that the stratigraphic section can be divided into a number of zones characterized by differing geochemical and mineralogical conditions. A statistical analysis of the zonation (using Q-mode cluster analysis and multiple discriminant analysis) was performed on the component scores. Ten natural groups of samples were revealed that were subsequently pruned down to nine. The distribution of samples from these groups indicated a five-fold division of the stratigraphical section under examination:
- Pleasanton and Lower Kansas City Groups,
- Upper Kansas City, Lansing, and Douglas Groups,
- Shawnee Group,
- Lower and Middle Wabaunsee Group, and
- Upper Wabaunsee, Admire, Council Grove, and Chase Groups.
Zones 1 and 3 consist of regular alternations of calcareous, black organic, and quartz-rich shales. Occurring at approximately 70-foot intervals, these cycles bear a close resemblance to the oscillations identified in the Kansas City Group beds by Davis and Cocke (1972). Using a method known as substitutability analysis, the stratigraphic section containing 17 distinct lithologies was found to possess a two-state oscillation, limestone-inside shale, perturbated by occasional outside shales or black shales. Inside shales are comparable to the calcareous shales (clusters X and E) of this section. Similarly, quartz-rich shales, siltstones, and sandstones (clusters A and G) roughly correspond to outside shales. The black organic shales in both cases are directly equivalent. However, the quartz shales may also develop as inside shales and therefore the cycles defined in this chapter do not directly match the oscillatory patterns recognized by Davis and Cocke (1972), and Schwarzacher (1969). There also seem to be dissimilarities between the cycles recognized in this section and those identified by Moore (1936, 1949) and Merriam (1963). Nevertheless, simple three-component shale cycles have been recognized in both zones 1 and 3.
Zones 2 and 4 are characterized by quartz-rich shales, siltstones, and sandstones with occasional calcareous shale. No evidence for cyclic variation in the geochemistry or mineralogy of these beds is apparent. These zones do, however, oscillate with zones 1 and 3 and form the only manifestation of large-scale cycles found in Kansas deposits.
The last recognizable zone, 5, consists of a two-state oscillation from calcite or dolomite-rich shales to quartz-rich shales. This zone is dominated by calcareous beds and reflects a basic change in environmental conditions from a detrital-dominated shale regime in the Pennsylvanian to carbonate deposition in the Lower Permian.
Prev Page--Electron Spin Resonance Studies || Next Page--Petrology
Kansas Geological Survey, Geology
Placed on web May 6, 2009; originally published December 1979.
Comments to webadmin@kgs.ku.edu
The URL for this page is http://www.kgs.ku.edu/Publications/Bulletins/217/06_stats.html