KGS Open File Report 98-56--1998 Oil and Gas Production--Continued
Prev Page--Oil economic impact ||
Next Page--Gas economic impact
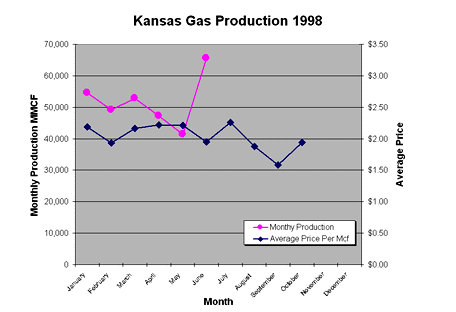
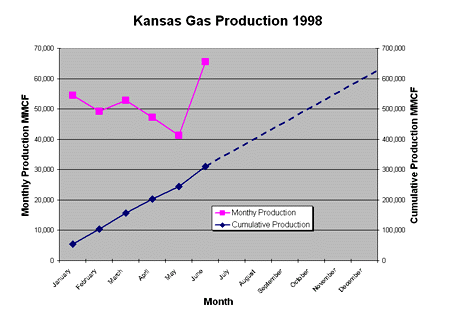
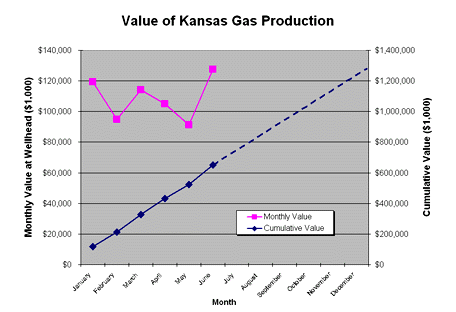
Gas production in Kansas is available in databases of the Kansas Geological Survey for the first six months of 1998. The production data is was generated by the Kansas Department of Revenue. Monthly production displays a fluctuating trend through the first six months of the year (Figure 4). The latest production figures (June) may be subject to revision. The average wellhead price shows a decline into the second half of 1998. Monthly production was used to generate a cumulative production curve for the first six months of 1998 (Figure 5). Extrapolation for the remainder of the year provides an estimated 1998 gas production of just over 630 billion cubic feet (Figure 5 and Table 1). If this estimate is correct, the annual production decline from 1997 to 1998 will be approximately 60 billion cubic feet (Table 1 and Figure 4). Monthly production and average wellhead price were used to generate a cumulative wellhead value for gas production for the first six months of 1998 (Figure 6). Extrapolation for the remainder of the year provides an estimated 1998 production value of approximately $1,271 million dollars (Figure 6 and Table 1). This estimated value for gas at the wellhead is a decrease of more than $200 million from the 1997 wellhead value.
| Figure 4 - Kansas monthly gas production, and average monthly wellhead price for 1998. A larger version of this figure is available. |

|
| Figure 5 - Kansas monthly and cumulative gas production for the first six months of 1998. Annual production for 1998 is estimated by extrapolation of the cumulative production curve. A larger version of this figure is available. |

|
| Figure 6 - Kansas monthly and cumulative value of gasproduction for the first six months of 1998. Value of annual production for 1998 is estimated by extrapolation of the cumulative value curve. The estimated value of $1,271 million is consistent with the estimated annual production volumes and average wellhead prices. A larger version of this figure is available. |

|
Prev Page--Oil economic impact || Next Page--Gas economic impact