Well Profile
(Marked Log)
Well Profile Module
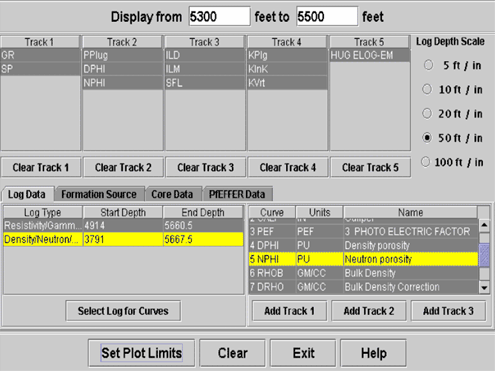
Dialog used in Well Profile that is used to select depth interval, depth scale, curve type and tracks, formation tops database, core data to display, and provide quick look log analysis (saturation parameters such as Sw using PfEFFER). User sets plot limits which include scales in tracks and color of curves.
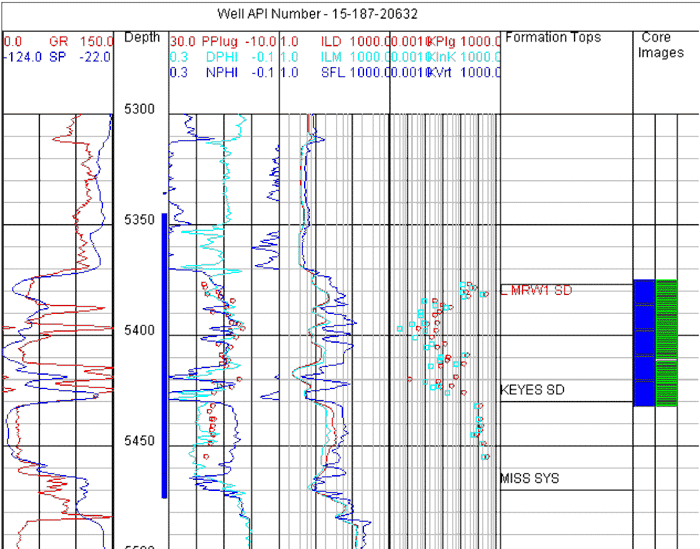
Screen capture of well profile that includes core analyses plotted as small circles, formation tops from database, and location of core images along right margin.
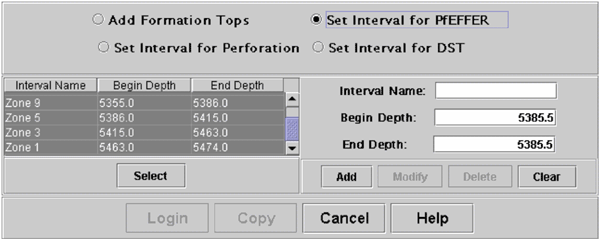
When mouse is clicked in an active log window in the Well Profile module, a pop-up window appears that is used to add formation tops, set intervals for PfEFFER (log analysis), and establish perforated and DST intervals.
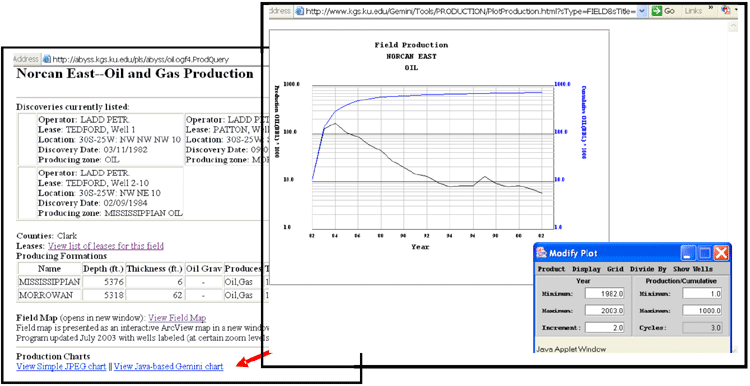
Production Modules
Production-Time and Bubble Maps
 |
|
|
|
http://www.kgs.ku.edu/PRS/publication/2004/AAPG/GEMINI/p2-04.html
Last Modified August 2004