![]()
![]()
![]()
Kansas Geological Survey, Open File Report 99-40
Part of the Direct Push Methods for Hydrostratigraphic Characterization Project
| J.J. Butler, Jr., J.M. Healey, and L. Zheng Kansas Geological Survey The University of Kansas Lawrence, KS 66047 |
W. McCall Geoprobe Systems 601 North Broadway Salina, KS 67401 |
M. K. Schulmeister Kansas Dept. of Health and Environment Bureau of Environmental Remediation, Bldg 740, Forbes Field, Topeka KS, 66620 |
KGS Open-File Report 99-40
Prepared for presentation at
The Geological Society of America
1999 Annual Meeting in Denver, Colorado
October 27, 1999
The incorporation of down-hole sensors into direct-push equipment provides a novel method for the rapid and detailed hydrostratigraphic characterization of unconsolidated deposits. The potential of this technology was assessed through two field investigations in unconsolidated alluvial deposits (60-70 ft thick) using downhole electrical conductivity and cone penetrometer sensors. At both sites, these sensors served as excellent tools for the lateral and vertical delineation of hydrostratigraphic units. Electrical conductivity surveys at a lateral spacing of less than 2 to more than 200 feet graphically demonstrated the spatial variability inherent in alluvial deposits. Core samples, hydraulic tests, water-level data, and well-bore geophysics corroborated the information provided by the direct-push sensors. The results of these investigations indicate that this technology can provide detailed information about the hydrostratigraphic framework of unconsolidated deposits in a rapid and cost efficient manner without generation of cuttings or the need for a pre-existing borehole or well.
In the last decade, direct-push (DP) technology has become a viable alternative to conventional drilling methods for sampling soils, sediments and ground water in unconsolidated formations. This technology has been particularly widely used for a range of activities in support of environmental site investigations. The DP technology utilized in this study employs high-frequency (~ 30 Hz) percussion hammers and hydraulic slide systems, mounted on conventional pick-up trucks, vans or specialized track machines, to rapidly advance pipes into the subsurface. Advantages of DP technology over conventional drilling methods include (Thornton et al., 1997):
In this presentation, we will demonstrate the level of hydrostratigraphic detail that can be obtained by coupling DP technology with a new generation of down-hole sensors.
Direct-push electrical conductivity logging (DP e-logging) is a modification of conventional borehole resistivity logging. A significant difference between the e-logging methods of borehole geophysics and DP e-logging is that no pre-existing borehole or well is required for the latter. The DP e-logging probe is simply attached to the leading end of the tool string and advanced into the subsurface using the percussion hammer and hydraulic slides on the DP vehicle. The DP e-logging probe used in this work is a Wenner array design that is 15 inches long with a maximum diameter of 1.5 inches. A current is applied to the outer two electrodes and the voltage is measured across the inner two electrodes (Christy et al., 1994). The measurement is transmitted via a pre-strung coaxial cable to signal processing hardware at the surface where a real-time log (reading every 0.05 ft) is displayed on a laptop computer. A string pot mounted on the mast of the DP unit tracks the depth and speed of advancement of the Wenner array probe. In this study, a two-person team routinely completed 70 foot DP e-logs in about one hour.
Figure 1--Schematic showing truck with direct-push tool attached and example log.
Figure 2--DP e-logging probe. Scale bar is 3 inches total.
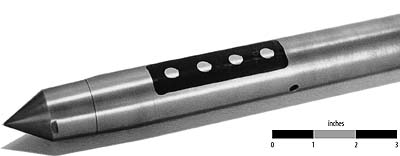
Figure 3--Example electrical-conductivity log and site stratigraphy.
Figure 4--Location map of two study areas.
GEMS is an experimental research area of the Kansas Geological Survey located in the floodplain of the Kansas River just north of Lawrence, Kansas. Established in the late 1980s, GEMS overlies approximately 70 feet of alluvial deposits of the Kansas River. These unconsolidated Holocene sediments overlie and are adjacent to materials of Pennsylvanian and Pleistocene age. The alluvial facies assemblage at GEMS is a complex system of stream-channel sand and overbank deposits that essentially consists of 35 feet of clay and silt (with minor amounts of silty sand) overlying 35 feet of coarse sand and gravel. The site map shows the locations of the two sampling transects (A-A' and B-B') that will be referred to in this poster.
Figure 5--Map of GEMS site showing location of cross sections.
Figure 6--E-Logs at GEMS--A to A' Cross Section. A larger version of this figure is available.
Figure 7--E-Logs at GEMS--B to B' Cross Section. A larger version of this figure is available.
Figure 8--GEMS site--Electrical-conductivity profile from A to A'. A larger version of this figure is available.
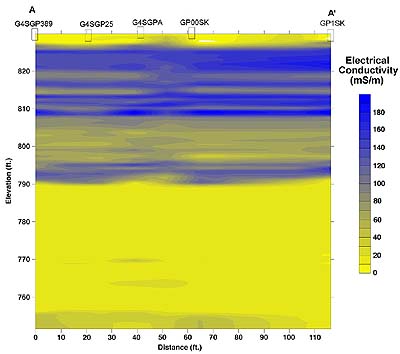
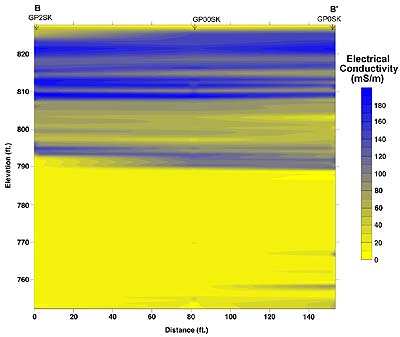
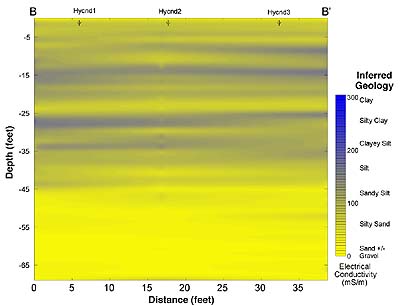
Figure 9--GEMS site--Electrical-conductivity profile from B to B'. A larger version of this figure is available.
This site is located in the city of Salina in central Kansas on alluvial deposits of the Smoky Hill River just a few miles upstream of its confluence with the Saline River. The Quaternary Age alluvial deposits at this site consist of granitic sands and gravels overlain by silts and clayey silts. These deposits rest unconformably on the Permian shale that forms a locally extensive aquitard. The site map shows the sampling locations and traverses (A-A', B-B') referred to in this poster.
Figure 10--Map of Salina site showing location of cross sections.
Figure 11--E-Logs from Salina site--A to A' Cross Section. A larger version of this figure is available.
Figure 12--E-Logs from Salina site--B to B' Cross Section. A larger version of this figure is available.
Figure 13--Salina site--Electrical-conductivity profile from A to A'. A larger version of this figure is available.
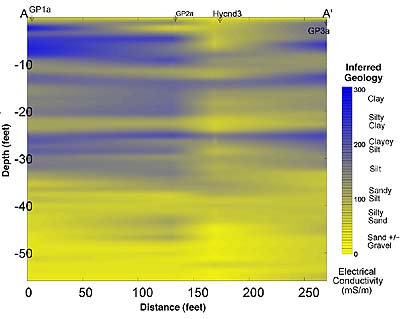
Figure 14--Salina site--Electrical-conductivity profile from B to B'. A larger version of this figure is available.
The DP e-log provides a record of electrical conductivity versus depth at a level of detail that is not commonly obtained in hydrogeologic investigations. In order to assess the value of this log for hydrostratigraphic studies, additional data were collected at both sites using other methods. A standard focussed induction borehole geophysical log was run in a monitoring well at GEMS less than four feet from the location of a DP e-log. The focussed induction tool provided a highly smoothed version of the DP e-log. At both sites, cores were collected adjacent to locations of DP e-logs. Core analysis found that many of the variations observed on the DP e-logs were produced by lithologic variations. Hydraulic conductivity estimates from slug tests at GEMS in the sand-gravel and silt-sand intervals, and from permeameter analyses of samples from the Salina site were in agreement with the relative differences in electrical conductivity shown on the DP e-logs. In addition, water-level data at GEMS indicated a hydraulic head difference of greater than three feet across the zone of high electrical conductivity separating the sand-gravel and silt-sand intervals, thereby confirming the existence of the tight clay layer expected from the e-log data. Finally, CPT logs adjacent to locations of DP e-logs displayed sand-gravel and clay-silt distributions similar to those inferred from the e-logs.
Figure 15--Focussed induction and direct-push EC comparison. Separation distance 3.7 ft.
Figure 16--E-Log and Lithologic Profile at GEMS. A larger version of this figure is available.
Figure 17--E-Log and Lithologic Profile at Salina Site. A larger version of this figure is available.
Figure 18--Salina Site Comparison--Sieve Results from Lower Zone. A larger version of this figure is available.
Figure 19--Salina Site Comparison--Sieve Results from Upper Zone. A larger version of this figure is available.
Figure 20--CPT and EC logs: GEMS comparison 1. A larger version of this figure is available.
Figure 21--CPT and EC logs: GEMS comparison 2. A larger version of this figure is available.
In this presentation, we demonstrated the effectiveness and efficiency of direct-push sensors for providing detailed information about the hydrostratigraphic framework in unconsolidated alluvial deposits to depths greater than 70 feet. The DP e-logging data was in agreement with information obtained from wellbore geophysics, core samples, hydraulic tests, and water-level data. The results of this work indicate that DP e-logging has considerable potential as a tool for the hydrostratigraphic characterization of unconsolidated deposits. The variations seen in the e-logging responses at the two sites described here appear to be primarily a function of lithology. For sites where the specific conductance of the groundwater varies significantly, auxiliary data are required to distinguish e-log responses produced by lithologic variations from those produced by variations in water chemistry (Mack, 1993).
This poster is a progress report on one component of an ongoing cooperative research project directed at the development and evaluation of direct-push techniques for the detailed hydraulic, geochemical, and stratigraphic characterization of unconsolidated deposits. Further reports will be presented at the Special Session on Direct Push Sensor Technology to be held at the Spring 2000 Meeting of the American Geophysical Union in Washington, DC (May 30-June 3, 2000).
Christy, Collin D., T.M. Christy, V. Wittig, 1994, A Percussion Probing Tool for the Direct Sensing of Soil Conductivity; in, Proceedings of the Eighth National Outdoor Action Conference and Exposition: National Ground Water Assoc.
Geoprobe Systems, 1998, Geoprobe SC400 Soil Conductivity Probe, Product Bulletin No. PBSC40398. Kejr Inc., Salina, Kansas.
Mack, Thomas J., 1993, Detection of Contaminant Plumes by Borehole Geophysical Logging: Ground Water Monitoring and Remediation. v. 13, no. 1.
Thornton, Daniel, S. Ita, K. Larsen, 1997, Broader Use of Innovative Ground Water Access Technologies: Superfund XVIII Conference Proceedings, Vol. 2.
Kansas Geological Survey
Updated Nov. 24, 1999
Scientific comments to Jim Butler
Web comments to webadmin@kgs.ku.edu
The URL for this page is HTTP://www.kgs.ku.edu/Hydro/Publications/OFR99_40/index.html